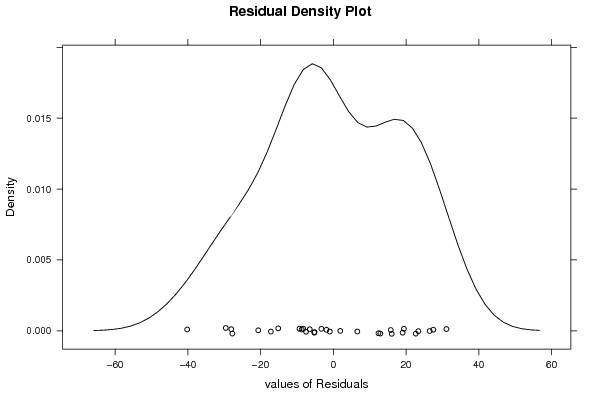
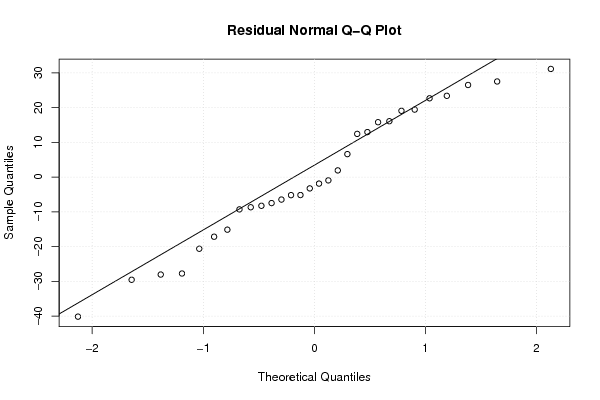
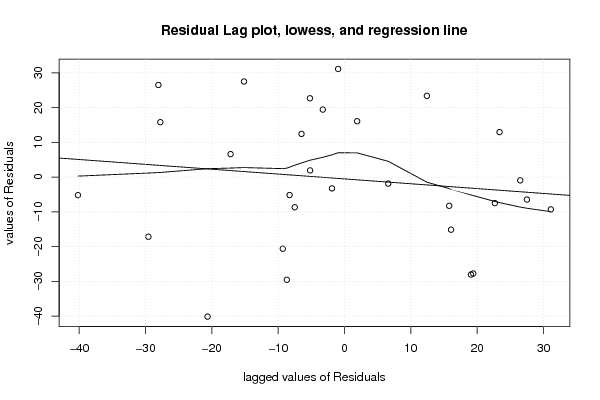
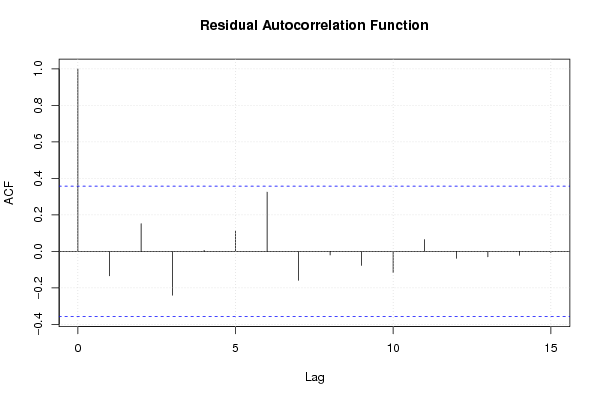
Free Statistics

of Irreproducible Research!

Author's title

Author*Unverified author*
R Software Modulerwasp_multipleregression.wasp
Title produced by softwareMultiple Regression
Date of computationSat, 24 Sep 2011 13:57:35 -0400
Cite this page as followsStatistical Computations at FreeStatistics.org, Office for Research Development and Education, URL https://freestatistics.org/blog/index.php?v=date/2011/Sep/24/t13168878059wsdevojsppayl9.htm/, Retrieved Fri, 17 May 2024 23:27:30 +0000
Statistical Computations at FreeStatistics.org, Office for Research Development and Education, URL https://freestatistics.org/blog/index.php?pk=124359, Retrieved Fri, 17 May 2024 23:27:30 +0000
QR Codes:

Original text written by user:
IsPrivate?No (this computation is public)
User-defined keywords
Estimated Impact194
Family? (F = Feedback message, R = changed R code, M = changed R Module, P = changed Parameters, D = changed Data)
-       [Multiple Regression] [Runs Scored, OPS,...] [2011-09-24 17:57:35] [d41d8cd98f00b204e9800998ecf8427e] [Current]
Feedback Forum

Post a new message
Dataseries X:
851	280	810
836	265	792
819	281	795
744	274	765
732	251	734
732	273	763
716	257	734
714	276	747
705	257	739
697	250	734
694	264	726
685	259	741
685	251	715
679	256	725
678	243	719
675	250	716
651	253	717
643	258	721
639	253	707
634	245	701
626	244	682
621	257	698
608	247	705
606	243	693
599	259	690
594	246	663
586	244	674
575	238	653
553	241	670
544	234	640


Summary of computational transaction
Raw Inputview raw input (R code)
Raw Outputview raw output of R engine
Computing time3 seconds
R Server'Gertrude Mary Cox' @ cox.wessa.net

\begin{tabular}{lllllllll}
\hline
Summary of computational transaction \tabularnewline
Raw Input & view raw input (R code)  \tabularnewline
Raw Output & view raw output of R engine  \tabularnewline
Computing time & 3 seconds \tabularnewline
R Server & 'Gertrude Mary Cox' @ cox.wessa.net \tabularnewline
\hline
\end{tabular}
%Source: https://freestatistics.org/blog/index.php?pk=124359&T=0

[TABLE]
[ROW][C]Summary of computational transaction[/C][/ROW]
[ROW][C]Raw Input[/C][C]view raw input (R code) [/C][/ROW]
[ROW][C]Raw Output[/C][C]view raw output of R engine [/C][/ROW]
[ROW][C]Computing time[/C][C]3 seconds[/C][/ROW]
[ROW][C]R Server[/C][C]'Gertrude Mary Cox' @ cox.wessa.net[/C][/ROW]
[/TABLE]
Source: https://freestatistics.org/blog/index.php?pk=124359&T=0

Globally Unique Identifier (entire table): ba.freestatistics.org/blog/index.php?pk=124359&T=0

As an alternative you can also use a QR Code:  

The GUIDs for individual cells are displayed in the table below:

Summary of computational transaction
Raw Inputview raw input (R code)
Raw Outputview raw output of R engine
Computing time3 seconds
R Server'Gertrude Mary Cox' @ cox.wessa.net


Multiple Linear Regression - Estimated Regression Equation
RUNS[t] = -607.561471729786 -0.761846031552537AVG[t] + 2.04808773922013OPS[t] + e[t]

\begin{tabular}{lllllllll}
\hline
Multiple Linear Regression - Estimated Regression Equation \tabularnewline
RUNS[t] =  -607.561471729786 -0.761846031552537AVG[t] +  2.04808773922013OPS[t]  + e[t] \tabularnewline
\hline
\end{tabular}
%Source: https://freestatistics.org/blog/index.php?pk=124359&T=1

[TABLE]
[ROW][C]Multiple Linear Regression - Estimated Regression Equation[/C][/ROW]
[ROW][C]RUNS[t] =  -607.561471729786 -0.761846031552537AVG[t] +  2.04808773922013OPS[t]  + e[t][/C][/ROW]
[/TABLE]
Source: https://freestatistics.org/blog/index.php?pk=124359&T=1

Globally Unique Identifier (entire table): ba.freestatistics.org/blog/index.php?pk=124359&T=1

As an alternative you can also use a QR Code:  

The GUIDs for individual cells are displayed in the table below:

Multiple Linear Regression - Estimated Regression Equation
RUNS[t] = -607.561471729786 -0.761846031552537AVG[t] + 2.04808773922013OPS[t] + e[t]


Multiple Linear Regression - Ordinary Least Squares
VariableParameterS.D.T-STATH0: parameter = 02-tail p-value1-tail p-value
(Intercept)-607.56147172978675.411693-8.056600
AVG-0.7618460315525370.596893-1.27640.2127010.106351
OPS2.048087739220130.1817111.271200

\begin{tabular}{lllllllll}
\hline
Multiple Linear Regression - Ordinary Least Squares \tabularnewline
Variable & Parameter & S.D. & T-STATH0: parameter = 0 & 2-tail p-value & 1-tail p-value \tabularnewline
(Intercept) & -607.561471729786 & 75.411693 & -8.0566 & 0 & 0 \tabularnewline
AVG & -0.761846031552537 & 0.596893 & -1.2764 & 0.212701 & 0.106351 \tabularnewline
OPS & 2.04808773922013 & 0.18171 & 11.2712 & 0 & 0 \tabularnewline
\hline
\end{tabular}
%Source: https://freestatistics.org/blog/index.php?pk=124359&T=2

[TABLE]
[ROW][C]Multiple Linear Regression - Ordinary Least Squares[/C][/ROW]
[ROW][C]Variable[/C][C]Parameter[/C][C]S.D.[/C][C]T-STATH0: parameter = 0[/C][C]2-tail p-value[/C][C]1-tail p-value[/C][/ROW]
[ROW][C](Intercept)[/C][C]-607.561471729786[/C][C]75.411693[/C][C]-8.0566[/C][C]0[/C][C]0[/C][/ROW]
[ROW][C]AVG[/C][C]-0.761846031552537[/C][C]0.596893[/C][C]-1.2764[/C][C]0.212701[/C][C]0.106351[/C][/ROW]
[ROW][C]OPS[/C][C]2.04808773922013[/C][C]0.18171[/C][C]11.2712[/C][C]0[/C][C]0[/C][/ROW]
[/TABLE]
Source: https://freestatistics.org/blog/index.php?pk=124359&T=2

Globally Unique Identifier (entire table): ba.freestatistics.org/blog/index.php?pk=124359&T=2

As an alternative you can also use a QR Code:  

The GUIDs for individual cells are displayed in the table below:

Multiple Linear Regression - Ordinary Least Squares
VariableParameterS.D.T-STATH0: parameter = 02-tail p-value1-tail p-value
(Intercept)-607.56147172978675.411693-8.056600
AVG-0.7618460315525370.596893-1.27640.2127010.106351
OPS2.048087739220130.1817111.271200


Multiple Linear Regression - Regression Statistics
Multiple R0.969560497980551
R-squared0.940047559244294
Adjusted R-squared0.935606637706834
F-TEST (value)211.678488645854
F-TEST (DF numerator)2
F-TEST (DF denominator)27
p-value0
Multiple Linear Regression - Residual Statistics
Residual Standard Deviation19.7099873260266
Sum Squared Residuals10489.0572105875

\begin{tabular}{lllllllll}
\hline
Multiple Linear Regression - Regression Statistics \tabularnewline
Multiple R & 0.969560497980551 \tabularnewline
R-squared & 0.940047559244294 \tabularnewline
Adjusted R-squared & 0.935606637706834 \tabularnewline
F-TEST (value) & 211.678488645854 \tabularnewline
F-TEST (DF numerator) & 2 \tabularnewline
F-TEST (DF denominator) & 27 \tabularnewline
p-value & 0 \tabularnewline
Multiple Linear Regression - Residual Statistics \tabularnewline
Residual Standard Deviation & 19.7099873260266 \tabularnewline
Sum Squared Residuals & 10489.0572105875 \tabularnewline
\hline
\end{tabular}
%Source: https://freestatistics.org/blog/index.php?pk=124359&T=3

[TABLE]
[ROW][C]Multiple Linear Regression - Regression Statistics[/C][/ROW]
[ROW][C]Multiple R[/C][C]0.969560497980551[/C][/ROW]
[ROW][C]R-squared[/C][C]0.940047559244294[/C][/ROW]
[ROW][C]Adjusted R-squared[/C][C]0.935606637706834[/C][/ROW]
[ROW][C]F-TEST (value)[/C][C]211.678488645854[/C][/ROW]
[ROW][C]F-TEST (DF numerator)[/C][C]2[/C][/ROW]
[ROW][C]F-TEST (DF denominator)[/C][C]27[/C][/ROW]
[ROW][C]p-value[/C][C]0[/C][/ROW]
[ROW][C]Multiple Linear Regression - Residual Statistics[/C][/ROW]
[ROW][C]Residual Standard Deviation[/C][C]19.7099873260266[/C][/ROW]
[ROW][C]Sum Squared Residuals[/C][C]10489.0572105875[/C][/ROW]
[/TABLE]
Source: https://freestatistics.org/blog/index.php?pk=124359&T=3

Globally Unique Identifier (entire table): ba.freestatistics.org/blog/index.php?pk=124359&T=3

As an alternative you can also use a QR Code:  

The GUIDs for individual cells are displayed in the table below:

Multiple Linear Regression - Regression Statistics
Multiple R0.969560497980551
R-squared0.940047559244294
Adjusted R-squared0.935606637706834
F-TEST (value)211.678488645854
F-TEST (DF numerator)2
F-TEST (DF denominator)27
p-value0
Multiple Linear Regression - Residual Statistics
Residual Standard Deviation19.7099873260266
Sum Squared Residuals10489.0572105875


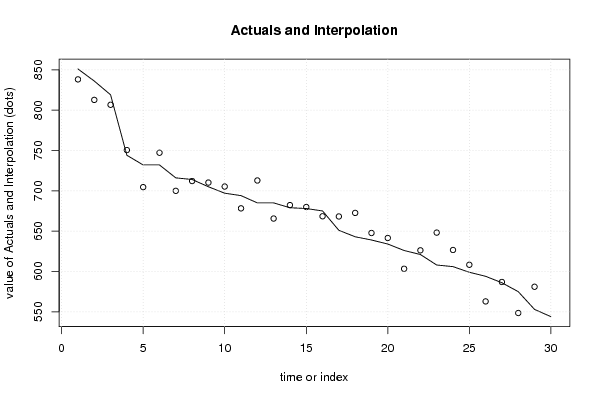
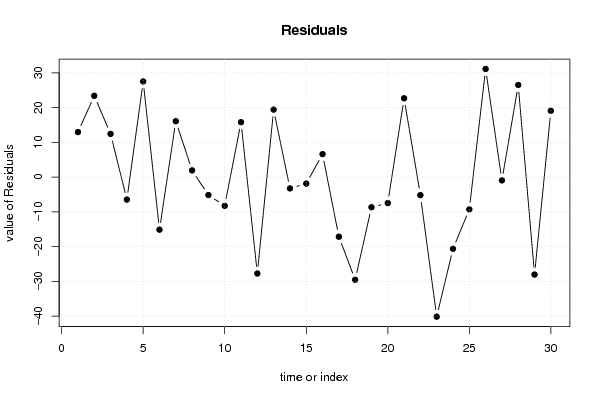
Multiple Linear Regression - Actuals, Interpolation, and Residuals
Time or IndexActualsInterpolationForecastResidualsPrediction Error
1851838.07270820380712.9272917961932
2836812.63481937113323.3651806288671
3819806.58954608395312.4104539160473
4744750.479836128217-6.47983612821659
5732704.51157493810127.488425061899
6732747.145506681329-15.1455066813289
7716699.94049874878616.0595012512142
8714712.0905647591491.90943524085078
9705710.180937444886-5.18093744488641
10697705.273420969654-8.27342096965353
11694678.22287461415715.777125385843
12685712.753420860222-27.7534208602216
13685665.59790789291919.4020921070814
14679682.269555127357-3.26955512735716
15678679.885027102219-1.88502710221937
16675668.4078416636916.59215833630877
17651668.170391308254-17.1703913082537
18643672.553512107372-29.5535121073716
19639647.689513916052-8.68951391605248
20634641.495755733152-7.49575573315201
21626603.34393471952222.6560652804779
22621626.209340136861-5.20934013686118
23608648.164414626927-40.1644146269274
24606626.634745882496-20.6347458824961
25599608.300946159995-9.30094615999507
26594562.90657561123531.0934243887654
27586586.959232805761-0.9592328057611
28575548.52046647145426.4795335285464
29553581.052419943538-28.0524199435382
30544524.94270998780219.0572900121979

\begin{tabular}{lllllllll}
\hline
Multiple Linear Regression - Actuals, Interpolation, and Residuals \tabularnewline
Time or Index & Actuals & InterpolationForecast & ResidualsPrediction Error \tabularnewline
1 & 851 & 838.072708203807 & 12.9272917961932 \tabularnewline
2 & 836 & 812.634819371133 & 23.3651806288671 \tabularnewline
3 & 819 & 806.589546083953 & 12.4104539160473 \tabularnewline
4 & 744 & 750.479836128217 & -6.47983612821659 \tabularnewline
5 & 732 & 704.511574938101 & 27.488425061899 \tabularnewline
6 & 732 & 747.145506681329 & -15.1455066813289 \tabularnewline
7 & 716 & 699.940498748786 & 16.0595012512142 \tabularnewline
8 & 714 & 712.090564759149 & 1.90943524085078 \tabularnewline
9 & 705 & 710.180937444886 & -5.18093744488641 \tabularnewline
10 & 697 & 705.273420969654 & -8.27342096965353 \tabularnewline
11 & 694 & 678.222874614157 & 15.777125385843 \tabularnewline
12 & 685 & 712.753420860222 & -27.7534208602216 \tabularnewline
13 & 685 & 665.597907892919 & 19.4020921070814 \tabularnewline
14 & 679 & 682.269555127357 & -3.26955512735716 \tabularnewline
15 & 678 & 679.885027102219 & -1.88502710221937 \tabularnewline
16 & 675 & 668.407841663691 & 6.59215833630877 \tabularnewline
17 & 651 & 668.170391308254 & -17.1703913082537 \tabularnewline
18 & 643 & 672.553512107372 & -29.5535121073716 \tabularnewline
19 & 639 & 647.689513916052 & -8.68951391605248 \tabularnewline
20 & 634 & 641.495755733152 & -7.49575573315201 \tabularnewline
21 & 626 & 603.343934719522 & 22.6560652804779 \tabularnewline
22 & 621 & 626.209340136861 & -5.20934013686118 \tabularnewline
23 & 608 & 648.164414626927 & -40.1644146269274 \tabularnewline
24 & 606 & 626.634745882496 & -20.6347458824961 \tabularnewline
25 & 599 & 608.300946159995 & -9.30094615999507 \tabularnewline
26 & 594 & 562.906575611235 & 31.0934243887654 \tabularnewline
27 & 586 & 586.959232805761 & -0.9592328057611 \tabularnewline
28 & 575 & 548.520466471454 & 26.4795335285464 \tabularnewline
29 & 553 & 581.052419943538 & -28.0524199435382 \tabularnewline
30 & 544 & 524.942709987802 & 19.0572900121979 \tabularnewline
\hline
\end{tabular}
%Source: https://freestatistics.org/blog/index.php?pk=124359&T=4

[TABLE]
[ROW][C]Multiple Linear Regression - Actuals, Interpolation, and Residuals[/C][/ROW]
[ROW][C]Time or Index[/C][C]Actuals[/C][C]InterpolationForecast[/C][C]ResidualsPrediction Error[/C][/ROW]
[ROW][C]1[/C][C]851[/C][C]838.072708203807[/C][C]12.9272917961932[/C][/ROW]
[ROW][C]2[/C][C]836[/C][C]812.634819371133[/C][C]23.3651806288671[/C][/ROW]
[ROW][C]3[/C][C]819[/C][C]806.589546083953[/C][C]12.4104539160473[/C][/ROW]
[ROW][C]4[/C][C]744[/C][C]750.479836128217[/C][C]-6.47983612821659[/C][/ROW]
[ROW][C]5[/C][C]732[/C][C]704.511574938101[/C][C]27.488425061899[/C][/ROW]
[ROW][C]6[/C][C]732[/C][C]747.145506681329[/C][C]-15.1455066813289[/C][/ROW]
[ROW][C]7[/C][C]716[/C][C]699.940498748786[/C][C]16.0595012512142[/C][/ROW]
[ROW][C]8[/C][C]714[/C][C]712.090564759149[/C][C]1.90943524085078[/C][/ROW]
[ROW][C]9[/C][C]705[/C][C]710.180937444886[/C][C]-5.18093744488641[/C][/ROW]
[ROW][C]10[/C][C]697[/C][C]705.273420969654[/C][C]-8.27342096965353[/C][/ROW]
[ROW][C]11[/C][C]694[/C][C]678.222874614157[/C][C]15.777125385843[/C][/ROW]
[ROW][C]12[/C][C]685[/C][C]712.753420860222[/C][C]-27.7534208602216[/C][/ROW]
[ROW][C]13[/C][C]685[/C][C]665.597907892919[/C][C]19.4020921070814[/C][/ROW]
[ROW][C]14[/C][C]679[/C][C]682.269555127357[/C][C]-3.26955512735716[/C][/ROW]
[ROW][C]15[/C][C]678[/C][C]679.885027102219[/C][C]-1.88502710221937[/C][/ROW]
[ROW][C]16[/C][C]675[/C][C]668.407841663691[/C][C]6.59215833630877[/C][/ROW]
[ROW][C]17[/C][C]651[/C][C]668.170391308254[/C][C]-17.1703913082537[/C][/ROW]
[ROW][C]18[/C][C]643[/C][C]672.553512107372[/C][C]-29.5535121073716[/C][/ROW]
[ROW][C]19[/C][C]639[/C][C]647.689513916052[/C][C]-8.68951391605248[/C][/ROW]
[ROW][C]20[/C][C]634[/C][C]641.495755733152[/C][C]-7.49575573315201[/C][/ROW]
[ROW][C]21[/C][C]626[/C][C]603.343934719522[/C][C]22.6560652804779[/C][/ROW]
[ROW][C]22[/C][C]621[/C][C]626.209340136861[/C][C]-5.20934013686118[/C][/ROW]
[ROW][C]23[/C][C]608[/C][C]648.164414626927[/C][C]-40.1644146269274[/C][/ROW]
[ROW][C]24[/C][C]606[/C][C]626.634745882496[/C][C]-20.6347458824961[/C][/ROW]
[ROW][C]25[/C][C]599[/C][C]608.300946159995[/C][C]-9.30094615999507[/C][/ROW]
[ROW][C]26[/C][C]594[/C][C]562.906575611235[/C][C]31.0934243887654[/C][/ROW]
[ROW][C]27[/C][C]586[/C][C]586.959232805761[/C][C]-0.9592328057611[/C][/ROW]
[ROW][C]28[/C][C]575[/C][C]548.520466471454[/C][C]26.4795335285464[/C][/ROW]
[ROW][C]29[/C][C]553[/C][C]581.052419943538[/C][C]-28.0524199435382[/C][/ROW]
[ROW][C]30[/C][C]544[/C][C]524.942709987802[/C][C]19.0572900121979[/C][/ROW]
[/TABLE]
Source: https://freestatistics.org/blog/index.php?pk=124359&T=4

Globally Unique Identifier (entire table): ba.freestatistics.org/blog/index.php?pk=124359&T=4

As an alternative you can also use a QR Code:  

The GUIDs for individual cells are displayed in the table below:

Multiple Linear Regression - Actuals, Interpolation, and Residuals
Time or IndexActualsInterpolationForecastResidualsPrediction Error
1851838.07270820380712.9272917961932
2836812.63481937113323.3651806288671
3819806.58954608395312.4104539160473
4744750.479836128217-6.47983612821659
5732704.51157493810127.488425061899
6732747.145506681329-15.1455066813289
7716699.94049874878616.0595012512142
8714712.0905647591491.90943524085078
9705710.180937444886-5.18093744488641
10697705.273420969654-8.27342096965353
11694678.22287461415715.777125385843
12685712.753420860222-27.7534208602216
13685665.59790789291919.4020921070814
14679682.269555127357-3.26955512735716
15678679.885027102219-1.88502710221937
16675668.4078416636916.59215833630877
17651668.170391308254-17.1703913082537
18643672.553512107372-29.5535121073716
19639647.689513916052-8.68951391605248
20634641.495755733152-7.49575573315201
21626603.34393471952222.6560652804779
22621626.209340136861-5.20934013686118
23608648.164414626927-40.1644146269274
24606626.634745882496-20.6347458824961
25599608.300946159995-9.30094615999507
26594562.90657561123531.0934243887654
27586586.959232805761-0.9592328057611
28575548.52046647145426.4795335285464
29553581.052419943538-28.0524199435382
30544524.94270998780219.0572900121979


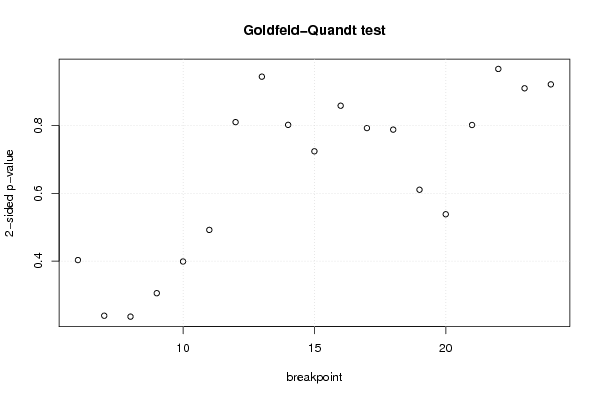
Goldfeld-Quandt test for Heteroskedasticity
p-valuesAlternative Hypothesis
breakpoint indexgreater2-sidedless
60.2016027673805820.4032055347611640.798397232619418
70.1194974604629720.2389949209259440.880502539537028
80.1181433979757470.2362867959514940.881856602024253
90.1527435913338390.3054871826676790.847256408666161
100.1994759219287640.3989518438575280.800524078071236
110.2460469810048070.4920939620096140.753953018995193
120.4049658866076940.8099317732153880.595034113392306
130.4720156567191450.9440313134382890.527984343280855
140.4009491169055660.8018982338111320.599050883094434
150.3619744137068740.7239488274137490.638025586293126
160.4292033906490210.8584067812980410.570796609350979
170.3962503646481950.792500729296390.603749635351805
180.3939286435278340.7878572870556690.606071356472166
190.3052935770847140.6105871541694290.694706422915286
200.2691546063399660.5383092126799310.730845393660034
210.5992434111196570.8015131777606850.400756588880343
220.4834105741253920.9668211482507830.516589425874609
230.4549039890323050.9098079780646090.545096010967695
240.4606894152720950.9213788305441910.539310584727905

\begin{tabular}{lllllllll}
\hline
Goldfeld-Quandt test for Heteroskedasticity \tabularnewline
p-values & Alternative Hypothesis \tabularnewline
breakpoint index & greater & 2-sided & less \tabularnewline
6 & 0.201602767380582 & 0.403205534761164 & 0.798397232619418 \tabularnewline
7 & 0.119497460462972 & 0.238994920925944 & 0.880502539537028 \tabularnewline
8 & 0.118143397975747 & 0.236286795951494 & 0.881856602024253 \tabularnewline
9 & 0.152743591333839 & 0.305487182667679 & 0.847256408666161 \tabularnewline
10 & 0.199475921928764 & 0.398951843857528 & 0.800524078071236 \tabularnewline
11 & 0.246046981004807 & 0.492093962009614 & 0.753953018995193 \tabularnewline
12 & 0.404965886607694 & 0.809931773215388 & 0.595034113392306 \tabularnewline
13 & 0.472015656719145 & 0.944031313438289 & 0.527984343280855 \tabularnewline
14 & 0.400949116905566 & 0.801898233811132 & 0.599050883094434 \tabularnewline
15 & 0.361974413706874 & 0.723948827413749 & 0.638025586293126 \tabularnewline
16 & 0.429203390649021 & 0.858406781298041 & 0.570796609350979 \tabularnewline
17 & 0.396250364648195 & 0.79250072929639 & 0.603749635351805 \tabularnewline
18 & 0.393928643527834 & 0.787857287055669 & 0.606071356472166 \tabularnewline
19 & 0.305293577084714 & 0.610587154169429 & 0.694706422915286 \tabularnewline
20 & 0.269154606339966 & 0.538309212679931 & 0.730845393660034 \tabularnewline
21 & 0.599243411119657 & 0.801513177760685 & 0.400756588880343 \tabularnewline
22 & 0.483410574125392 & 0.966821148250783 & 0.516589425874609 \tabularnewline
23 & 0.454903989032305 & 0.909807978064609 & 0.545096010967695 \tabularnewline
24 & 0.460689415272095 & 0.921378830544191 & 0.539310584727905 \tabularnewline
\hline
\end{tabular}
%Source: https://freestatistics.org/blog/index.php?pk=124359&T=5

[TABLE]
[ROW][C]Goldfeld-Quandt test for Heteroskedasticity[/C][/ROW]
[ROW][C]p-values[/C][C]Alternative Hypothesis[/C][/ROW]
[ROW][C]breakpoint index[/C][C]greater[/C][C]2-sided[/C][C]less[/C][/ROW]
[ROW][C]6[/C][C]0.201602767380582[/C][C]0.403205534761164[/C][C]0.798397232619418[/C][/ROW]
[ROW][C]7[/C][C]0.119497460462972[/C][C]0.238994920925944[/C][C]0.880502539537028[/C][/ROW]
[ROW][C]8[/C][C]0.118143397975747[/C][C]0.236286795951494[/C][C]0.881856602024253[/C][/ROW]
[ROW][C]9[/C][C]0.152743591333839[/C][C]0.305487182667679[/C][C]0.847256408666161[/C][/ROW]
[ROW][C]10[/C][C]0.199475921928764[/C][C]0.398951843857528[/C][C]0.800524078071236[/C][/ROW]
[ROW][C]11[/C][C]0.246046981004807[/C][C]0.492093962009614[/C][C]0.753953018995193[/C][/ROW]
[ROW][C]12[/C][C]0.404965886607694[/C][C]0.809931773215388[/C][C]0.595034113392306[/C][/ROW]
[ROW][C]13[/C][C]0.472015656719145[/C][C]0.944031313438289[/C][C]0.527984343280855[/C][/ROW]
[ROW][C]14[/C][C]0.400949116905566[/C][C]0.801898233811132[/C][C]0.599050883094434[/C][/ROW]
[ROW][C]15[/C][C]0.361974413706874[/C][C]0.723948827413749[/C][C]0.638025586293126[/C][/ROW]
[ROW][C]16[/C][C]0.429203390649021[/C][C]0.858406781298041[/C][C]0.570796609350979[/C][/ROW]
[ROW][C]17[/C][C]0.396250364648195[/C][C]0.79250072929639[/C][C]0.603749635351805[/C][/ROW]
[ROW][C]18[/C][C]0.393928643527834[/C][C]0.787857287055669[/C][C]0.606071356472166[/C][/ROW]
[ROW][C]19[/C][C]0.305293577084714[/C][C]0.610587154169429[/C][C]0.694706422915286[/C][/ROW]
[ROW][C]20[/C][C]0.269154606339966[/C][C]0.538309212679931[/C][C]0.730845393660034[/C][/ROW]
[ROW][C]21[/C][C]0.599243411119657[/C][C]0.801513177760685[/C][C]0.400756588880343[/C][/ROW]
[ROW][C]22[/C][C]0.483410574125392[/C][C]0.966821148250783[/C][C]0.516589425874609[/C][/ROW]
[ROW][C]23[/C][C]0.454903989032305[/C][C]0.909807978064609[/C][C]0.545096010967695[/C][/ROW]
[ROW][C]24[/C][C]0.460689415272095[/C][C]0.921378830544191[/C][C]0.539310584727905[/C][/ROW]
[/TABLE]
Source: https://freestatistics.org/blog/index.php?pk=124359&T=5

Globally Unique Identifier (entire table): ba.freestatistics.org/blog/index.php?pk=124359&T=5

As an alternative you can also use a QR Code:  

The GUIDs for individual cells are displayed in the table below:

Goldfeld-Quandt test for Heteroskedasticity
p-valuesAlternative Hypothesis
breakpoint indexgreater2-sidedless
60.2016027673805820.4032055347611640.798397232619418
70.1194974604629720.2389949209259440.880502539537028
80.1181433979757470.2362867959514940.881856602024253
90.1527435913338390.3054871826676790.847256408666161
100.1994759219287640.3989518438575280.800524078071236
110.2460469810048070.4920939620096140.753953018995193
120.4049658866076940.8099317732153880.595034113392306
130.4720156567191450.9440313134382890.527984343280855
140.4009491169055660.8018982338111320.599050883094434
150.3619744137068740.7239488274137490.638025586293126
160.4292033906490210.8584067812980410.570796609350979
170.3962503646481950.792500729296390.603749635351805
180.3939286435278340.7878572870556690.606071356472166
190.3052935770847140.6105871541694290.694706422915286
200.2691546063399660.5383092126799310.730845393660034
210.5992434111196570.8015131777606850.400756588880343
220.4834105741253920.9668211482507830.516589425874609
230.4549039890323050.9098079780646090.545096010967695
240.4606894152720950.9213788305441910.539310584727905


Meta Analysis of Goldfeld-Quandt test for Heteroskedasticity
Description# significant tests% significant testsOK/NOK
1% type I error level00OK
5% type I error level00OK
10% type I error level00OK

\begin{tabular}{lllllllll}
\hline
Meta Analysis of Goldfeld-Quandt test for Heteroskedasticity \tabularnewline
Description & # significant tests & % significant tests & OK/NOK \tabularnewline
1% type I error level & 0 & 0 & OK \tabularnewline
5% type I error level & 0 & 0 & OK \tabularnewline
10% type I error level & 0 & 0 & OK \tabularnewline
\hline
\end{tabular}
%Source: https://freestatistics.org/blog/index.php?pk=124359&T=6

[TABLE]
[ROW][C]Meta Analysis of Goldfeld-Quandt test for Heteroskedasticity[/C][/ROW]
[ROW][C]Description[/C][C]# significant tests[/C][C]% significant tests[/C][C]OK/NOK[/C][/ROW]
[ROW][C]1% type I error level[/C][C]0[/C][C]0[/C][C]OK[/C][/ROW]
[ROW][C]5% type I error level[/C][C]0[/C][C]0[/C][C]OK[/C][/ROW]
[ROW][C]10% type I error level[/C][C]0[/C][C]0[/C][C]OK[/C][/ROW]
[/TABLE]
Source: https://freestatistics.org/blog/index.php?pk=124359&T=6

Globally Unique Identifier (entire table): ba.freestatistics.org/blog/index.php?pk=124359&T=6

As an alternative you can also use a QR Code:  

The GUIDs for individual cells are displayed in the table below:

Meta Analysis of Goldfeld-Quandt test for Heteroskedasticity
Description# significant tests% significant testsOK/NOK
1% type I error level00OK
5% type I error level00OK
10% type I error level00OK


Parameters (Session):
par1 = 1 ; par2 = Do not include Seasonal Dummies ; par3 = No Linear Trend ;
Parameters (R input):
par1 = 1 ; par2 = Do not include Seasonal Dummies ; par3 = No Linear Trend ;
R code (references can be found in the software module):
library(lattice)
library(lmtest)
n25 <- 25 #minimum number of obs. for Goldfeld-Quandt test
par1 <- as.numeric(par1)
x <- t(y)
k <- length(x[1,])
n <- length(x[,1])
x1 <- cbind(x[,par1], x[,1:k!=par1])
mycolnames <- c(colnames(x)[par1], colnames(x)[1:k!=par1])
colnames(x1) <- mycolnames #colnames(x)[par1]
x <- x1
if (par3 == 'First Differences'){
x2 <- array(0, dim=c(n-1,k), dimnames=list(1:(n-1), paste('(1-B)',colnames(x),sep='')))
for (i in 1:n-1) {
for (j in 1:k) {
x2[i,j] <- x[i+1,j] - x[i,j]
}
}
x <- x2
}
if (par2 == 'Include Monthly Dummies'){
x2 <- array(0, dim=c(n,11), dimnames=list(1:n, paste('M', seq(1:11), sep ='')))
for (i in 1:11){
x2[seq(i,n,12),i] <- 1
}
x <- cbind(x, x2)
}
if (par2 == 'Include Quarterly Dummies'){
x2 <- array(0, dim=c(n,3), dimnames=list(1:n, paste('Q', seq(1:3), sep ='')))
for (i in 1:3){
x2[seq(i,n,4),i] <- 1
}
x <- cbind(x, x2)
}
k <- length(x[1,])
if (par3 == 'Linear Trend'){
x <- cbind(x, c(1:n))
colnames(x)[k+1] <- 't'
}
x
k <- length(x[1,])
df <- as.data.frame(x)
(mylm <- lm(df))
(mysum <- summary(mylm))
if (n > n25) {
kp3 <- k + 3
nmkm3 <- n - k - 3
gqarr <- array(NA, dim=c(nmkm3-kp3+1,3))
numgqtests <- 0
numsignificant1 <- 0
numsignificant5 <- 0
numsignificant10 <- 0
for (mypoint in kp3:nmkm3) {
j <- 0
numgqtests <- numgqtests + 1
for (myalt in c('greater', 'two.sided', 'less')) {
j <- j + 1
gqarr[mypoint-kp3+1,j] <- gqtest(mylm, point=mypoint, alternative=myalt)$p.value
}
if (gqarr[mypoint-kp3+1,2] < 0.01) numsignificant1 <- numsignificant1 + 1
if (gqarr[mypoint-kp3+1,2] < 0.05) numsignificant5 <- numsignificant5 + 1
if (gqarr[mypoint-kp3+1,2] < 0.10) numsignificant10 <- numsignificant10 + 1
}
gqarr
}
bitmap(file='test0.png')
plot(x[,1], type='l', main='Actuals and Interpolation', ylab='value of Actuals and Interpolation (dots)', xlab='time or index')
points(x[,1]-mysum$resid)
grid()
dev.off()
bitmap(file='test1.png')
plot(mysum$resid, type='b', pch=19, main='Residuals', ylab='value of Residuals', xlab='time or index')
grid()
dev.off()
bitmap(file='test2.png')
hist(mysum$resid, main='Residual Histogram', xlab='values of Residuals')
grid()
dev.off()
bitmap(file='test3.png')
densityplot(~mysum$resid,col='black',main='Residual Density Plot', xlab='values of Residuals')
dev.off()
bitmap(file='test4.png')
qqnorm(mysum$resid, main='Residual Normal Q-Q Plot')
qqline(mysum$resid)
grid()
dev.off()
(myerror <- as.ts(mysum$resid))
bitmap(file='test5.png')
dum <- cbind(lag(myerror,k=1),myerror)
dum
dum1 <- dum[2:length(myerror),]
dum1
z <- as.data.frame(dum1)
z
plot(z,main=paste('Residual Lag plot, lowess, and regression line'), ylab='values of Residuals', xlab='lagged values of Residuals')
lines(lowess(z))
abline(lm(z))
grid()
dev.off()
bitmap(file='test6.png')
acf(mysum$resid, lag.max=length(mysum$resid)/2, main='Residual Autocorrelation Function')
grid()
dev.off()
bitmap(file='test7.png')
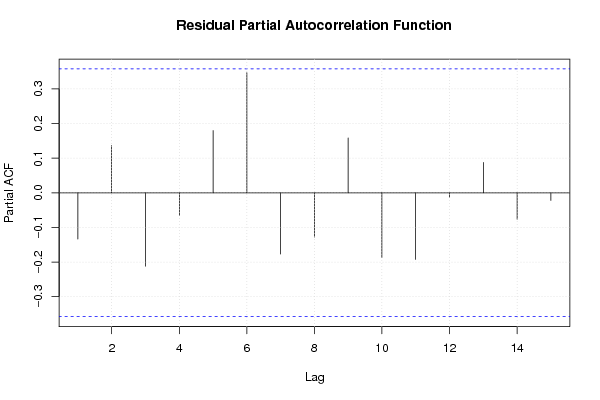
pacf(mysum$resid, lag.max=length(mysum$resid)/2, main='Residual Partial Autocorrelation Function')
grid()
dev.off()
bitmap(file='test8.png')
opar <- par(mfrow = c(2,2), oma = c(0, 0, 1.1, 0))
plot(mylm, las = 1, sub='Residual Diagnostics')
par(opar)
dev.off()
if (n > n25) {
bitmap(file='test9.png')
plot(kp3:nmkm3,gqarr[,2], main='Goldfeld-Quandt test',ylab='2-sided p-value',xlab='breakpoint')
grid()
dev.off()
}
load(file='createtable')
a<-table.start()
a<-table.row.start(a)
a<-table.element(a, 'Multiple Linear Regression - Estimated Regression Equation', 1, TRUE)
a<-table.row.end(a)
myeq <- colnames(x)[1]
myeq <- paste(myeq, '[t] = ', sep='')
for (i in 1:k){
if (mysum$coefficients[i,1] > 0) myeq <- paste(myeq, '+', '')
myeq <- paste(myeq, mysum$coefficients[i,1], sep=' ')
if (rownames(mysum$coefficients)[i] != '(Intercept)') {
myeq <- paste(myeq, rownames(mysum$coefficients)[i], sep='')
if (rownames(mysum$coefficients)[i] != 't') myeq <- paste(myeq, '[t]', sep='')
}
}
myeq <- paste(myeq, ' + e[t]')
a<-table.row.start(a)
a<-table.element(a, myeq)
a<-table.row.end(a)
a<-table.end(a)
table.save(a,file='mytable1.tab')
a<-table.start()
a<-table.row.start(a)
a<-table.element(a,hyperlink('ols1.htm','Multiple Linear Regression - Ordinary Least Squares',''), 6, TRUE)
a<-table.row.end(a)
a<-table.row.start(a)
a<-table.element(a,'Variable',header=TRUE)
a<-table.element(a,'Parameter',header=TRUE)
a<-table.element(a,'S.D.',header=TRUE)
a<-table.element(a,'T-STAT
H0: parameter = 0',header=TRUE)
a<-table.element(a,'2-tail p-value',header=TRUE)
a<-table.element(a,'1-tail p-value',header=TRUE)
a<-table.row.end(a)
for (i in 1:k){
a<-table.row.start(a)
a<-table.element(a,rownames(mysum$coefficients)[i],header=TRUE)
a<-table.element(a,mysum$coefficients[i,1])
a<-table.element(a, round(mysum$coefficients[i,2],6))
a<-table.element(a, round(mysum$coefficients[i,3],4))
a<-table.element(a, round(mysum$coefficients[i,4],6))
a<-table.element(a, round(mysum$coefficients[i,4]/2,6))
a<-table.row.end(a)
}
a<-table.end(a)
table.save(a,file='mytable2.tab')
a<-table.start()
a<-table.row.start(a)
a<-table.element(a, 'Multiple Linear Regression - Regression Statistics', 2, TRUE)
a<-table.row.end(a)
a<-table.row.start(a)
a<-table.element(a, 'Multiple R',1,TRUE)
a<-table.element(a, sqrt(mysum$r.squared))
a<-table.row.end(a)
a<-table.row.start(a)
a<-table.element(a, 'R-squared',1,TRUE)
a<-table.element(a, mysum$r.squared)
a<-table.row.end(a)
a<-table.row.start(a)
a<-table.element(a, 'Adjusted R-squared',1,TRUE)
a<-table.element(a, mysum$adj.r.squared)
a<-table.row.end(a)
a<-table.row.start(a)
a<-table.element(a, 'F-TEST (value)',1,TRUE)
a<-table.element(a, mysum$fstatistic[1])
a<-table.row.end(a)
a<-table.row.start(a)
a<-table.element(a, 'F-TEST (DF numerator)',1,TRUE)
a<-table.element(a, mysum$fstatistic[2])
a<-table.row.end(a)
a<-table.row.start(a)
a<-table.element(a, 'F-TEST (DF denominator)',1,TRUE)
a<-table.element(a, mysum$fstatistic[3])
a<-table.row.end(a)
a<-table.row.start(a)
a<-table.element(a, 'p-value',1,TRUE)
a<-table.element(a, 1-pf(mysum$fstatistic[1],mysum$fstatistic[2],mysum$fstatistic[3]))
a<-table.row.end(a)
a<-table.row.start(a)
a<-table.element(a, 'Multiple Linear Regression - Residual Statistics', 2, TRUE)
a<-table.row.end(a)
a<-table.row.start(a)
a<-table.element(a, 'Residual Standard Deviation',1,TRUE)
a<-table.element(a, mysum$sigma)
a<-table.row.end(a)
a<-table.row.start(a)
a<-table.element(a, 'Sum Squared Residuals',1,TRUE)
a<-table.element(a, sum(myerror*myerror))
a<-table.row.end(a)
a<-table.end(a)
table.save(a,file='mytable3.tab')
a<-table.start()
a<-table.row.start(a)
a<-table.element(a, 'Multiple Linear Regression - Actuals, Interpolation, and Residuals', 4, TRUE)
a<-table.row.end(a)
a<-table.row.start(a)
a<-table.element(a, 'Time or Index', 1, TRUE)
a<-table.element(a, 'Actuals', 1, TRUE)
a<-table.element(a, 'Interpolation
Forecast', 1, TRUE)
a<-table.element(a, 'Residuals
Prediction Error', 1, TRUE)
a<-table.row.end(a)
for (i in 1:n) {
a<-table.row.start(a)
a<-table.element(a,i, 1, TRUE)
a<-table.element(a,x[i])
a<-table.element(a,x[i]-mysum$resid[i])
a<-table.element(a,mysum$resid[i])
a<-table.row.end(a)
}
a<-table.end(a)
table.save(a,file='mytable4.tab')
if (n > n25) {
a<-table.start()
a<-table.row.start(a)
a<-table.element(a,'Goldfeld-Quandt test for Heteroskedasticity',4,TRUE)
a<-table.row.end(a)
a<-table.row.start(a)
a<-table.element(a,'p-values',header=TRUE)
a<-table.element(a,'Alternative Hypothesis',3,header=TRUE)
a<-table.row.end(a)
a<-table.row.start(a)
a<-table.element(a,'breakpoint index',header=TRUE)
a<-table.element(a,'greater',header=TRUE)
a<-table.element(a,'2-sided',header=TRUE)
a<-table.element(a,'less',header=TRUE)
a<-table.row.end(a)
for (mypoint in kp3:nmkm3) {
a<-table.row.start(a)
a<-table.element(a,mypoint,header=TRUE)
a<-table.element(a,gqarr[mypoint-kp3+1,1])
a<-table.element(a,gqarr[mypoint-kp3+1,2])
a<-table.element(a,gqarr[mypoint-kp3+1,3])
a<-table.row.end(a)
}
a<-table.end(a)
table.save(a,file='mytable5.tab')
a<-table.start()
a<-table.row.start(a)
a<-table.element(a,'Meta Analysis of Goldfeld-Quandt test for Heteroskedasticity',4,TRUE)
a<-table.row.end(a)
a<-table.row.start(a)
a<-table.element(a,'Description',header=TRUE)
a<-table.element(a,'# significant tests',header=TRUE)
a<-table.element(a,'% significant tests',header=TRUE)
a<-table.element(a,'OK/NOK',header=TRUE)
a<-table.row.end(a)
a<-table.row.start(a)
a<-table.element(a,'1% type I error level',header=TRUE)
a<-table.element(a,numsignificant1)
a<-table.element(a,numsignificant1/numgqtests)
if (numsignificant1/numgqtests < 0.01) dum <- 'OK' else dum <- 'NOK'
a<-table.element(a,dum)
a<-table.row.end(a)
a<-table.row.start(a)
a<-table.element(a,'5% type I error level',header=TRUE)
a<-table.element(a,numsignificant5)
a<-table.element(a,numsignificant5/numgqtests)
if (numsignificant5/numgqtests < 0.05) dum <- 'OK' else dum <- 'NOK'
a<-table.element(a,dum)
a<-table.row.end(a)
a<-table.row.start(a)
a<-table.element(a,'10% type I error level',header=TRUE)
a<-table.element(a,numsignificant10)
a<-table.element(a,numsignificant10/numgqtests)
if (numsignificant10/numgqtests < 0.1) dum <- 'OK' else dum <- 'NOK'
a<-table.element(a,dum)
a<-table.row.end(a)
a<-table.end(a)
table.save(a,file='mytable6.tab')
}