Free Statistics
of Irreproducible Research!
Description of Statistical Computation | |||||||||||||||||||||||||||||||||||||||||||||||||||||||||||||||||||||||||||||||||||||||||||||||||||||||||||||||||||||||||||||||||||||||||||||||||||||||||||||||||||||||||||
|---|---|---|---|---|---|---|---|---|---|---|---|---|---|---|---|---|---|---|---|---|---|---|---|---|---|---|---|---|---|---|---|---|---|---|---|---|---|---|---|---|---|---|---|---|---|---|---|---|---|---|---|---|---|---|---|---|---|---|---|---|---|---|---|---|---|---|---|---|---|---|---|---|---|---|---|---|---|---|---|---|---|---|---|---|---|---|---|---|---|---|---|---|---|---|---|---|---|---|---|---|---|---|---|---|---|---|---|---|---|---|---|---|---|---|---|---|---|---|---|---|---|---|---|---|---|---|---|---|---|---|---|---|---|---|---|---|---|---|---|---|---|---|---|---|---|---|---|---|---|---|---|---|---|---|---|---|---|---|---|---|---|---|---|---|---|---|---|---|---|---|---|
| Author's title | |||||||||||||||||||||||||||||||||||||||||||||||||||||||||||||||||||||||||||||||||||||||||||||||||||||||||||||||||||||||||||||||||||||||||||||||||||||||||||||||||||||||||||
| Author | *The author of this computation has been verified* | ||||||||||||||||||||||||||||||||||||||||||||||||||||||||||||||||||||||||||||||||||||||||||||||||||||||||||||||||||||||||||||||||||||||||||||||||||||||||||||||||||||||||||
| R Software Module | rwasp_CARE Data Boxplot.wasp | ||||||||||||||||||||||||||||||||||||||||||||||||||||||||||||||||||||||||||||||||||||||||||||||||||||||||||||||||||||||||||||||||||||||||||||||||||||||||||||||||||||||||||
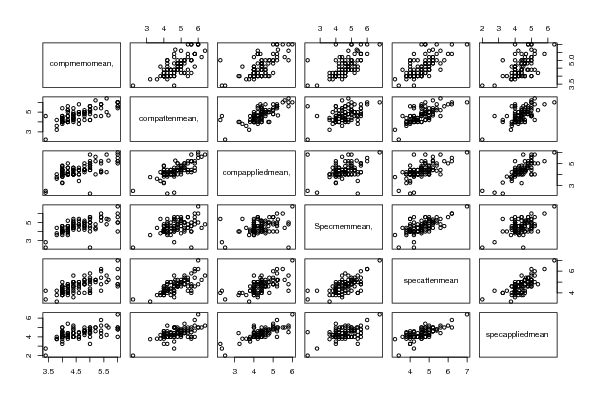
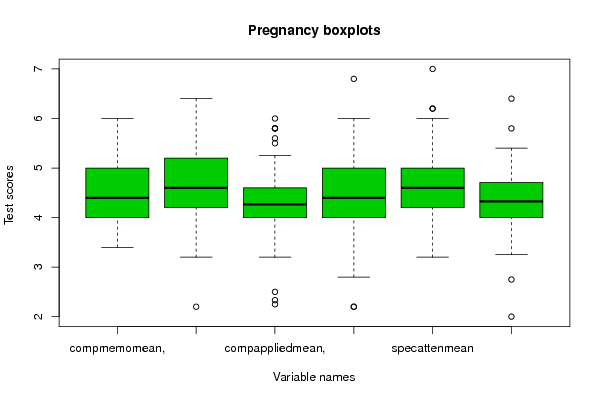
| Title produced by software | CARE Data - Boxplots and Scatterplot Matrix | ||||||||||||||||||||||||||||||||||||||||||||||||||||||||||||||||||||||||||||||||||||||||||||||||||||||||||||||||||||||||||||||||||||||||||||||||||||||||||||||||||||||||||
| Date of computation | Mon, 31 Oct 2011 08:37:01 -0400 | ||||||||||||||||||||||||||||||||||||||||||||||||||||||||||||||||||||||||||||||||||||||||||||||||||||||||||||||||||||||||||||||||||||||||||||||||||||||||||||||||||||||||||
| Cite this page as follows | Statistical Computations at FreeStatistics.org, Office for Research Development and Education, URL https://freestatistics.org/blog/index.php?v=date/2011/Oct/31/t1320064685qj47vqtc9q8tl7r.htm/, Retrieved Thu, 16 May 2024 03:43:14 +0000 | ||||||||||||||||||||||||||||||||||||||||||||||||||||||||||||||||||||||||||||||||||||||||||||||||||||||||||||||||||||||||||||||||||||||||||||||||||||||||||||||||||||||||||
| Statistical Computations at FreeStatistics.org, Office for Research Development and Education, URL https://freestatistics.org/blog/index.php?pk=138269, Retrieved Thu, 16 May 2024 03:43:14 +0000 | |||||||||||||||||||||||||||||||||||||||||||||||||||||||||||||||||||||||||||||||||||||||||||||||||||||||||||||||||||||||||||||||||||||||||||||||||||||||||||||||||||||||||||
| QR Codes: | |||||||||||||||||||||||||||||||||||||||||||||||||||||||||||||||||||||||||||||||||||||||||||||||||||||||||||||||||||||||||||||||||||||||||||||||||||||||||||||||||||||||||||
|
| |||||||||||||||||||||||||||||||||||||||||||||||||||||||||||||||||||||||||||||||||||||||||||||||||||||||||||||||||||||||||||||||||||||||||||||||||||||||||||||||||||||||||||
| Original text written by user: | |||||||||||||||||||||||||||||||||||||||||||||||||||||||||||||||||||||||||||||||||||||||||||||||||||||||||||||||||||||||||||||||||||||||||||||||||||||||||||||||||||||||||||
| IsPrivate? | No (this computation is public) | ||||||||||||||||||||||||||||||||||||||||||||||||||||||||||||||||||||||||||||||||||||||||||||||||||||||||||||||||||||||||||||||||||||||||||||||||||||||||||||||||||||||||||
| User-defined keywords | |||||||||||||||||||||||||||||||||||||||||||||||||||||||||||||||||||||||||||||||||||||||||||||||||||||||||||||||||||||||||||||||||||||||||||||||||||||||||||||||||||||||||||
| Estimated Impact | 81 | ||||||||||||||||||||||||||||||||||||||||||||||||||||||||||||||||||||||||||||||||||||||||||||||||||||||||||||||||||||||||||||||||||||||||||||||||||||||||||||||||||||||||||
Tree of Dependent Computations | |||||||||||||||||||||||||||||||||||||||||||||||||||||||||||||||||||||||||||||||||||||||||||||||||||||||||||||||||||||||||||||||||||||||||||||||||||||||||||||||||||||||||||
| Family? (F = Feedback message, R = changed R code, M = changed R Module, P = changed Parameters, D = changed Data) | |||||||||||||||||||||||||||||||||||||||||||||||||||||||||||||||||||||||||||||||||||||||||||||||||||||||||||||||||||||||||||||||||||||||||||||||||||||||||||||||||||||||||||
| - [Boxplot and Trimmed Means] [Care Age 10 Data] [2009-10-26 09:01:50] [98fd0e87c3eb04e0cc2efde01dbafab6] - PD [Boxplot and Trimmed Means] [Care Age 7 Data] [2009-10-26 18:36:29] [98fd0e87c3eb04e0cc2efde01dbafab6] - P [CARE Data - Boxplots and Scatterplot Matrix] [CARE Data] [2010-10-19 14:16:27] [3fdd735c61ad38cbc9b3393dc997cdb7] - RM [CARE Data - Boxplots and Scatterplot Matrix] [CARE data - works...] [2011-10-17 10:23:12] [98fd0e87c3eb04e0cc2efde01dbafab6] - R [CARE Data - Boxplots and Scatterplot Matrix] [exercise 1] [2011-10-20 12:10:56] [7ea38fd282b91216ab82daacee092d04] - D [CARE Data - Boxplots and Scatterplot Matrix] [Correlations for ...] [2011-10-31 12:37:01] [7911f7583334c51f721acd2b2c851286] [Current] | |||||||||||||||||||||||||||||||||||||||||||||||||||||||||||||||||||||||||||||||||||||||||||||||||||||||||||||||||||||||||||||||||||||||||||||||||||||||||||||||||||||||||||
| Feedback Forum | |||||||||||||||||||||||||||||||||||||||||||||||||||||||||||||||||||||||||||||||||||||||||||||||||||||||||||||||||||||||||||||||||||||||||||||||||||||||||||||||||||||||||||
Post a new message | |||||||||||||||||||||||||||||||||||||||||||||||||||||||||||||||||||||||||||||||||||||||||||||||||||||||||||||||||||||||||||||||||||||||||||||||||||||||||||||||||||||||||||
Dataset | |||||||||||||||||||||||||||||||||||||||||||||||||||||||||||||||||||||||||||||||||||||||||||||||||||||||||||||||||||||||||||||||||||||||||||||||||||||||||||||||||||||||||||
| Dataseries X: | |||||||||||||||||||||||||||||||||||||||||||||||||||||||||||||||||||||||||||||||||||||||||||||||||||||||||||||||||||||||||||||||||||||||||||||||||||||||||||||||||||||||||||
4.8 5 4.4 4.6 4.8 4.6 5.4 5.4 4.2 5.6 4.2 4 6 5.6 5.2 4 4.6 4.8 6 5.6 5.2 5 4.8 4 4 5.4 4.4 4.4 4.6 5 6 6 5.5 6 6.2 5 4.2 4 4 4 4.4 4 4.2 4.2 4 4.4 4.2 4 4.2 4.6 4 4.6 4 4.4 4 4.2 3.8 4 4.2 4 4.6 4.2 4 4.8 4.4 4 5.666666667 4.666666667 5.25 5.333333333 5.2 5 3.8 3.6 3.6 4.4 3.8 3.8 4.8 5 4.4 5.2 5.2 4.6 4.2 4.6 4 5.2 4.6 4 4 4 4.4 4 4.2 4.6 5.4 5.8 4.333333333 5.2 5.4 4.666666667 4.6 5.8 4.6 4.8 4.6 4 4 4 4 4 4.4 4 4.4 5.4 4.4 4.4 5 4.4 5 4.8 5 5.6 4.8 4.8 5.4 5.8 5.2 6 6.2 5.8 5.2 5.4 5.2 4.8 5.2 4.6 4.4 4.8 4.6 4.2 4.6 4.75 4 4.6 4.6 4 4.6 5 3.4 4.6 2.333333333 2.8 4.2 2.75 4.4 4 4 4.8 4 4 4 4 3.8 4.2 4.6 3.8 4.4 4.8 4 4.8 4.6 4.4 4.4 5 4.6 5.2 5 4.8 4 4 4.75 4.6 4.6 4.25 4.8 5.2 4.4 4.4 5.6 4.4 4 4 4 4 4 4 4 4.4 4 3.6 3.8 4.5 5 5.6 5.2 4.6 5.8 5 4 4.6 3.8 4 4.2 3.5 3.4 2.2 2.5 2.2 3.4 2 4 4 3.2 4 3.8 4.4 5.4 4.6 4.2 5.6 4.8 4.4 4.2 4.2 4 3.6 4.2 4.25 4 4 3.25 4 4 3.25 5.6 5 4.2 5.4 5 4.2 4.8 5 4.75 5 5 4.75 4.4 4.8 4.4 4.4 4.6 4.4 4.6 5 4 4.6 5 4 4 3.8 4.2 3.8 3.8 4.2 5.2 4.6 4 4.25 5 5 4.8 4.2 4.2 4.6 4.8 4.6 4.6 5 4.4 5.2 5 4.4 4 4 4 4 4.2 4 4.2 5.2 4.6 4.2 4.8 4.4 4.6 4.8 4.4 4.2 4.6 4.5 4.4 4.2 4 4.6 5 5.2 5 5 4.8 5.6 5 4.4 5 4.2 2.25 5.4 4 3.25 4 4 4.8 4 4 4.6 3.8 3.2 3.75 3.6 3.2 3.75 5.2 6.2 5.6 4.4 5.2 5 4.2 5.6 4.2 4.6 4.6 3.8 4.4 4.6 4.2 4.4 3.6 4 4.2 5.2 5 4 4.8 5.4 6 6 5.8 5 4.8 5 4.8 4.8 5 4.8 4.8 5 4 4 4 4 4 4.2 4.4 4.4 4.4 4.6 5 4.4 4 4.4 4.4 4 4.4 4 4.8 4.8 4.4 5 5.2 4.6 4.8 4.6 4.4 4.2 4 4.2 5.6 6.4 5.8 4.8 5.6 5.2 6 6 6 6.8 7 6.4 4 4.2 4 4 4.2 4 4.2 4 4 4.2 4 4 5 5.2 5 5 5.2 5 4.4 4.4 4 5 4.2 4 4.2 4.6 4.2 4.6 4.6 4.2 4.6 4.8 4.4 4.8 4.8 4 4.4 4.2 4 5 4.8 4 4 4 4 4.2 4 4 4 4.2 4 4 4.4 4 4 4 4.2 4 4 4 4.2 5 4.6 3.8 4.6 4.2 4 4 4.4 4.6 4.2 4 5 5.6 4.4 4 4 4 4.2 4 4 4.2 3.8 4 5.4 5.8 5 5.6 6 5.2 4 4.4 4.2 4 5 4.2 6 5.4 5 5.6 5.4 4.8 3.8 4.2 4 3.8 4.2 4 5 5.2 4.8 5 5.4 4.8 4.4 4.6 4 5.4 5.6 5 5 5.2 4.6 5 5.2 4.6 4.4 4.4 4 4.4 4.4 4 5 4.2 4.4 4.4 4.4 4.4 4.2 4 4 4 4.2 4 4.6 3.8 3.4 5.4 4 3.8 5 5.6 5.8 2.2 4.2 4.5 | |||||||||||||||||||||||||||||||||||||||||||||||||||||||||||||||||||||||||||||||||||||||||||||||||||||||||||||||||||||||||||||||||||||||||||||||||||||||||||||||||||||||||||
Tables (Output of Computation) | |||||||||||||||||||||||||||||||||||||||||||||||||||||||||||||||||||||||||||||||||||||||||||||||||||||||||||||||||||||||||||||||||||||||||||||||||||||||||||||||||||||||||||
| |||||||||||||||||||||||||||||||||||||||||||||||||||||||||||||||||||||||||||||||||||||||||||||||||||||||||||||||||||||||||||||||||||||||||||||||||||||||||||||||||||||||||||
Figures (Output of Computation) | |||||||||||||||||||||||||||||||||||||||||||||||||||||||||||||||||||||||||||||||||||||||||||||||||||||||||||||||||||||||||||||||||||||||||||||||||||||||||||||||||||||||||||
Input Parameters & R Code | |||||||||||||||||||||||||||||||||||||||||||||||||||||||||||||||||||||||||||||||||||||||||||||||||||||||||||||||||||||||||||||||||||||||||||||||||||||||||||||||||||||||||||
| Parameters (Session): | |||||||||||||||||||||||||||||||||||||||||||||||||||||||||||||||||||||||||||||||||||||||||||||||||||||||||||||||||||||||||||||||||||||||||||||||||||||||||||||||||||||||||||
| par1 = 3 ; par2 = FALSE ; par3 = 0 ; | |||||||||||||||||||||||||||||||||||||||||||||||||||||||||||||||||||||||||||||||||||||||||||||||||||||||||||||||||||||||||||||||||||||||||||||||||||||||||||||||||||||||||||
| Parameters (R input): | |||||||||||||||||||||||||||||||||||||||||||||||||||||||||||||||||||||||||||||||||||||||||||||||||||||||||||||||||||||||||||||||||||||||||||||||||||||||||||||||||||||||||||
| par1 = 3 ; par2 = FALSE ; par3 = 0 ; | |||||||||||||||||||||||||||||||||||||||||||||||||||||||||||||||||||||||||||||||||||||||||||||||||||||||||||||||||||||||||||||||||||||||||||||||||||||||||||||||||||||||||||
| R code (references can be found in the software module): | |||||||||||||||||||||||||||||||||||||||||||||||||||||||||||||||||||||||||||||||||||||||||||||||||||||||||||||||||||||||||||||||||||||||||||||||||||||||||||||||||||||||||||
par1 <- as.numeric(par1) #colour | |||||||||||||||||||||||||||||||||||||||||||||||||||||||||||||||||||||||||||||||||||||||||||||||||||||||||||||||||||||||||||||||||||||||||||||||||||||||||||||||||||||||||||