Free Statistics

of Irreproducible Research!

Author's title

Author*Unverified author*
R Software Modulerwasp_centraltendency.wasp
Title produced by softwareCentral Tendency
Date of computationWed, 19 Oct 2011 13:50:32 -0400
Cite this page as followsStatistical Computations at FreeStatistics.org, Office for Research Development and Education, URL https://freestatistics.org/blog/index.php?v=date/2011/Oct/19/t1319046711spuhyzvq953ddsf.htm/, Retrieved Thu, 16 May 2024 00:32:26 +0000
Statistical Computations at FreeStatistics.org, Office for Research Development and Education, URL https://freestatistics.org/blog/index.php?pk=132821, Retrieved Thu, 16 May 2024 00:32:26 +0000
QR Codes:

Original text written by user:
IsPrivate?No (this computation is public)
User-defined keywordsKDG2011W52a
Estimated Impact67
Family? (F = Feedback message, R = changed R code, M = changed R Module, P = changed Parameters, D = changed Data)
-       [Central Tendency] [Centrummaten eige...] [2011-10-19 17:50:32] [08867764ea6bb9e6f4e56ad4eb4305bb] [Current]
Feedback Forum

Post a new message
Dataseries X:
121
117,7
115,4
114,3
109,5
108,1
108,2
99,1
101,2
98,1
95,5
97,9
98,2
98,7
95,6
95,8
94,4
96,5
103,3
104,3
104,5
102,3
103,8
103,1
102,2
106,3
102,1
94
102,6
102,6
106,7
107,9
109,3
105,9
109,1
108,5
111,7
109,8
109,1
108,5
108,5
106,2
117,1
109,8
115,2
115,9
119,2
121
118,6
117,6
114,6
110,6
102,5
101,6
107,4
105,8
102,8
104
100,4
100,6
107,9
106,9
106,5
103
90,5
90,6
94,4
89,4
92,5
94,4
91,7
93,3


Summary of computational transaction
Raw Inputview raw input (R code)
Raw Outputview raw output of R engine
Computing time2 seconds
R Server'George Udny Yule' @ yule.wessa.net

\begin{tabular}{lllllllll}
\hline
Summary of computational transaction \tabularnewline
Raw Input & view raw input (R code)  \tabularnewline
Raw Output & view raw output of R engine  \tabularnewline
Computing time & 2 seconds \tabularnewline
R Server & 'George Udny Yule' @ yule.wessa.net \tabularnewline
\hline
\end{tabular}
%Source: https://freestatistics.org/blog/index.php?pk=132821&T=0

[TABLE]
[ROW][C]Summary of computational transaction[/C][/ROW]
[ROW][C]Raw Input[/C][C]view raw input (R code) [/C][/ROW]
[ROW][C]Raw Output[/C][C]view raw output of R engine [/C][/ROW]
[ROW][C]Computing time[/C][C]2 seconds[/C][/ROW]
[ROW][C]R Server[/C][C]'George Udny Yule' @ yule.wessa.net[/C][/ROW]
[/TABLE]
Source: https://freestatistics.org/blog/index.php?pk=132821&T=0

Globally Unique Identifier (entire table): ba.freestatistics.org/blog/index.php?pk=132821&T=0

As an alternative you can also use a QR Code:  

The GUIDs for individual cells are displayed in the table below:

Summary of computational transaction
Raw Inputview raw input (R code)
Raw Outputview raw output of R engine
Computing time2 seconds
R Server'George Udny Yule' @ yule.wessa.net


Central Tendency - Ungrouped Data
MeasureValueS.E.Value/S.E.
Arithmetic Mean104.7680555555560.930669459662784112.572787758091
Geometric Mean104.474422481361
Harmonic Mean104.180746956973
Quadratic Mean105.061133658245
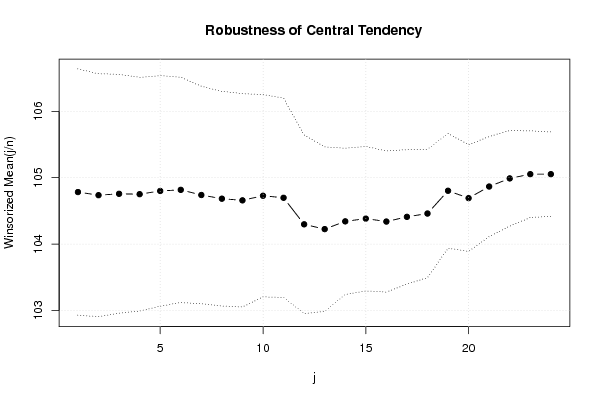
Winsorized Mean ( 1 / 24 )104.7833333333330.927235276623987113.006198076117
Winsorized Mean ( 2 / 24 )104.7361111111110.914902924538153114.477840546834
Winsorized Mean ( 3 / 24 )104.7569444444440.899736586362452116.430682082149
Winsorized Mean ( 4 / 24 )104.7513888888890.880236384027978119.003702629906
Winsorized Mean ( 5 / 24 )104.80.868166362254874120.714190915903
Winsorized Mean ( 6 / 24 )104.8166666666670.848915353256911123.47128163548
Winsorized Mean ( 7 / 24 )104.7388888888890.818868726965068127.906812703762
Winsorized Mean ( 8 / 24 )104.6833333333330.80834845830678129.502731473763
Winsorized Mean ( 9 / 24 )104.6583333333330.803705108487218130.21981847338
Winsorized Mean ( 10 / 24 )104.7277777777780.761611272325909137.508177180658
Winsorized Mean ( 11 / 24 )104.6972222222220.750690793560225139.467838316873
Winsorized Mean ( 12 / 24 )104.2972222222220.671927517883305155.220941911678
Winsorized Mean ( 13 / 24 )104.2250.619732103008403168.177506851839
Winsorized Mean ( 14 / 24 )104.3416666666670.551203513222698189.29789844157
Winsorized Mean ( 15 / 24 )104.3833333333330.544387352887951191.744596525956
Winsorized Mean ( 16 / 24 )104.3388888888890.5315424581373196.294552375979
Winsorized Mean ( 17 / 24 )104.4097222222220.506113484935056206.297056549718
Winsorized Mean ( 18 / 24 )104.4597222222220.483578777416881216.013868061398
Winsorized Mean ( 19 / 24 )104.8027777777780.432062836956751242.563740302127
Winsorized Mean ( 20 / 24 )104.6916666666670.401253659444406260.911431466139
Winsorized Mean ( 21 / 24 )104.8666666666670.376672067766337278.403087567723
Winsorized Mean ( 22 / 24 )104.9888888888890.360189023772882291.482754774587
Winsorized Mean ( 23 / 24 )105.0527777777780.326316835185916321.934900226416
Winsorized Mean ( 24 / 24 )105.0527777777780.317567117486761330.80496056761
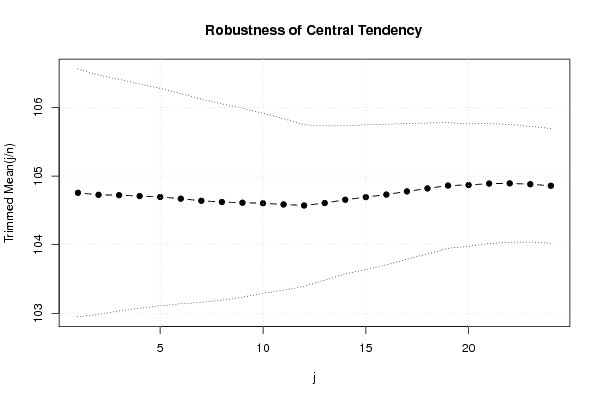
Trimmed Mean ( 1 / 24 )104.7557142857140.901812381992997116.161317339872
Trimmed Mean ( 2 / 24 )104.7264705882350.871572347346799120.158092333974
Trimmed Mean ( 3 / 24 )104.7212121212120.843440382616366124.15959003097
Trimmed Mean ( 4 / 24 )104.70781250.816752621471189128.200154792761
Trimmed Mean ( 5 / 24 )104.6951612903230.79192255942995132.203786902706
Trimmed Mean ( 6 / 24 )104.670.765688272780409136.700539528856
Trimmed Mean ( 7 / 24 )104.6396551724140.739315667841624141.535827960878
Trimmed Mean ( 8 / 24 )104.6214285714290.71517736554854146.28738773239
Trimmed Mean ( 9 / 24 )104.6111111111110.68799563376531152.051998554974
Trimmed Mean ( 10 / 24 )104.6038461538460.655151080053897159.663700997395
Trimmed Mean ( 11 / 24 )104.5860.624493329321737167.47336615043
Trimmed Mean ( 12 / 24 )104.5708333333330.588135941712293177.800447000207
Trimmed Mean ( 13 / 24 )104.606521739130.561462911254284186.310653192468
Trimmed Mean ( 14 / 24 )104.6545454545450.539560295351516193.962651359223
Trimmed Mean ( 15 / 24 )104.6928571428570.527219525504954198.575454963633
Trimmed Mean ( 16 / 24 )104.730.512062195741584204.525936245551
Trimmed Mean ( 17 / 24 )104.7763157894740.494326764765075211.95760225378
Trimmed Mean ( 18 / 24 )104.8194444444440.476525444355457219.966101886169
Trimmed Mean ( 19 / 24 )104.8617647058820.457674013658905229.118895931097
Trimmed Mean ( 20 / 24 )104.868750.445801143195252235.236610764072
Trimmed Mean ( 21 / 24 )104.890.436452522730367240.323963174339
Trimmed Mean ( 22 / 24 )104.8928571428570.428913003211033244.555087762746
Trimmed Mean ( 23 / 24 )104.8807692307690.421025094474801249.108118749075
Trimmed Mean ( 24 / 24 )104.8583333333330.418023154248569250.843361827229
Median104.4
Midrange105.2
Midmean - Weighted Average at Xnp104.654054054054
Midmean - Weighted Average at X(n+1)p104.819444444444
Midmean - Empirical Distribution Function104.654054054054
Midmean - Empirical Distribution Function - Averaging104.819444444444
Midmean - Empirical Distribution Function - Interpolation104.819444444444
Midmean - Closest Observation104.654054054054
Midmean - True Basic - Statistics Graphics Toolkit104.819444444444
Midmean - MS Excel (old versions)104.776315789474
Number of observations72

\begin{tabular}{lllllllll}
\hline
Central Tendency - Ungrouped Data \tabularnewline
Measure & Value & S.E. & Value/S.E. \tabularnewline
Arithmetic Mean & 104.768055555556 & 0.930669459662784 & 112.572787758091 \tabularnewline
Geometric Mean & 104.474422481361 &  &  \tabularnewline
Harmonic Mean & 104.180746956973 &  &  \tabularnewline
Quadratic Mean & 105.061133658245 &  &  \tabularnewline
Winsorized Mean ( 1 / 24 ) & 104.783333333333 & 0.927235276623987 & 113.006198076117 \tabularnewline
Winsorized Mean ( 2 / 24 ) & 104.736111111111 & 0.914902924538153 & 114.477840546834 \tabularnewline
Winsorized Mean ( 3 / 24 ) & 104.756944444444 & 0.899736586362452 & 116.430682082149 \tabularnewline
Winsorized Mean ( 4 / 24 ) & 104.751388888889 & 0.880236384027978 & 119.003702629906 \tabularnewline
Winsorized Mean ( 5 / 24 ) & 104.8 & 0.868166362254874 & 120.714190915903 \tabularnewline
Winsorized Mean ( 6 / 24 ) & 104.816666666667 & 0.848915353256911 & 123.47128163548 \tabularnewline
Winsorized Mean ( 7 / 24 ) & 104.738888888889 & 0.818868726965068 & 127.906812703762 \tabularnewline
Winsorized Mean ( 8 / 24 ) & 104.683333333333 & 0.80834845830678 & 129.502731473763 \tabularnewline
Winsorized Mean ( 9 / 24 ) & 104.658333333333 & 0.803705108487218 & 130.21981847338 \tabularnewline
Winsorized Mean ( 10 / 24 ) & 104.727777777778 & 0.761611272325909 & 137.508177180658 \tabularnewline
Winsorized Mean ( 11 / 24 ) & 104.697222222222 & 0.750690793560225 & 139.467838316873 \tabularnewline
Winsorized Mean ( 12 / 24 ) & 104.297222222222 & 0.671927517883305 & 155.220941911678 \tabularnewline
Winsorized Mean ( 13 / 24 ) & 104.225 & 0.619732103008403 & 168.177506851839 \tabularnewline
Winsorized Mean ( 14 / 24 ) & 104.341666666667 & 0.551203513222698 & 189.29789844157 \tabularnewline
Winsorized Mean ( 15 / 24 ) & 104.383333333333 & 0.544387352887951 & 191.744596525956 \tabularnewline
Winsorized Mean ( 16 / 24 ) & 104.338888888889 & 0.5315424581373 & 196.294552375979 \tabularnewline
Winsorized Mean ( 17 / 24 ) & 104.409722222222 & 0.506113484935056 & 206.297056549718 \tabularnewline
Winsorized Mean ( 18 / 24 ) & 104.459722222222 & 0.483578777416881 & 216.013868061398 \tabularnewline
Winsorized Mean ( 19 / 24 ) & 104.802777777778 & 0.432062836956751 & 242.563740302127 \tabularnewline
Winsorized Mean ( 20 / 24 ) & 104.691666666667 & 0.401253659444406 & 260.911431466139 \tabularnewline
Winsorized Mean ( 21 / 24 ) & 104.866666666667 & 0.376672067766337 & 278.403087567723 \tabularnewline
Winsorized Mean ( 22 / 24 ) & 104.988888888889 & 0.360189023772882 & 291.482754774587 \tabularnewline
Winsorized Mean ( 23 / 24 ) & 105.052777777778 & 0.326316835185916 & 321.934900226416 \tabularnewline
Winsorized Mean ( 24 / 24 ) & 105.052777777778 & 0.317567117486761 & 330.80496056761 \tabularnewline
Trimmed Mean ( 1 / 24 ) & 104.755714285714 & 0.901812381992997 & 116.161317339872 \tabularnewline
Trimmed Mean ( 2 / 24 ) & 104.726470588235 & 0.871572347346799 & 120.158092333974 \tabularnewline
Trimmed Mean ( 3 / 24 ) & 104.721212121212 & 0.843440382616366 & 124.15959003097 \tabularnewline
Trimmed Mean ( 4 / 24 ) & 104.7078125 & 0.816752621471189 & 128.200154792761 \tabularnewline
Trimmed Mean ( 5 / 24 ) & 104.695161290323 & 0.79192255942995 & 132.203786902706 \tabularnewline
Trimmed Mean ( 6 / 24 ) & 104.67 & 0.765688272780409 & 136.700539528856 \tabularnewline
Trimmed Mean ( 7 / 24 ) & 104.639655172414 & 0.739315667841624 & 141.535827960878 \tabularnewline
Trimmed Mean ( 8 / 24 ) & 104.621428571429 & 0.71517736554854 & 146.28738773239 \tabularnewline
Trimmed Mean ( 9 / 24 ) & 104.611111111111 & 0.68799563376531 & 152.051998554974 \tabularnewline
Trimmed Mean ( 10 / 24 ) & 104.603846153846 & 0.655151080053897 & 159.663700997395 \tabularnewline
Trimmed Mean ( 11 / 24 ) & 104.586 & 0.624493329321737 & 167.47336615043 \tabularnewline
Trimmed Mean ( 12 / 24 ) & 104.570833333333 & 0.588135941712293 & 177.800447000207 \tabularnewline
Trimmed Mean ( 13 / 24 ) & 104.60652173913 & 0.561462911254284 & 186.310653192468 \tabularnewline
Trimmed Mean ( 14 / 24 ) & 104.654545454545 & 0.539560295351516 & 193.962651359223 \tabularnewline
Trimmed Mean ( 15 / 24 ) & 104.692857142857 & 0.527219525504954 & 198.575454963633 \tabularnewline
Trimmed Mean ( 16 / 24 ) & 104.73 & 0.512062195741584 & 204.525936245551 \tabularnewline
Trimmed Mean ( 17 / 24 ) & 104.776315789474 & 0.494326764765075 & 211.95760225378 \tabularnewline
Trimmed Mean ( 18 / 24 ) & 104.819444444444 & 0.476525444355457 & 219.966101886169 \tabularnewline
Trimmed Mean ( 19 / 24 ) & 104.861764705882 & 0.457674013658905 & 229.118895931097 \tabularnewline
Trimmed Mean ( 20 / 24 ) & 104.86875 & 0.445801143195252 & 235.236610764072 \tabularnewline
Trimmed Mean ( 21 / 24 ) & 104.89 & 0.436452522730367 & 240.323963174339 \tabularnewline
Trimmed Mean ( 22 / 24 ) & 104.892857142857 & 0.428913003211033 & 244.555087762746 \tabularnewline
Trimmed Mean ( 23 / 24 ) & 104.880769230769 & 0.421025094474801 & 249.108118749075 \tabularnewline
Trimmed Mean ( 24 / 24 ) & 104.858333333333 & 0.418023154248569 & 250.843361827229 \tabularnewline
Median & 104.4 &  &  \tabularnewline
Midrange & 105.2 &  &  \tabularnewline
Midmean - Weighted Average at Xnp & 104.654054054054 &  &  \tabularnewline
Midmean - Weighted Average at X(n+1)p & 104.819444444444 &  &  \tabularnewline
Midmean - Empirical Distribution Function & 104.654054054054 &  &  \tabularnewline
Midmean - Empirical Distribution Function - Averaging & 104.819444444444 &  &  \tabularnewline
Midmean - Empirical Distribution Function - Interpolation & 104.819444444444 &  &  \tabularnewline
Midmean - Closest Observation & 104.654054054054 &  &  \tabularnewline
Midmean - True Basic - Statistics Graphics Toolkit & 104.819444444444 &  &  \tabularnewline
Midmean - MS Excel (old versions) & 104.776315789474 &  &  \tabularnewline
Number of observations & 72 &  &  \tabularnewline
\hline
\end{tabular}
%Source: https://freestatistics.org/blog/index.php?pk=132821&T=1

[TABLE]
[ROW][C]Central Tendency - Ungrouped Data[/C][/ROW]
[ROW][C]Measure[/C][C]Value[/C][C]S.E.[/C][C]Value/S.E.[/C][/ROW]
[ROW][C]Arithmetic Mean[/C][C]104.768055555556[/C][C]0.930669459662784[/C][C]112.572787758091[/C][/ROW]
[ROW][C]Geometric Mean[/C][C]104.474422481361[/C][C][/C][C][/C][/ROW]
[ROW][C]Harmonic Mean[/C][C]104.180746956973[/C][C][/C][C][/C][/ROW]
[ROW][C]Quadratic Mean[/C][C]105.061133658245[/C][C][/C][C][/C][/ROW]
[ROW][C]Winsorized Mean ( 1 / 24 )[/C][C]104.783333333333[/C][C]0.927235276623987[/C][C]113.006198076117[/C][/ROW]
[ROW][C]Winsorized Mean ( 2 / 24 )[/C][C]104.736111111111[/C][C]0.914902924538153[/C][C]114.477840546834[/C][/ROW]
[ROW][C]Winsorized Mean ( 3 / 24 )[/C][C]104.756944444444[/C][C]0.899736586362452[/C][C]116.430682082149[/C][/ROW]
[ROW][C]Winsorized Mean ( 4 / 24 )[/C][C]104.751388888889[/C][C]0.880236384027978[/C][C]119.003702629906[/C][/ROW]
[ROW][C]Winsorized Mean ( 5 / 24 )[/C][C]104.8[/C][C]0.868166362254874[/C][C]120.714190915903[/C][/ROW]
[ROW][C]Winsorized Mean ( 6 / 24 )[/C][C]104.816666666667[/C][C]0.848915353256911[/C][C]123.47128163548[/C][/ROW]
[ROW][C]Winsorized Mean ( 7 / 24 )[/C][C]104.738888888889[/C][C]0.818868726965068[/C][C]127.906812703762[/C][/ROW]
[ROW][C]Winsorized Mean ( 8 / 24 )[/C][C]104.683333333333[/C][C]0.80834845830678[/C][C]129.502731473763[/C][/ROW]
[ROW][C]Winsorized Mean ( 9 / 24 )[/C][C]104.658333333333[/C][C]0.803705108487218[/C][C]130.21981847338[/C][/ROW]
[ROW][C]Winsorized Mean ( 10 / 24 )[/C][C]104.727777777778[/C][C]0.761611272325909[/C][C]137.508177180658[/C][/ROW]
[ROW][C]Winsorized Mean ( 11 / 24 )[/C][C]104.697222222222[/C][C]0.750690793560225[/C][C]139.467838316873[/C][/ROW]
[ROW][C]Winsorized Mean ( 12 / 24 )[/C][C]104.297222222222[/C][C]0.671927517883305[/C][C]155.220941911678[/C][/ROW]
[ROW][C]Winsorized Mean ( 13 / 24 )[/C][C]104.225[/C][C]0.619732103008403[/C][C]168.177506851839[/C][/ROW]
[ROW][C]Winsorized Mean ( 14 / 24 )[/C][C]104.341666666667[/C][C]0.551203513222698[/C][C]189.29789844157[/C][/ROW]
[ROW][C]Winsorized Mean ( 15 / 24 )[/C][C]104.383333333333[/C][C]0.544387352887951[/C][C]191.744596525956[/C][/ROW]
[ROW][C]Winsorized Mean ( 16 / 24 )[/C][C]104.338888888889[/C][C]0.5315424581373[/C][C]196.294552375979[/C][/ROW]
[ROW][C]Winsorized Mean ( 17 / 24 )[/C][C]104.409722222222[/C][C]0.506113484935056[/C][C]206.297056549718[/C][/ROW]
[ROW][C]Winsorized Mean ( 18 / 24 )[/C][C]104.459722222222[/C][C]0.483578777416881[/C][C]216.013868061398[/C][/ROW]
[ROW][C]Winsorized Mean ( 19 / 24 )[/C][C]104.802777777778[/C][C]0.432062836956751[/C][C]242.563740302127[/C][/ROW]
[ROW][C]Winsorized Mean ( 20 / 24 )[/C][C]104.691666666667[/C][C]0.401253659444406[/C][C]260.911431466139[/C][/ROW]
[ROW][C]Winsorized Mean ( 21 / 24 )[/C][C]104.866666666667[/C][C]0.376672067766337[/C][C]278.403087567723[/C][/ROW]
[ROW][C]Winsorized Mean ( 22 / 24 )[/C][C]104.988888888889[/C][C]0.360189023772882[/C][C]291.482754774587[/C][/ROW]
[ROW][C]Winsorized Mean ( 23 / 24 )[/C][C]105.052777777778[/C][C]0.326316835185916[/C][C]321.934900226416[/C][/ROW]
[ROW][C]Winsorized Mean ( 24 / 24 )[/C][C]105.052777777778[/C][C]0.317567117486761[/C][C]330.80496056761[/C][/ROW]
[ROW][C]Trimmed Mean ( 1 / 24 )[/C][C]104.755714285714[/C][C]0.901812381992997[/C][C]116.161317339872[/C][/ROW]
[ROW][C]Trimmed Mean ( 2 / 24 )[/C][C]104.726470588235[/C][C]0.871572347346799[/C][C]120.158092333974[/C][/ROW]
[ROW][C]Trimmed Mean ( 3 / 24 )[/C][C]104.721212121212[/C][C]0.843440382616366[/C][C]124.15959003097[/C][/ROW]
[ROW][C]Trimmed Mean ( 4 / 24 )[/C][C]104.7078125[/C][C]0.816752621471189[/C][C]128.200154792761[/C][/ROW]
[ROW][C]Trimmed Mean ( 5 / 24 )[/C][C]104.695161290323[/C][C]0.79192255942995[/C][C]132.203786902706[/C][/ROW]
[ROW][C]Trimmed Mean ( 6 / 24 )[/C][C]104.67[/C][C]0.765688272780409[/C][C]136.700539528856[/C][/ROW]
[ROW][C]Trimmed Mean ( 7 / 24 )[/C][C]104.639655172414[/C][C]0.739315667841624[/C][C]141.535827960878[/C][/ROW]
[ROW][C]Trimmed Mean ( 8 / 24 )[/C][C]104.621428571429[/C][C]0.71517736554854[/C][C]146.28738773239[/C][/ROW]
[ROW][C]Trimmed Mean ( 9 / 24 )[/C][C]104.611111111111[/C][C]0.68799563376531[/C][C]152.051998554974[/C][/ROW]
[ROW][C]Trimmed Mean ( 10 / 24 )[/C][C]104.603846153846[/C][C]0.655151080053897[/C][C]159.663700997395[/C][/ROW]
[ROW][C]Trimmed Mean ( 11 / 24 )[/C][C]104.586[/C][C]0.624493329321737[/C][C]167.47336615043[/C][/ROW]
[ROW][C]Trimmed Mean ( 12 / 24 )[/C][C]104.570833333333[/C][C]0.588135941712293[/C][C]177.800447000207[/C][/ROW]
[ROW][C]Trimmed Mean ( 13 / 24 )[/C][C]104.60652173913[/C][C]0.561462911254284[/C][C]186.310653192468[/C][/ROW]
[ROW][C]Trimmed Mean ( 14 / 24 )[/C][C]104.654545454545[/C][C]0.539560295351516[/C][C]193.962651359223[/C][/ROW]
[ROW][C]Trimmed Mean ( 15 / 24 )[/C][C]104.692857142857[/C][C]0.527219525504954[/C][C]198.575454963633[/C][/ROW]
[ROW][C]Trimmed Mean ( 16 / 24 )[/C][C]104.73[/C][C]0.512062195741584[/C][C]204.525936245551[/C][/ROW]
[ROW][C]Trimmed Mean ( 17 / 24 )[/C][C]104.776315789474[/C][C]0.494326764765075[/C][C]211.95760225378[/C][/ROW]
[ROW][C]Trimmed Mean ( 18 / 24 )[/C][C]104.819444444444[/C][C]0.476525444355457[/C][C]219.966101886169[/C][/ROW]
[ROW][C]Trimmed Mean ( 19 / 24 )[/C][C]104.861764705882[/C][C]0.457674013658905[/C][C]229.118895931097[/C][/ROW]
[ROW][C]Trimmed Mean ( 20 / 24 )[/C][C]104.86875[/C][C]0.445801143195252[/C][C]235.236610764072[/C][/ROW]
[ROW][C]Trimmed Mean ( 21 / 24 )[/C][C]104.89[/C][C]0.436452522730367[/C][C]240.323963174339[/C][/ROW]
[ROW][C]Trimmed Mean ( 22 / 24 )[/C][C]104.892857142857[/C][C]0.428913003211033[/C][C]244.555087762746[/C][/ROW]
[ROW][C]Trimmed Mean ( 23 / 24 )[/C][C]104.880769230769[/C][C]0.421025094474801[/C][C]249.108118749075[/C][/ROW]
[ROW][C]Trimmed Mean ( 24 / 24 )[/C][C]104.858333333333[/C][C]0.418023154248569[/C][C]250.843361827229[/C][/ROW]
[ROW][C]Median[/C][C]104.4[/C][C][/C][C][/C][/ROW]
[ROW][C]Midrange[/C][C]105.2[/C][C][/C][C][/C][/ROW]
[ROW][C]Midmean - Weighted Average at Xnp[/C][C]104.654054054054[/C][C][/C][C][/C][/ROW]
[ROW][C]Midmean - Weighted Average at X(n+1)p[/C][C]104.819444444444[/C][C][/C][C][/C][/ROW]
[ROW][C]Midmean - Empirical Distribution Function[/C][C]104.654054054054[/C][C][/C][C][/C][/ROW]
[ROW][C]Midmean - Empirical Distribution Function - Averaging[/C][C]104.819444444444[/C][C][/C][C][/C][/ROW]
[ROW][C]Midmean - Empirical Distribution Function - Interpolation[/C][C]104.819444444444[/C][C][/C][C][/C][/ROW]
[ROW][C]Midmean - Closest Observation[/C][C]104.654054054054[/C][C][/C][C][/C][/ROW]
[ROW][C]Midmean - True Basic - Statistics Graphics Toolkit[/C][C]104.819444444444[/C][C][/C][C][/C][/ROW]
[ROW][C]Midmean - MS Excel (old versions)[/C][C]104.776315789474[/C][C][/C][C][/C][/ROW]
[ROW][C]Number of observations[/C][C]72[/C][C][/C][C][/C][/ROW]
[/TABLE]
Source: https://freestatistics.org/blog/index.php?pk=132821&T=1

Globally Unique Identifier (entire table): ba.freestatistics.org/blog/index.php?pk=132821&T=1

As an alternative you can also use a QR Code:  

The GUIDs for individual cells are displayed in the table below:

Central Tendency - Ungrouped Data
MeasureValueS.E.Value/S.E.
Arithmetic Mean104.7680555555560.930669459662784112.572787758091
Geometric Mean104.474422481361
Harmonic Mean104.180746956973
Quadratic Mean105.061133658245
Winsorized Mean ( 1 / 24 )104.7833333333330.927235276623987113.006198076117
Winsorized Mean ( 2 / 24 )104.7361111111110.914902924538153114.477840546834
Winsorized Mean ( 3 / 24 )104.7569444444440.899736586362452116.430682082149
Winsorized Mean ( 4 / 24 )104.7513888888890.880236384027978119.003702629906
Winsorized Mean ( 5 / 24 )104.80.868166362254874120.714190915903
Winsorized Mean ( 6 / 24 )104.8166666666670.848915353256911123.47128163548
Winsorized Mean ( 7 / 24 )104.7388888888890.818868726965068127.906812703762
Winsorized Mean ( 8 / 24 )104.6833333333330.80834845830678129.502731473763
Winsorized Mean ( 9 / 24 )104.6583333333330.803705108487218130.21981847338
Winsorized Mean ( 10 / 24 )104.7277777777780.761611272325909137.508177180658
Winsorized Mean ( 11 / 24 )104.6972222222220.750690793560225139.467838316873
Winsorized Mean ( 12 / 24 )104.2972222222220.671927517883305155.220941911678
Winsorized Mean ( 13 / 24 )104.2250.619732103008403168.177506851839
Winsorized Mean ( 14 / 24 )104.3416666666670.551203513222698189.29789844157
Winsorized Mean ( 15 / 24 )104.3833333333330.544387352887951191.744596525956
Winsorized Mean ( 16 / 24 )104.3388888888890.5315424581373196.294552375979
Winsorized Mean ( 17 / 24 )104.4097222222220.506113484935056206.297056549718
Winsorized Mean ( 18 / 24 )104.4597222222220.483578777416881216.013868061398
Winsorized Mean ( 19 / 24 )104.8027777777780.432062836956751242.563740302127
Winsorized Mean ( 20 / 24 )104.6916666666670.401253659444406260.911431466139
Winsorized Mean ( 21 / 24 )104.8666666666670.376672067766337278.403087567723
Winsorized Mean ( 22 / 24 )104.9888888888890.360189023772882291.482754774587
Winsorized Mean ( 23 / 24 )105.0527777777780.326316835185916321.934900226416
Winsorized Mean ( 24 / 24 )105.0527777777780.317567117486761330.80496056761
Trimmed Mean ( 1 / 24 )104.7557142857140.901812381992997116.161317339872
Trimmed Mean ( 2 / 24 )104.7264705882350.871572347346799120.158092333974
Trimmed Mean ( 3 / 24 )104.7212121212120.843440382616366124.15959003097
Trimmed Mean ( 4 / 24 )104.70781250.816752621471189128.200154792761
Trimmed Mean ( 5 / 24 )104.6951612903230.79192255942995132.203786902706
Trimmed Mean ( 6 / 24 )104.670.765688272780409136.700539528856
Trimmed Mean ( 7 / 24 )104.6396551724140.739315667841624141.535827960878
Trimmed Mean ( 8 / 24 )104.6214285714290.71517736554854146.28738773239
Trimmed Mean ( 9 / 24 )104.6111111111110.68799563376531152.051998554974
Trimmed Mean ( 10 / 24 )104.6038461538460.655151080053897159.663700997395
Trimmed Mean ( 11 / 24 )104.5860.624493329321737167.47336615043
Trimmed Mean ( 12 / 24 )104.5708333333330.588135941712293177.800447000207
Trimmed Mean ( 13 / 24 )104.606521739130.561462911254284186.310653192468
Trimmed Mean ( 14 / 24 )104.6545454545450.539560295351516193.962651359223
Trimmed Mean ( 15 / 24 )104.6928571428570.527219525504954198.575454963633
Trimmed Mean ( 16 / 24 )104.730.512062195741584204.525936245551
Trimmed Mean ( 17 / 24 )104.7763157894740.494326764765075211.95760225378
Trimmed Mean ( 18 / 24 )104.8194444444440.476525444355457219.966101886169
Trimmed Mean ( 19 / 24 )104.8617647058820.457674013658905229.118895931097
Trimmed Mean ( 20 / 24 )104.868750.445801143195252235.236610764072
Trimmed Mean ( 21 / 24 )104.890.436452522730367240.323963174339
Trimmed Mean ( 22 / 24 )104.8928571428570.428913003211033244.555087762746
Trimmed Mean ( 23 / 24 )104.8807692307690.421025094474801249.108118749075
Trimmed Mean ( 24 / 24 )104.8583333333330.418023154248569250.843361827229
Median104.4
Midrange105.2
Midmean - Weighted Average at Xnp104.654054054054
Midmean - Weighted Average at X(n+1)p104.819444444444
Midmean - Empirical Distribution Function104.654054054054
Midmean - Empirical Distribution Function - Averaging104.819444444444
Midmean - Empirical Distribution Function - Interpolation104.819444444444
Midmean - Closest Observation104.654054054054
Midmean - True Basic - Statistics Graphics Toolkit104.819444444444
Midmean - MS Excel (old versions)104.776315789474
Number of observations72


Parameters (Session):
Parameters (R input):
R code (references can be found in the software module):
geomean <- function(x) {
return(exp(mean(log(x))))
}
harmean <- function(x) {
return(1/mean(1/x))
}
quamean <- function(x) {
return(sqrt(mean(x*x)))
}
winmean <- function(x) {
x <-sort(x[!is.na(x)])
n<-length(x)
denom <- 3
nodenom <- n/denom
if (nodenom>40) denom <- n/40
sqrtn = sqrt(n)
roundnodenom = floor(nodenom)
win <- array(NA,dim=c(roundnodenom,2))
for (j in 1:roundnodenom) {
win[j,1] <- (j*x[j+1]+sum(x[(j+1):(n-j)])+j*x[n-j])/n
win[j,2] <- sd(c(rep(x[j+1],j),x[(j+1):(n-j)],rep(x[n-j],j)))/sqrtn
}
return(win)
}
trimean <- function(x) {
x <-sort(x[!is.na(x)])
n<-length(x)
denom <- 3
nodenom <- n/denom
if (nodenom>40) denom <- n/40
sqrtn = sqrt(n)
roundnodenom = floor(nodenom)
tri <- array(NA,dim=c(roundnodenom,2))
for (j in 1:roundnodenom) {
tri[j,1] <- mean(x,trim=j/n)
tri[j,2] <- sd(x[(j+1):(n-j)]) / sqrt(n-j*2)
}
return(tri)
}
midrange <- function(x) {
return((max(x)+min(x))/2)
}
q1 <- function(data,n,p,i,f) {
np <- n*p;
i <<- floor(np)
f <<- np - i
qvalue <- (1-f)*data[i] + f*data[i+1]
}
q2 <- function(data,n,p,i,f) {
np <- (n+1)*p
i <<- floor(np)
f <<- np - i
qvalue <- (1-f)*data[i] + f*data[i+1]
}
q3 <- function(data,n,p,i,f) {
np <- n*p
i <<- floor(np)
f <<- np - i
if (f==0) {
qvalue <- data[i]
} else {
qvalue <- data[i+1]
}
}
q4 <- function(data,n,p,i,f) {
np <- n*p
i <<- floor(np)
f <<- np - i
if (f==0) {
qvalue <- (data[i]+data[i+1])/2
} else {
qvalue <- data[i+1]
}
}
q5 <- function(data,n,p,i,f) {
np <- (n-1)*p
i <<- floor(np)
f <<- np - i
if (f==0) {
qvalue <- data[i+1]
} else {
qvalue <- data[i+1] + f*(data[i+2]-data[i+1])
}
}
q6 <- function(data,n,p,i,f) {
np <- n*p+0.5
i <<- floor(np)
f <<- np - i
qvalue <- data[i]
}
q7 <- function(data,n,p,i,f) {
np <- (n+1)*p
i <<- floor(np)
f <<- np - i
if (f==0) {
qvalue <- data[i]
} else {
qvalue <- f*data[i] + (1-f)*data[i+1]
}
}
q8 <- function(data,n,p,i,f) {
np <- (n+1)*p
i <<- floor(np)
f <<- np - i
if (f==0) {
qvalue <- data[i]
} else {
if (f == 0.5) {
qvalue <- (data[i]+data[i+1])/2
} else {
if (f < 0.5) {
qvalue <- data[i]
} else {
qvalue <- data[i+1]
}
}
}
}
midmean <- function(x,def) {
x <-sort(x[!is.na(x)])
n<-length(x)
if (def==1) {
qvalue1 <- q1(x,n,0.25,i,f)
qvalue3 <- q1(x,n,0.75,i,f)
}
if (def==2) {
qvalue1 <- q2(x,n,0.25,i,f)
qvalue3 <- q2(x,n,0.75,i,f)
}
if (def==3) {
qvalue1 <- q3(x,n,0.25,i,f)
qvalue3 <- q3(x,n,0.75,i,f)
}
if (def==4) {
qvalue1 <- q4(x,n,0.25,i,f)
qvalue3 <- q4(x,n,0.75,i,f)
}
if (def==5) {
qvalue1 <- q5(x,n,0.25,i,f)
qvalue3 <- q5(x,n,0.75,i,f)
}
if (def==6) {
qvalue1 <- q6(x,n,0.25,i,f)
qvalue3 <- q6(x,n,0.75,i,f)
}
if (def==7) {
qvalue1 <- q7(x,n,0.25,i,f)
qvalue3 <- q7(x,n,0.75,i,f)
}
if (def==8) {
qvalue1 <- q8(x,n,0.25,i,f)
qvalue3 <- q8(x,n,0.75,i,f)
}
midm <- 0
myn <- 0
roundno4 <- round(n/4)
round3no4 <- round(3*n/4)
for (i in 1:n) {
if ((x[i]>=qvalue1) & (x[i]<=qvalue3)){
midm = midm + x[i]
myn = myn + 1
}
}
midm = midm / myn
return(midm)
}
(arm <- mean(x))
sqrtn <- sqrt(length(x))
(armse <- sd(x) / sqrtn)
(armose <- arm / armse)
(geo <- geomean(x))
(har <- harmean(x))
(qua <- quamean(x))
(win <- winmean(x))
(tri <- trimean(x))
(midr <- midrange(x))
midm <- array(NA,dim=8)
for (j in 1:8) midm[j] <- midmean(x,j)
midm
bitmap(file='test1.png')
lb <- win[,1] - 2*win[,2]
ub <- win[,1] + 2*win[,2]
if ((ylimmin == '') | (ylimmax == '')) plot(win[,1],type='b',main=main, xlab='j', pch=19, ylab='Winsorized Mean(j/n)', ylim=c(min(lb),max(ub))) else plot(win[,1],type='l',main=main, xlab='j', pch=19, ylab='Winsorized Mean(j/n)', ylim=c(ylimmin,ylimmax))
lines(ub,lty=3)
lines(lb,lty=3)
grid()
dev.off()
bitmap(file='test2.png')
lb <- tri[,1] - 2*tri[,2]
ub <- tri[,1] + 2*tri[,2]
if ((ylimmin == '') | (ylimmax == '')) plot(tri[,1],type='b',main=main, xlab='j', pch=19, ylab='Trimmed Mean(j/n)', ylim=c(min(lb),max(ub))) else plot(tri[,1],type='l',main=main, xlab='j', pch=19, ylab='Trimmed Mean(j/n)', ylim=c(ylimmin,ylimmax))
lines(ub,lty=3)
lines(lb,lty=3)
grid()
dev.off()
load(file='createtable')
a<-table.start()
a<-table.row.start(a)
a<-table.element(a,'Central Tendency - Ungrouped Data',4,TRUE)
a<-table.row.end(a)
a<-table.row.start(a)
a<-table.element(a,'Measure',header=TRUE)
a<-table.element(a,'Value',header=TRUE)
a<-table.element(a,'S.E.',header=TRUE)
a<-table.element(a,'Value/S.E.',header=TRUE)
a<-table.row.end(a)
a<-table.row.start(a)
a<-table.element(a,hyperlink('arithmetic_mean.htm', 'Arithmetic Mean', 'click to view the definition of the Arithmetic Mean'),header=TRUE)
a<-table.element(a,arm)
a<-table.element(a,hyperlink('arithmetic_mean_standard_error.htm', armse, 'click to view the definition of the Standard Error of the Arithmetic Mean'))
a<-table.element(a,armose)
a<-table.row.end(a)
a<-table.row.start(a)
a<-table.element(a,hyperlink('geometric_mean.htm', 'Geometric Mean', 'click to view the definition of the Geometric Mean'),header=TRUE)
a<-table.element(a,geo)
a<-table.element(a,'')
a<-table.row.end(a)
a<-table.row.start(a)
a<-table.element(a,hyperlink('harmonic_mean.htm', 'Harmonic Mean', 'click to view the definition of the Harmonic Mean'),header=TRUE)
a<-table.element(a,har)
a<-table.element(a,'')
a<-table.row.end(a)
a<-table.row.start(a)
a<-table.element(a,hyperlink('quadratic_mean.htm', 'Quadratic Mean', 'click to view the definition of the Quadratic Mean'),header=TRUE)
a<-table.element(a,qua)
a<-table.element(a,'')
a<-table.row.end(a)
for (j in 1:length(win[,1])) {
a<-table.row.start(a)
mylabel <- paste('Winsorized Mean (',j)
mylabel <- paste(mylabel,'/')
mylabel <- paste(mylabel,length(win[,1]))
mylabel <- paste(mylabel,')')
a<-table.element(a,hyperlink('winsorized_mean.htm', mylabel, 'click to view the definition of the Winsorized Mean'),header=TRUE)
a<-table.element(a,win[j,1])
a<-table.element(a,win[j,2])
a<-table.element(a,win[j,1]/win[j,2])
a<-table.row.end(a)
}
for (j in 1:length(tri[,1])) {
a<-table.row.start(a)
mylabel <- paste('Trimmed Mean (',j)
mylabel <- paste(mylabel,'/')
mylabel <- paste(mylabel,length(tri[,1]))
mylabel <- paste(mylabel,')')
a<-table.element(a,hyperlink('arithmetic_mean.htm', mylabel, 'click to view the definition of the Trimmed Mean'),header=TRUE)
a<-table.element(a,tri[j,1])
a<-table.element(a,tri[j,2])
a<-table.element(a,tri[j,1]/tri[j,2])
a<-table.row.end(a)
}
a<-table.row.start(a)
a<-table.element(a,hyperlink('median_1.htm', 'Median', 'click to view the definition of the Median'),header=TRUE)
a<-table.element(a,median(x))
a<-table.element(a,'')
a<-table.row.end(a)
a<-table.row.start(a)
a<-table.element(a,hyperlink('midrange.htm', 'Midrange', 'click to view the definition of the Midrange'),header=TRUE)
a<-table.element(a,midr)
a<-table.element(a,'')
a<-table.row.end(a)
a<-table.row.start(a)
mymid <- hyperlink('midmean.htm', 'Midmean', 'click to view the definition of the Midmean')
mylabel <- paste(mymid,hyperlink('method_1.htm','Weighted Average at Xnp',''),sep=' - ')
a<-table.element(a,mylabel,header=TRUE)
a<-table.element(a,midm[1])
a<-table.element(a,'')
a<-table.row.end(a)
a<-table.row.start(a)
mymid <- hyperlink('midmean.htm', 'Midmean', 'click to view the definition of the Midmean')
mylabel <- paste(mymid,hyperlink('method_2.htm','Weighted Average at X(n+1)p',''),sep=' - ')
a<-table.element(a,mylabel,header=TRUE)
a<-table.element(a,midm[2])
a<-table.element(a,'')
a<-table.row.end(a)
a<-table.row.start(a)
mymid <- hyperlink('midmean.htm', 'Midmean', 'click to view the definition of the Midmean')
mylabel <- paste(mymid,hyperlink('method_3.htm','Empirical Distribution Function',''),sep=' - ')
a<-table.element(a,mylabel,header=TRUE)
a<-table.element(a,midm[3])
a<-table.element(a,'')
a<-table.row.end(a)
a<-table.row.start(a)
mymid <- hyperlink('midmean.htm', 'Midmean', 'click to view the definition of the Midmean')
mylabel <- paste(mymid,hyperlink('method_4.htm','Empirical Distribution Function - Averaging',''),sep=' - ')
a<-table.element(a,mylabel,header=TRUE)
a<-table.element(a,midm[4])
a<-table.element(a,'')
a<-table.row.end(a)
a<-table.row.start(a)
mymid <- hyperlink('midmean.htm', 'Midmean', 'click to view the definition of the Midmean')
mylabel <- paste(mymid,hyperlink('method_5.htm','Empirical Distribution Function - Interpolation',''),sep=' - ')
a<-table.element(a,mylabel,header=TRUE)
a<-table.element(a,midm[5])
a<-table.element(a,'')
a<-table.row.end(a)
a<-table.row.start(a)
mymid <- hyperlink('midmean.htm', 'Midmean', 'click to view the definition of the Midmean')
mylabel <- paste(mymid,hyperlink('method_6.htm','Closest Observation',''),sep=' - ')
a<-table.element(a,mylabel,header=TRUE)
a<-table.element(a,midm[6])
a<-table.element(a,'')
a<-table.row.end(a)
a<-table.row.start(a)
mymid <- hyperlink('midmean.htm', 'Midmean', 'click to view the definition of the Midmean')
mylabel <- paste(mymid,hyperlink('method_7.htm','True Basic - Statistics Graphics Toolkit',''),sep=' - ')
a<-table.element(a,mylabel,header=TRUE)
a<-table.element(a,midm[7])
a<-table.element(a,'')
a<-table.row.end(a)
a<-table.row.start(a)
mymid <- hyperlink('midmean.htm', 'Midmean', 'click to view the definition of the Midmean')
mylabel <- paste(mymid,hyperlink('method_8.htm','MS Excel (old versions)',''),sep=' - ')
a<-table.element(a,mylabel,header=TRUE)
a<-table.element(a,midm[8])
a<-table.element(a,'')
a<-table.row.end(a)
a<-table.row.start(a)
a<-table.element(a,'Number of observations',header=TRUE)
a<-table.element(a,length(x))
a<-table.element(a,'')
a<-table.row.end(a)
a<-table.end(a)
table.save(a,file='mytable.tab')