Free Statistics

of Irreproducible Research!

Author's title

Author*Unverified author*
R Software Modulerwasp_centraltendency.wasp
Title produced by softwareCentral Tendency
Date of computationWed, 19 Oct 2011 13:09:08 -0400
Cite this page as followsStatistical Computations at FreeStatistics.org, Office for Research Development and Education, URL https://freestatistics.org/blog/index.php?v=date/2011/Oct/19/t13190442245dohqb2z0szypgf.htm/, Retrieved Wed, 15 May 2024 12:50:22 +0000
Statistical Computations at FreeStatistics.org, Office for Research Development and Education, URL https://freestatistics.org/blog/index.php?pk=132811, Retrieved Wed, 15 May 2024 12:50:22 +0000
QR Codes:

Original text written by user:
IsPrivate?No (this computation is public)
User-defined keywordsKDG2011W52a
Estimated Impact76
Family? (F = Feedback message, R = changed R code, M = changed R Module, P = changed Parameters, D = changed Data)
-       [Central Tendency] [] [2011-10-19 17:09:08] [00ac914fda573751cd779017970949c5] [Current]
Feedback Forum

Post a new message
Dataseries X:
1594
2467
2222
3607
4685
4962
5770
5480
5000
3228
1993
2288
1580
2111
2192
3601
4665
4876
5813
5589
5331
3075
2002
2306
1507
1992
2487
3490
4647
5594
5611
5788
6204
3013
1931
2549
1504
2090
2702
2939
4500
6208
6415
5657
5964
3163
1997
2422
1376
2202
2683
3303
5202
5231
4880
7998
4977
3531
2025
2205
1442
2238
2179
3218
5139
4990
4914
6084
5672
3548
1793
2086


Summary of computational transaction
Raw Inputview raw input (R code)
Raw Outputview raw output of R engine
Computing time1 seconds
R Server'Herman Ole Andreas Wold' @ wold.wessa.net

\begin{tabular}{lllllllll}
\hline
Summary of computational transaction \tabularnewline
Raw Input & view raw input (R code)  \tabularnewline
Raw Output & view raw output of R engine  \tabularnewline
Computing time & 1 seconds \tabularnewline
R Server & 'Herman Ole Andreas Wold' @ wold.wessa.net \tabularnewline
\hline
\end{tabular}
%Source: https://freestatistics.org/blog/index.php?pk=132811&T=0

[TABLE]
[ROW][C]Summary of computational transaction[/C][/ROW]
[ROW][C]Raw Input[/C][C]view raw input (R code) [/C][/ROW]
[ROW][C]Raw Output[/C][C]view raw output of R engine [/C][/ROW]
[ROW][C]Computing time[/C][C]1 seconds[/C][/ROW]
[ROW][C]R Server[/C][C]'Herman Ole Andreas Wold' @ wold.wessa.net[/C][/ROW]
[/TABLE]
Source: https://freestatistics.org/blog/index.php?pk=132811&T=0

Globally Unique Identifier (entire table): ba.freestatistics.org/blog/index.php?pk=132811&T=0

As an alternative you can also use a QR Code:  

The GUIDs for individual cells are displayed in the table below:

Summary of computational transaction
Raw Inputview raw input (R code)
Raw Outputview raw output of R engine
Computing time1 seconds
R Server'Herman Ole Andreas Wold' @ wold.wessa.net


Central Tendency - Ungrouped Data
MeasureValueS.E.Value/S.E.
Arithmetic Mean3690.65277777778194.47481457856918.9775359126862
Geometric Mean3321.39584209841
Harmonic Mean2978.27711072721
Quadratic Mean4038.0899104651
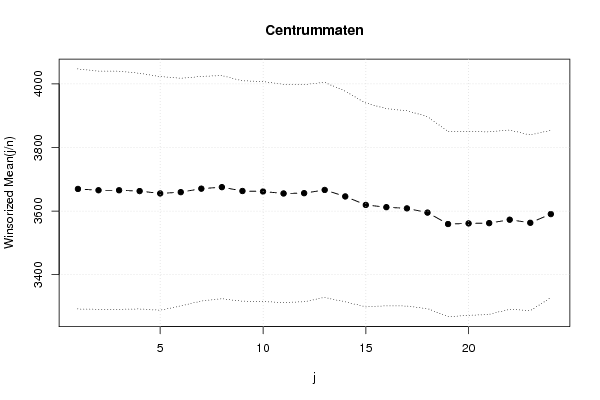
Winsorized Mean ( 1 / 24 )3669.58333333333188.6208519809919.4548126296406
Winsorized Mean ( 2 / 24 )3665.55555555556187.19807081980719.5811609569627
Winsorized Mean ( 3 / 24 )3665.51388888889187.14589200824519.5863978073716
Winsorized Mean ( 4 / 24 )3662.90277777778185.24476909115319.7733128754387
Winsorized Mean ( 5 / 24 )3655.54166666667183.58584183264419.9118931513196
Winsorized Mean ( 6 / 24 )3659.54166666667178.87286199426820.4588981574183
Winsorized Mean ( 7 / 24 )3670.52777777778176.54422851333920.7909814367024
Winsorized Mean ( 8 / 24 )3675.30555555556175.27824363357620.9684070273941
Winsorized Mean ( 9 / 24 )3663.18055555556173.22978390181221.1463668258795
Winsorized Mean ( 10 / 24 )3661.65277777778172.81484519498421.1882999614206
Winsorized Mean ( 11 / 24 )3655.38888888889171.57562488020921.3048263204113
Winsorized Mean ( 12 / 24 )3656.38888888889170.60329588815521.4321116708435
Winsorized Mean ( 13 / 24 )3666.5168.99159052518421.6963458868303
Winsorized Mean ( 14 / 24 )3646.08333333333165.53687582358622.025807332615
Winsorized Mean ( 15 / 24 )3619.41666666667160.19833871459822.5933470703142
Winsorized Mean ( 16 / 24 )3612.30555555556154.90343127222723.3197258826842
Winsorized Mean ( 17 / 24 )3608.52777777778153.49947746571223.5084043109126
Winsorized Mean ( 18 / 24 )3595.27777777778150.88812355613123.8274404442462
Winsorized Mean ( 19 / 24 )3559.38888888889145.58433948871224.4489819536179
Winsorized Mean ( 20 / 24 )3561.33333333333144.58002424809824.6322640479166
Winsorized Mean ( 21 / 24 )3562.20833333333143.44498454310424.8332721055363
Winsorized Mean ( 22 / 24 )3572.90277777778140.83335161224725.3697205731136
Winsorized Mean ( 23 / 24 )3563.31944444444137.97267713115325.8262687840524
Winsorized Mean ( 24 / 24 )3590.65277777778131.50612153010727.3040732705034
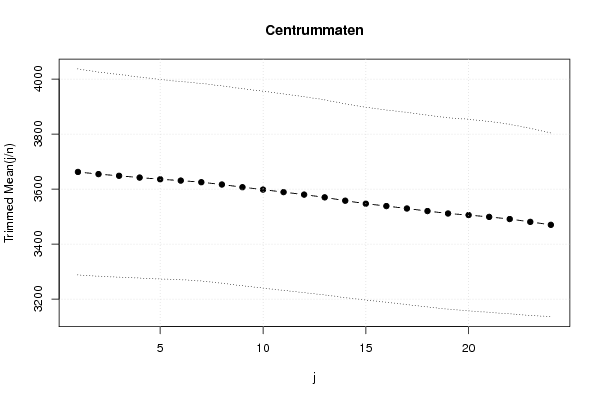
Trimmed Mean ( 1 / 24 )3662.18571428571187.26017075138419.5566718731012
Trimmed Mean ( 2 / 24 )3654.35294117647185.55092701614919.694608913802
Trimmed Mean ( 3 / 24 )3648.24242424242184.29706188993219.7954453903408
Trimmed Mean ( 4 / 24 )3641.765625182.70461423454319.9325323022492
Trimmed Mean ( 5 / 24 )3635.62903225806181.34462698277420.0481761866781
Trimmed Mean ( 6 / 24 )3630.85180.06860247151720.1637040003924
Trimmed Mean ( 7 / 24 )3624.91379310345179.60257982968320.1829717398322
Trimmed Mean ( 8 / 24 )3616.53571428571179.36550502366220.1629388761714
Trimmed Mean ( 9 / 24 )3606.74074074074179.10407357745220.1376812302432
Trimmed Mean ( 10 / 24 )3598.05769230769178.95986433227520.1053890252575
Trimmed Mean ( 11 / 24 )3588.9178.57463825686820.0974787631242
Trimmed Mean ( 12 / 24 )3579.83333333333178.04683356043820.1061330985039
Trimmed Mean ( 13 / 24 )3569.84782608696177.2546435615920.139657581645
Trimmed Mean ( 14 / 24 )3557.68181818182176.21890448176120.188990668422
Trimmed Mean ( 15 / 24 )3546.85714285714175.26842056321220.236715384663
Trimmed Mean ( 16 / 24 )3538.15174.77140215956520.2444447791847
Trimmed Mean ( 17 / 24 )3529.36842105263174.74693517440820.1970261597442
Trimmed Mean ( 18 / 24 )3520.05555555556174.44909633874320.1781243321569
Trimmed Mean ( 19 / 24 )3511.20588235294174.03674176903720.1750839889467
Trimmed Mean ( 20 / 24 )3505.5174.07675818998820.1376682128587
Trimmed Mean ( 21 / 24 )3498.8173.56252575031220.1587294542683
Trimmed Mean ( 22 / 24 )3491.03571428571172.25341613665720.2668590997122
Trimmed Mean ( 23 / 24 )3480.73076923077170.14774175306820.4571082364542
Trimmed Mean ( 24 / 24 )3469.95833333333166.9234993482420.7877162106111
Median3265.5
Midrange4687
Midmean - Weighted Average at Xnp3484.16216216216
Midmean - Weighted Average at X(n+1)p3520.05555555556
Midmean - Empirical Distribution Function3484.16216216216
Midmean - Empirical Distribution Function - Averaging3520.05555555556
Midmean - Empirical Distribution Function - Interpolation3520.05555555556
Midmean - Closest Observation3484.16216216216
Midmean - True Basic - Statistics Graphics Toolkit3520.05555555556
Midmean - MS Excel (old versions)3529.36842105263
Number of observations72

\begin{tabular}{lllllllll}
\hline
Central Tendency - Ungrouped Data \tabularnewline
Measure & Value & S.E. & Value/S.E. \tabularnewline
Arithmetic Mean & 3690.65277777778 & 194.474814578569 & 18.9775359126862 \tabularnewline
Geometric Mean & 3321.39584209841 &  &  \tabularnewline
Harmonic Mean & 2978.27711072721 &  &  \tabularnewline
Quadratic Mean & 4038.0899104651 &  &  \tabularnewline
Winsorized Mean ( 1 / 24 ) & 3669.58333333333 & 188.62085198099 & 19.4548126296406 \tabularnewline
Winsorized Mean ( 2 / 24 ) & 3665.55555555556 & 187.198070819807 & 19.5811609569627 \tabularnewline
Winsorized Mean ( 3 / 24 ) & 3665.51388888889 & 187.145892008245 & 19.5863978073716 \tabularnewline
Winsorized Mean ( 4 / 24 ) & 3662.90277777778 & 185.244769091153 & 19.7733128754387 \tabularnewline
Winsorized Mean ( 5 / 24 ) & 3655.54166666667 & 183.585841832644 & 19.9118931513196 \tabularnewline
Winsorized Mean ( 6 / 24 ) & 3659.54166666667 & 178.872861994268 & 20.4588981574183 \tabularnewline
Winsorized Mean ( 7 / 24 ) & 3670.52777777778 & 176.544228513339 & 20.7909814367024 \tabularnewline
Winsorized Mean ( 8 / 24 ) & 3675.30555555556 & 175.278243633576 & 20.9684070273941 \tabularnewline
Winsorized Mean ( 9 / 24 ) & 3663.18055555556 & 173.229783901812 & 21.1463668258795 \tabularnewline
Winsorized Mean ( 10 / 24 ) & 3661.65277777778 & 172.814845194984 & 21.1882999614206 \tabularnewline
Winsorized Mean ( 11 / 24 ) & 3655.38888888889 & 171.575624880209 & 21.3048263204113 \tabularnewline
Winsorized Mean ( 12 / 24 ) & 3656.38888888889 & 170.603295888155 & 21.4321116708435 \tabularnewline
Winsorized Mean ( 13 / 24 ) & 3666.5 & 168.991590525184 & 21.6963458868303 \tabularnewline
Winsorized Mean ( 14 / 24 ) & 3646.08333333333 & 165.536875823586 & 22.025807332615 \tabularnewline
Winsorized Mean ( 15 / 24 ) & 3619.41666666667 & 160.198338714598 & 22.5933470703142 \tabularnewline
Winsorized Mean ( 16 / 24 ) & 3612.30555555556 & 154.903431272227 & 23.3197258826842 \tabularnewline
Winsorized Mean ( 17 / 24 ) & 3608.52777777778 & 153.499477465712 & 23.5084043109126 \tabularnewline
Winsorized Mean ( 18 / 24 ) & 3595.27777777778 & 150.888123556131 & 23.8274404442462 \tabularnewline
Winsorized Mean ( 19 / 24 ) & 3559.38888888889 & 145.584339488712 & 24.4489819536179 \tabularnewline
Winsorized Mean ( 20 / 24 ) & 3561.33333333333 & 144.580024248098 & 24.6322640479166 \tabularnewline
Winsorized Mean ( 21 / 24 ) & 3562.20833333333 & 143.444984543104 & 24.8332721055363 \tabularnewline
Winsorized Mean ( 22 / 24 ) & 3572.90277777778 & 140.833351612247 & 25.3697205731136 \tabularnewline
Winsorized Mean ( 23 / 24 ) & 3563.31944444444 & 137.972677131153 & 25.8262687840524 \tabularnewline
Winsorized Mean ( 24 / 24 ) & 3590.65277777778 & 131.506121530107 & 27.3040732705034 \tabularnewline
Trimmed Mean ( 1 / 24 ) & 3662.18571428571 & 187.260170751384 & 19.5566718731012 \tabularnewline
Trimmed Mean ( 2 / 24 ) & 3654.35294117647 & 185.550927016149 & 19.694608913802 \tabularnewline
Trimmed Mean ( 3 / 24 ) & 3648.24242424242 & 184.297061889932 & 19.7954453903408 \tabularnewline
Trimmed Mean ( 4 / 24 ) & 3641.765625 & 182.704614234543 & 19.9325323022492 \tabularnewline
Trimmed Mean ( 5 / 24 ) & 3635.62903225806 & 181.344626982774 & 20.0481761866781 \tabularnewline
Trimmed Mean ( 6 / 24 ) & 3630.85 & 180.068602471517 & 20.1637040003924 \tabularnewline
Trimmed Mean ( 7 / 24 ) & 3624.91379310345 & 179.602579829683 & 20.1829717398322 \tabularnewline
Trimmed Mean ( 8 / 24 ) & 3616.53571428571 & 179.365505023662 & 20.1629388761714 \tabularnewline
Trimmed Mean ( 9 / 24 ) & 3606.74074074074 & 179.104073577452 & 20.1376812302432 \tabularnewline
Trimmed Mean ( 10 / 24 ) & 3598.05769230769 & 178.959864332275 & 20.1053890252575 \tabularnewline
Trimmed Mean ( 11 / 24 ) & 3588.9 & 178.574638256868 & 20.0974787631242 \tabularnewline
Trimmed Mean ( 12 / 24 ) & 3579.83333333333 & 178.046833560438 & 20.1061330985039 \tabularnewline
Trimmed Mean ( 13 / 24 ) & 3569.84782608696 & 177.25464356159 & 20.139657581645 \tabularnewline
Trimmed Mean ( 14 / 24 ) & 3557.68181818182 & 176.218904481761 & 20.188990668422 \tabularnewline
Trimmed Mean ( 15 / 24 ) & 3546.85714285714 & 175.268420563212 & 20.236715384663 \tabularnewline
Trimmed Mean ( 16 / 24 ) & 3538.15 & 174.771402159565 & 20.2444447791847 \tabularnewline
Trimmed Mean ( 17 / 24 ) & 3529.36842105263 & 174.746935174408 & 20.1970261597442 \tabularnewline
Trimmed Mean ( 18 / 24 ) & 3520.05555555556 & 174.449096338743 & 20.1781243321569 \tabularnewline
Trimmed Mean ( 19 / 24 ) & 3511.20588235294 & 174.036741769037 & 20.1750839889467 \tabularnewline
Trimmed Mean ( 20 / 24 ) & 3505.5 & 174.076758189988 & 20.1376682128587 \tabularnewline
Trimmed Mean ( 21 / 24 ) & 3498.8 & 173.562525750312 & 20.1587294542683 \tabularnewline
Trimmed Mean ( 22 / 24 ) & 3491.03571428571 & 172.253416136657 & 20.2668590997122 \tabularnewline
Trimmed Mean ( 23 / 24 ) & 3480.73076923077 & 170.147741753068 & 20.4571082364542 \tabularnewline
Trimmed Mean ( 24 / 24 ) & 3469.95833333333 & 166.92349934824 & 20.7877162106111 \tabularnewline
Median & 3265.5 &  &  \tabularnewline
Midrange & 4687 &  &  \tabularnewline
Midmean - Weighted Average at Xnp & 3484.16216216216 &  &  \tabularnewline
Midmean - Weighted Average at X(n+1)p & 3520.05555555556 &  &  \tabularnewline
Midmean - Empirical Distribution Function & 3484.16216216216 &  &  \tabularnewline
Midmean - Empirical Distribution Function - Averaging & 3520.05555555556 &  &  \tabularnewline
Midmean - Empirical Distribution Function - Interpolation & 3520.05555555556 &  &  \tabularnewline
Midmean - Closest Observation & 3484.16216216216 &  &  \tabularnewline
Midmean - True Basic - Statistics Graphics Toolkit & 3520.05555555556 &  &  \tabularnewline
Midmean - MS Excel (old versions) & 3529.36842105263 &  &  \tabularnewline
Number of observations & 72 &  &  \tabularnewline
\hline
\end{tabular}
%Source: https://freestatistics.org/blog/index.php?pk=132811&T=1

[TABLE]
[ROW][C]Central Tendency - Ungrouped Data[/C][/ROW]
[ROW][C]Measure[/C][C]Value[/C][C]S.E.[/C][C]Value/S.E.[/C][/ROW]
[ROW][C]Arithmetic Mean[/C][C]3690.65277777778[/C][C]194.474814578569[/C][C]18.9775359126862[/C][/ROW]
[ROW][C]Geometric Mean[/C][C]3321.39584209841[/C][C][/C][C][/C][/ROW]
[ROW][C]Harmonic Mean[/C][C]2978.27711072721[/C][C][/C][C][/C][/ROW]
[ROW][C]Quadratic Mean[/C][C]4038.0899104651[/C][C][/C][C][/C][/ROW]
[ROW][C]Winsorized Mean ( 1 / 24 )[/C][C]3669.58333333333[/C][C]188.62085198099[/C][C]19.4548126296406[/C][/ROW]
[ROW][C]Winsorized Mean ( 2 / 24 )[/C][C]3665.55555555556[/C][C]187.198070819807[/C][C]19.5811609569627[/C][/ROW]
[ROW][C]Winsorized Mean ( 3 / 24 )[/C][C]3665.51388888889[/C][C]187.145892008245[/C][C]19.5863978073716[/C][/ROW]
[ROW][C]Winsorized Mean ( 4 / 24 )[/C][C]3662.90277777778[/C][C]185.244769091153[/C][C]19.7733128754387[/C][/ROW]
[ROW][C]Winsorized Mean ( 5 / 24 )[/C][C]3655.54166666667[/C][C]183.585841832644[/C][C]19.9118931513196[/C][/ROW]
[ROW][C]Winsorized Mean ( 6 / 24 )[/C][C]3659.54166666667[/C][C]178.872861994268[/C][C]20.4588981574183[/C][/ROW]
[ROW][C]Winsorized Mean ( 7 / 24 )[/C][C]3670.52777777778[/C][C]176.544228513339[/C][C]20.7909814367024[/C][/ROW]
[ROW][C]Winsorized Mean ( 8 / 24 )[/C][C]3675.30555555556[/C][C]175.278243633576[/C][C]20.9684070273941[/C][/ROW]
[ROW][C]Winsorized Mean ( 9 / 24 )[/C][C]3663.18055555556[/C][C]173.229783901812[/C][C]21.1463668258795[/C][/ROW]
[ROW][C]Winsorized Mean ( 10 / 24 )[/C][C]3661.65277777778[/C][C]172.814845194984[/C][C]21.1882999614206[/C][/ROW]
[ROW][C]Winsorized Mean ( 11 / 24 )[/C][C]3655.38888888889[/C][C]171.575624880209[/C][C]21.3048263204113[/C][/ROW]
[ROW][C]Winsorized Mean ( 12 / 24 )[/C][C]3656.38888888889[/C][C]170.603295888155[/C][C]21.4321116708435[/C][/ROW]
[ROW][C]Winsorized Mean ( 13 / 24 )[/C][C]3666.5[/C][C]168.991590525184[/C][C]21.6963458868303[/C][/ROW]
[ROW][C]Winsorized Mean ( 14 / 24 )[/C][C]3646.08333333333[/C][C]165.536875823586[/C][C]22.025807332615[/C][/ROW]
[ROW][C]Winsorized Mean ( 15 / 24 )[/C][C]3619.41666666667[/C][C]160.198338714598[/C][C]22.5933470703142[/C][/ROW]
[ROW][C]Winsorized Mean ( 16 / 24 )[/C][C]3612.30555555556[/C][C]154.903431272227[/C][C]23.3197258826842[/C][/ROW]
[ROW][C]Winsorized Mean ( 17 / 24 )[/C][C]3608.52777777778[/C][C]153.499477465712[/C][C]23.5084043109126[/C][/ROW]
[ROW][C]Winsorized Mean ( 18 / 24 )[/C][C]3595.27777777778[/C][C]150.888123556131[/C][C]23.8274404442462[/C][/ROW]
[ROW][C]Winsorized Mean ( 19 / 24 )[/C][C]3559.38888888889[/C][C]145.584339488712[/C][C]24.4489819536179[/C][/ROW]
[ROW][C]Winsorized Mean ( 20 / 24 )[/C][C]3561.33333333333[/C][C]144.580024248098[/C][C]24.6322640479166[/C][/ROW]
[ROW][C]Winsorized Mean ( 21 / 24 )[/C][C]3562.20833333333[/C][C]143.444984543104[/C][C]24.8332721055363[/C][/ROW]
[ROW][C]Winsorized Mean ( 22 / 24 )[/C][C]3572.90277777778[/C][C]140.833351612247[/C][C]25.3697205731136[/C][/ROW]
[ROW][C]Winsorized Mean ( 23 / 24 )[/C][C]3563.31944444444[/C][C]137.972677131153[/C][C]25.8262687840524[/C][/ROW]
[ROW][C]Winsorized Mean ( 24 / 24 )[/C][C]3590.65277777778[/C][C]131.506121530107[/C][C]27.3040732705034[/C][/ROW]
[ROW][C]Trimmed Mean ( 1 / 24 )[/C][C]3662.18571428571[/C][C]187.260170751384[/C][C]19.5566718731012[/C][/ROW]
[ROW][C]Trimmed Mean ( 2 / 24 )[/C][C]3654.35294117647[/C][C]185.550927016149[/C][C]19.694608913802[/C][/ROW]
[ROW][C]Trimmed Mean ( 3 / 24 )[/C][C]3648.24242424242[/C][C]184.297061889932[/C][C]19.7954453903408[/C][/ROW]
[ROW][C]Trimmed Mean ( 4 / 24 )[/C][C]3641.765625[/C][C]182.704614234543[/C][C]19.9325323022492[/C][/ROW]
[ROW][C]Trimmed Mean ( 5 / 24 )[/C][C]3635.62903225806[/C][C]181.344626982774[/C][C]20.0481761866781[/C][/ROW]
[ROW][C]Trimmed Mean ( 6 / 24 )[/C][C]3630.85[/C][C]180.068602471517[/C][C]20.1637040003924[/C][/ROW]
[ROW][C]Trimmed Mean ( 7 / 24 )[/C][C]3624.91379310345[/C][C]179.602579829683[/C][C]20.1829717398322[/C][/ROW]
[ROW][C]Trimmed Mean ( 8 / 24 )[/C][C]3616.53571428571[/C][C]179.365505023662[/C][C]20.1629388761714[/C][/ROW]
[ROW][C]Trimmed Mean ( 9 / 24 )[/C][C]3606.74074074074[/C][C]179.104073577452[/C][C]20.1376812302432[/C][/ROW]
[ROW][C]Trimmed Mean ( 10 / 24 )[/C][C]3598.05769230769[/C][C]178.959864332275[/C][C]20.1053890252575[/C][/ROW]
[ROW][C]Trimmed Mean ( 11 / 24 )[/C][C]3588.9[/C][C]178.574638256868[/C][C]20.0974787631242[/C][/ROW]
[ROW][C]Trimmed Mean ( 12 / 24 )[/C][C]3579.83333333333[/C][C]178.046833560438[/C][C]20.1061330985039[/C][/ROW]
[ROW][C]Trimmed Mean ( 13 / 24 )[/C][C]3569.84782608696[/C][C]177.25464356159[/C][C]20.139657581645[/C][/ROW]
[ROW][C]Trimmed Mean ( 14 / 24 )[/C][C]3557.68181818182[/C][C]176.218904481761[/C][C]20.188990668422[/C][/ROW]
[ROW][C]Trimmed Mean ( 15 / 24 )[/C][C]3546.85714285714[/C][C]175.268420563212[/C][C]20.236715384663[/C][/ROW]
[ROW][C]Trimmed Mean ( 16 / 24 )[/C][C]3538.15[/C][C]174.771402159565[/C][C]20.2444447791847[/C][/ROW]
[ROW][C]Trimmed Mean ( 17 / 24 )[/C][C]3529.36842105263[/C][C]174.746935174408[/C][C]20.1970261597442[/C][/ROW]
[ROW][C]Trimmed Mean ( 18 / 24 )[/C][C]3520.05555555556[/C][C]174.449096338743[/C][C]20.1781243321569[/C][/ROW]
[ROW][C]Trimmed Mean ( 19 / 24 )[/C][C]3511.20588235294[/C][C]174.036741769037[/C][C]20.1750839889467[/C][/ROW]
[ROW][C]Trimmed Mean ( 20 / 24 )[/C][C]3505.5[/C][C]174.076758189988[/C][C]20.1376682128587[/C][/ROW]
[ROW][C]Trimmed Mean ( 21 / 24 )[/C][C]3498.8[/C][C]173.562525750312[/C][C]20.1587294542683[/C][/ROW]
[ROW][C]Trimmed Mean ( 22 / 24 )[/C][C]3491.03571428571[/C][C]172.253416136657[/C][C]20.2668590997122[/C][/ROW]
[ROW][C]Trimmed Mean ( 23 / 24 )[/C][C]3480.73076923077[/C][C]170.147741753068[/C][C]20.4571082364542[/C][/ROW]
[ROW][C]Trimmed Mean ( 24 / 24 )[/C][C]3469.95833333333[/C][C]166.92349934824[/C][C]20.7877162106111[/C][/ROW]
[ROW][C]Median[/C][C]3265.5[/C][C][/C][C][/C][/ROW]
[ROW][C]Midrange[/C][C]4687[/C][C][/C][C][/C][/ROW]
[ROW][C]Midmean - Weighted Average at Xnp[/C][C]3484.16216216216[/C][C][/C][C][/C][/ROW]
[ROW][C]Midmean - Weighted Average at X(n+1)p[/C][C]3520.05555555556[/C][C][/C][C][/C][/ROW]
[ROW][C]Midmean - Empirical Distribution Function[/C][C]3484.16216216216[/C][C][/C][C][/C][/ROW]
[ROW][C]Midmean - Empirical Distribution Function - Averaging[/C][C]3520.05555555556[/C][C][/C][C][/C][/ROW]
[ROW][C]Midmean - Empirical Distribution Function - Interpolation[/C][C]3520.05555555556[/C][C][/C][C][/C][/ROW]
[ROW][C]Midmean - Closest Observation[/C][C]3484.16216216216[/C][C][/C][C][/C][/ROW]
[ROW][C]Midmean - True Basic - Statistics Graphics Toolkit[/C][C]3520.05555555556[/C][C][/C][C][/C][/ROW]
[ROW][C]Midmean - MS Excel (old versions)[/C][C]3529.36842105263[/C][C][/C][C][/C][/ROW]
[ROW][C]Number of observations[/C][C]72[/C][C][/C][C][/C][/ROW]
[/TABLE]
Source: https://freestatistics.org/blog/index.php?pk=132811&T=1

Globally Unique Identifier (entire table): ba.freestatistics.org/blog/index.php?pk=132811&T=1

As an alternative you can also use a QR Code:  

The GUIDs for individual cells are displayed in the table below:

Central Tendency - Ungrouped Data
MeasureValueS.E.Value/S.E.
Arithmetic Mean3690.65277777778194.47481457856918.9775359126862
Geometric Mean3321.39584209841
Harmonic Mean2978.27711072721
Quadratic Mean4038.0899104651
Winsorized Mean ( 1 / 24 )3669.58333333333188.6208519809919.4548126296406
Winsorized Mean ( 2 / 24 )3665.55555555556187.19807081980719.5811609569627
Winsorized Mean ( 3 / 24 )3665.51388888889187.14589200824519.5863978073716
Winsorized Mean ( 4 / 24 )3662.90277777778185.24476909115319.7733128754387
Winsorized Mean ( 5 / 24 )3655.54166666667183.58584183264419.9118931513196
Winsorized Mean ( 6 / 24 )3659.54166666667178.87286199426820.4588981574183
Winsorized Mean ( 7 / 24 )3670.52777777778176.54422851333920.7909814367024
Winsorized Mean ( 8 / 24 )3675.30555555556175.27824363357620.9684070273941
Winsorized Mean ( 9 / 24 )3663.18055555556173.22978390181221.1463668258795
Winsorized Mean ( 10 / 24 )3661.65277777778172.81484519498421.1882999614206
Winsorized Mean ( 11 / 24 )3655.38888888889171.57562488020921.3048263204113
Winsorized Mean ( 12 / 24 )3656.38888888889170.60329588815521.4321116708435
Winsorized Mean ( 13 / 24 )3666.5168.99159052518421.6963458868303
Winsorized Mean ( 14 / 24 )3646.08333333333165.53687582358622.025807332615
Winsorized Mean ( 15 / 24 )3619.41666666667160.19833871459822.5933470703142
Winsorized Mean ( 16 / 24 )3612.30555555556154.90343127222723.3197258826842
Winsorized Mean ( 17 / 24 )3608.52777777778153.49947746571223.5084043109126
Winsorized Mean ( 18 / 24 )3595.27777777778150.88812355613123.8274404442462
Winsorized Mean ( 19 / 24 )3559.38888888889145.58433948871224.4489819536179
Winsorized Mean ( 20 / 24 )3561.33333333333144.58002424809824.6322640479166
Winsorized Mean ( 21 / 24 )3562.20833333333143.44498454310424.8332721055363
Winsorized Mean ( 22 / 24 )3572.90277777778140.83335161224725.3697205731136
Winsorized Mean ( 23 / 24 )3563.31944444444137.97267713115325.8262687840524
Winsorized Mean ( 24 / 24 )3590.65277777778131.50612153010727.3040732705034
Trimmed Mean ( 1 / 24 )3662.18571428571187.26017075138419.5566718731012
Trimmed Mean ( 2 / 24 )3654.35294117647185.55092701614919.694608913802
Trimmed Mean ( 3 / 24 )3648.24242424242184.29706188993219.7954453903408
Trimmed Mean ( 4 / 24 )3641.765625182.70461423454319.9325323022492
Trimmed Mean ( 5 / 24 )3635.62903225806181.34462698277420.0481761866781
Trimmed Mean ( 6 / 24 )3630.85180.06860247151720.1637040003924
Trimmed Mean ( 7 / 24 )3624.91379310345179.60257982968320.1829717398322
Trimmed Mean ( 8 / 24 )3616.53571428571179.36550502366220.1629388761714
Trimmed Mean ( 9 / 24 )3606.74074074074179.10407357745220.1376812302432
Trimmed Mean ( 10 / 24 )3598.05769230769178.95986433227520.1053890252575
Trimmed Mean ( 11 / 24 )3588.9178.57463825686820.0974787631242
Trimmed Mean ( 12 / 24 )3579.83333333333178.04683356043820.1061330985039
Trimmed Mean ( 13 / 24 )3569.84782608696177.2546435615920.139657581645
Trimmed Mean ( 14 / 24 )3557.68181818182176.21890448176120.188990668422
Trimmed Mean ( 15 / 24 )3546.85714285714175.26842056321220.236715384663
Trimmed Mean ( 16 / 24 )3538.15174.77140215956520.2444447791847
Trimmed Mean ( 17 / 24 )3529.36842105263174.74693517440820.1970261597442
Trimmed Mean ( 18 / 24 )3520.05555555556174.44909633874320.1781243321569
Trimmed Mean ( 19 / 24 )3511.20588235294174.03674176903720.1750839889467
Trimmed Mean ( 20 / 24 )3505.5174.07675818998820.1376682128587
Trimmed Mean ( 21 / 24 )3498.8173.56252575031220.1587294542683
Trimmed Mean ( 22 / 24 )3491.03571428571172.25341613665720.2668590997122
Trimmed Mean ( 23 / 24 )3480.73076923077170.14774175306820.4571082364542
Trimmed Mean ( 24 / 24 )3469.95833333333166.9234993482420.7877162106111
Median3265.5
Midrange4687
Midmean - Weighted Average at Xnp3484.16216216216
Midmean - Weighted Average at X(n+1)p3520.05555555556
Midmean - Empirical Distribution Function3484.16216216216
Midmean - Empirical Distribution Function - Averaging3520.05555555556
Midmean - Empirical Distribution Function - Interpolation3520.05555555556
Midmean - Closest Observation3484.16216216216
Midmean - True Basic - Statistics Graphics Toolkit3520.05555555556
Midmean - MS Excel (old versions)3529.36842105263
Number of observations72


Parameters (Session):
Parameters (R input):
R code (references can be found in the software module):
geomean <- function(x) {
return(exp(mean(log(x))))
}
harmean <- function(x) {
return(1/mean(1/x))
}
quamean <- function(x) {
return(sqrt(mean(x*x)))
}
winmean <- function(x) {
x <-sort(x[!is.na(x)])
n<-length(x)
denom <- 3
nodenom <- n/denom
if (nodenom>40) denom <- n/40
sqrtn = sqrt(n)
roundnodenom = floor(nodenom)
win <- array(NA,dim=c(roundnodenom,2))
for (j in 1:roundnodenom) {
win[j,1] <- (j*x[j+1]+sum(x[(j+1):(n-j)])+j*x[n-j])/n
win[j,2] <- sd(c(rep(x[j+1],j),x[(j+1):(n-j)],rep(x[n-j],j)))/sqrtn
}
return(win)
}
trimean <- function(x) {
x <-sort(x[!is.na(x)])
n<-length(x)
denom <- 3
nodenom <- n/denom
if (nodenom>40) denom <- n/40
sqrtn = sqrt(n)
roundnodenom = floor(nodenom)
tri <- array(NA,dim=c(roundnodenom,2))
for (j in 1:roundnodenom) {
tri[j,1] <- mean(x,trim=j/n)
tri[j,2] <- sd(x[(j+1):(n-j)]) / sqrt(n-j*2)
}
return(tri)
}
midrange <- function(x) {
return((max(x)+min(x))/2)
}
q1 <- function(data,n,p,i,f) {
np <- n*p;
i <<- floor(np)
f <<- np - i
qvalue <- (1-f)*data[i] + f*data[i+1]
}
q2 <- function(data,n,p,i,f) {
np <- (n+1)*p
i <<- floor(np)
f <<- np - i
qvalue <- (1-f)*data[i] + f*data[i+1]
}
q3 <- function(data,n,p,i,f) {
np <- n*p
i <<- floor(np)
f <<- np - i
if (f==0) {
qvalue <- data[i]
} else {
qvalue <- data[i+1]
}
}
q4 <- function(data,n,p,i,f) {
np <- n*p
i <<- floor(np)
f <<- np - i
if (f==0) {
qvalue <- (data[i]+data[i+1])/2
} else {
qvalue <- data[i+1]
}
}
q5 <- function(data,n,p,i,f) {
np <- (n-1)*p
i <<- floor(np)
f <<- np - i
if (f==0) {
qvalue <- data[i+1]
} else {
qvalue <- data[i+1] + f*(data[i+2]-data[i+1])
}
}
q6 <- function(data,n,p,i,f) {
np <- n*p+0.5
i <<- floor(np)
f <<- np - i
qvalue <- data[i]
}
q7 <- function(data,n,p,i,f) {
np <- (n+1)*p
i <<- floor(np)
f <<- np - i
if (f==0) {
qvalue <- data[i]
} else {
qvalue <- f*data[i] + (1-f)*data[i+1]
}
}
q8 <- function(data,n,p,i,f) {
np <- (n+1)*p
i <<- floor(np)
f <<- np - i
if (f==0) {
qvalue <- data[i]
} else {
if (f == 0.5) {
qvalue <- (data[i]+data[i+1])/2
} else {
if (f < 0.5) {
qvalue <- data[i]
} else {
qvalue <- data[i+1]
}
}
}
}
midmean <- function(x,def) {
x <-sort(x[!is.na(x)])
n<-length(x)
if (def==1) {
qvalue1 <- q1(x,n,0.25,i,f)
qvalue3 <- q1(x,n,0.75,i,f)
}
if (def==2) {
qvalue1 <- q2(x,n,0.25,i,f)
qvalue3 <- q2(x,n,0.75,i,f)
}
if (def==3) {
qvalue1 <- q3(x,n,0.25,i,f)
qvalue3 <- q3(x,n,0.75,i,f)
}
if (def==4) {
qvalue1 <- q4(x,n,0.25,i,f)
qvalue3 <- q4(x,n,0.75,i,f)
}
if (def==5) {
qvalue1 <- q5(x,n,0.25,i,f)
qvalue3 <- q5(x,n,0.75,i,f)
}
if (def==6) {
qvalue1 <- q6(x,n,0.25,i,f)
qvalue3 <- q6(x,n,0.75,i,f)
}
if (def==7) {
qvalue1 <- q7(x,n,0.25,i,f)
qvalue3 <- q7(x,n,0.75,i,f)
}
if (def==8) {
qvalue1 <- q8(x,n,0.25,i,f)
qvalue3 <- q8(x,n,0.75,i,f)
}
midm <- 0
myn <- 0
roundno4 <- round(n/4)
round3no4 <- round(3*n/4)
for (i in 1:n) {
if ((x[i]>=qvalue1) & (x[i]<=qvalue3)){
midm = midm + x[i]
myn = myn + 1
}
}
midm = midm / myn
return(midm)
}
(arm <- mean(x))
sqrtn <- sqrt(length(x))
(armse <- sd(x) / sqrtn)
(armose <- arm / armse)
(geo <- geomean(x))
(har <- harmean(x))
(qua <- quamean(x))
(win <- winmean(x))
(tri <- trimean(x))
(midr <- midrange(x))
midm <- array(NA,dim=8)
for (j in 1:8) midm[j] <- midmean(x,j)
midm
bitmap(file='test1.png')
lb <- win[,1] - 2*win[,2]
ub <- win[,1] + 2*win[,2]
if ((ylimmin == '') | (ylimmax == '')) plot(win[,1],type='b',main=main, xlab='j', pch=19, ylab='Winsorized Mean(j/n)', ylim=c(min(lb),max(ub))) else plot(win[,1],type='l',main=main, xlab='j', pch=19, ylab='Winsorized Mean(j/n)', ylim=c(ylimmin,ylimmax))
lines(ub,lty=3)
lines(lb,lty=3)
grid()
dev.off()
bitmap(file='test2.png')
lb <- tri[,1] - 2*tri[,2]
ub <- tri[,1] + 2*tri[,2]
if ((ylimmin == '') | (ylimmax == '')) plot(tri[,1],type='b',main=main, xlab='j', pch=19, ylab='Trimmed Mean(j/n)', ylim=c(min(lb),max(ub))) else plot(tri[,1],type='l',main=main, xlab='j', pch=19, ylab='Trimmed Mean(j/n)', ylim=c(ylimmin,ylimmax))
lines(ub,lty=3)
lines(lb,lty=3)
grid()
dev.off()
load(file='createtable')
a<-table.start()
a<-table.row.start(a)
a<-table.element(a,'Central Tendency - Ungrouped Data',4,TRUE)
a<-table.row.end(a)
a<-table.row.start(a)
a<-table.element(a,'Measure',header=TRUE)
a<-table.element(a,'Value',header=TRUE)
a<-table.element(a,'S.E.',header=TRUE)
a<-table.element(a,'Value/S.E.',header=TRUE)
a<-table.row.end(a)
a<-table.row.start(a)
a<-table.element(a,hyperlink('arithmetic_mean.htm', 'Arithmetic Mean', 'click to view the definition of the Arithmetic Mean'),header=TRUE)
a<-table.element(a,arm)
a<-table.element(a,hyperlink('arithmetic_mean_standard_error.htm', armse, 'click to view the definition of the Standard Error of the Arithmetic Mean'))
a<-table.element(a,armose)
a<-table.row.end(a)
a<-table.row.start(a)
a<-table.element(a,hyperlink('geometric_mean.htm', 'Geometric Mean', 'click to view the definition of the Geometric Mean'),header=TRUE)
a<-table.element(a,geo)
a<-table.element(a,'')
a<-table.row.end(a)
a<-table.row.start(a)
a<-table.element(a,hyperlink('harmonic_mean.htm', 'Harmonic Mean', 'click to view the definition of the Harmonic Mean'),header=TRUE)
a<-table.element(a,har)
a<-table.element(a,'')
a<-table.row.end(a)
a<-table.row.start(a)
a<-table.element(a,hyperlink('quadratic_mean.htm', 'Quadratic Mean', 'click to view the definition of the Quadratic Mean'),header=TRUE)
a<-table.element(a,qua)
a<-table.element(a,'')
a<-table.row.end(a)
for (j in 1:length(win[,1])) {
a<-table.row.start(a)
mylabel <- paste('Winsorized Mean (',j)
mylabel <- paste(mylabel,'/')
mylabel <- paste(mylabel,length(win[,1]))
mylabel <- paste(mylabel,')')
a<-table.element(a,hyperlink('winsorized_mean.htm', mylabel, 'click to view the definition of the Winsorized Mean'),header=TRUE)
a<-table.element(a,win[j,1])
a<-table.element(a,win[j,2])
a<-table.element(a,win[j,1]/win[j,2])
a<-table.row.end(a)
}
for (j in 1:length(tri[,1])) {
a<-table.row.start(a)
mylabel <- paste('Trimmed Mean (',j)
mylabel <- paste(mylabel,'/')
mylabel <- paste(mylabel,length(tri[,1]))
mylabel <- paste(mylabel,')')
a<-table.element(a,hyperlink('arithmetic_mean.htm', mylabel, 'click to view the definition of the Trimmed Mean'),header=TRUE)
a<-table.element(a,tri[j,1])
a<-table.element(a,tri[j,2])
a<-table.element(a,tri[j,1]/tri[j,2])
a<-table.row.end(a)
}
a<-table.row.start(a)
a<-table.element(a,hyperlink('median_1.htm', 'Median', 'click to view the definition of the Median'),header=TRUE)
a<-table.element(a,median(x))
a<-table.element(a,'')
a<-table.row.end(a)
a<-table.row.start(a)
a<-table.element(a,hyperlink('midrange.htm', 'Midrange', 'click to view the definition of the Midrange'),header=TRUE)
a<-table.element(a,midr)
a<-table.element(a,'')
a<-table.row.end(a)
a<-table.row.start(a)
mymid <- hyperlink('midmean.htm', 'Midmean', 'click to view the definition of the Midmean')
mylabel <- paste(mymid,hyperlink('method_1.htm','Weighted Average at Xnp',''),sep=' - ')
a<-table.element(a,mylabel,header=TRUE)
a<-table.element(a,midm[1])
a<-table.element(a,'')
a<-table.row.end(a)
a<-table.row.start(a)
mymid <- hyperlink('midmean.htm', 'Midmean', 'click to view the definition of the Midmean')
mylabel <- paste(mymid,hyperlink('method_2.htm','Weighted Average at X(n+1)p',''),sep=' - ')
a<-table.element(a,mylabel,header=TRUE)
a<-table.element(a,midm[2])
a<-table.element(a,'')
a<-table.row.end(a)
a<-table.row.start(a)
mymid <- hyperlink('midmean.htm', 'Midmean', 'click to view the definition of the Midmean')
mylabel <- paste(mymid,hyperlink('method_3.htm','Empirical Distribution Function',''),sep=' - ')
a<-table.element(a,mylabel,header=TRUE)
a<-table.element(a,midm[3])
a<-table.element(a,'')
a<-table.row.end(a)
a<-table.row.start(a)
mymid <- hyperlink('midmean.htm', 'Midmean', 'click to view the definition of the Midmean')
mylabel <- paste(mymid,hyperlink('method_4.htm','Empirical Distribution Function - Averaging',''),sep=' - ')
a<-table.element(a,mylabel,header=TRUE)
a<-table.element(a,midm[4])
a<-table.element(a,'')
a<-table.row.end(a)
a<-table.row.start(a)
mymid <- hyperlink('midmean.htm', 'Midmean', 'click to view the definition of the Midmean')
mylabel <- paste(mymid,hyperlink('method_5.htm','Empirical Distribution Function - Interpolation',''),sep=' - ')
a<-table.element(a,mylabel,header=TRUE)
a<-table.element(a,midm[5])
a<-table.element(a,'')
a<-table.row.end(a)
a<-table.row.start(a)
mymid <- hyperlink('midmean.htm', 'Midmean', 'click to view the definition of the Midmean')
mylabel <- paste(mymid,hyperlink('method_6.htm','Closest Observation',''),sep=' - ')
a<-table.element(a,mylabel,header=TRUE)
a<-table.element(a,midm[6])
a<-table.element(a,'')
a<-table.row.end(a)
a<-table.row.start(a)
mymid <- hyperlink('midmean.htm', 'Midmean', 'click to view the definition of the Midmean')
mylabel <- paste(mymid,hyperlink('method_7.htm','True Basic - Statistics Graphics Toolkit',''),sep=' - ')
a<-table.element(a,mylabel,header=TRUE)
a<-table.element(a,midm[7])
a<-table.element(a,'')
a<-table.row.end(a)
a<-table.row.start(a)
mymid <- hyperlink('midmean.htm', 'Midmean', 'click to view the definition of the Midmean')
mylabel <- paste(mymid,hyperlink('method_8.htm','MS Excel (old versions)',''),sep=' - ')
a<-table.element(a,mylabel,header=TRUE)
a<-table.element(a,midm[8])
a<-table.element(a,'')
a<-table.row.end(a)
a<-table.row.start(a)
a<-table.element(a,'Number of observations',header=TRUE)
a<-table.element(a,length(x))
a<-table.element(a,'')
a<-table.row.end(a)
a<-table.end(a)
table.save(a,file='mytable.tab')