Free Statistics
of Irreproducible Research!
Description of Statistical Computation | |||||||||||||||||||||||||||||||||
|---|---|---|---|---|---|---|---|---|---|---|---|---|---|---|---|---|---|---|---|---|---|---|---|---|---|---|---|---|---|---|---|---|---|
| Author's title | |||||||||||||||||||||||||||||||||
| Author | *The author of this computation has been verified* | ||||||||||||||||||||||||||||||||
| R Software Module | rwasp_density.wasp | ||||||||||||||||||||||||||||||||
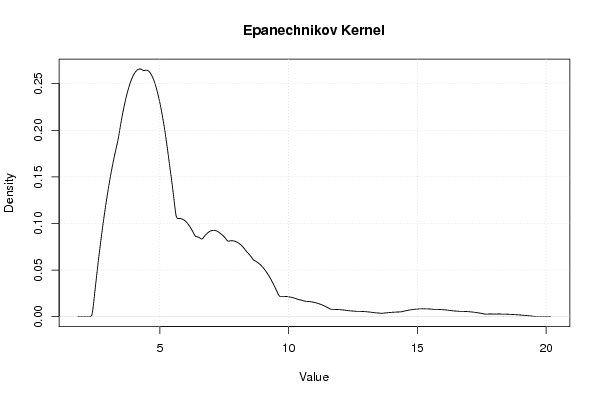
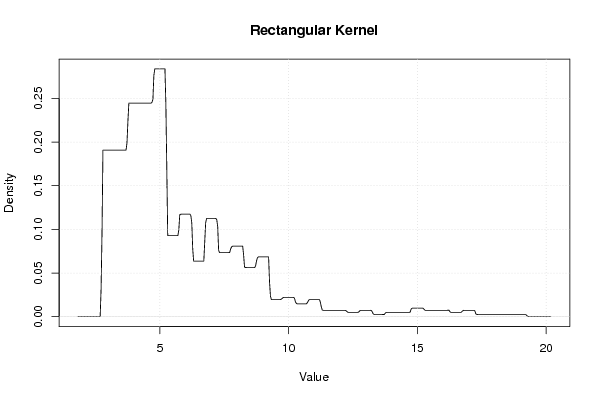
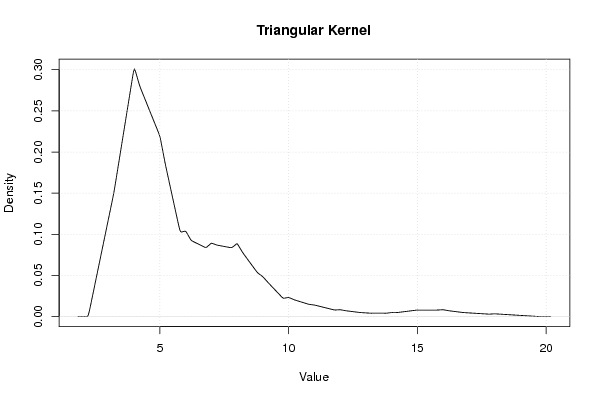
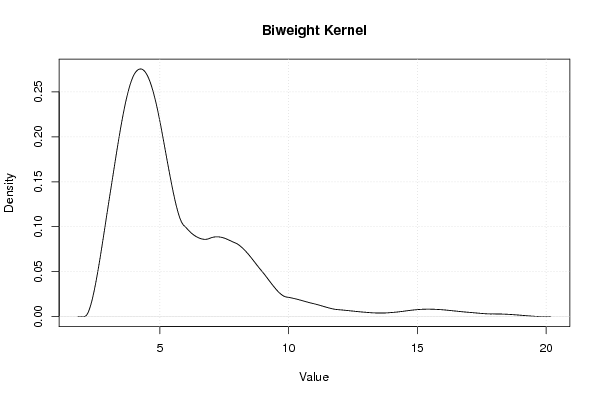
| Title produced by software | Kernel Density Estimation | ||||||||||||||||||||||||||||||||
| Date of computation | Tue, 18 Oct 2011 18:49:22 -0400 | ||||||||||||||||||||||||||||||||
| Cite this page as follows | Statistical Computations at FreeStatistics.org, Office for Research Development and Education, URL https://freestatistics.org/blog/index.php?v=date/2011/Oct/18/t1318978170sij4ncqydtx5ltb.htm/, Retrieved Thu, 16 May 2024 05:04:23 +0000 | ||||||||||||||||||||||||||||||||
| Statistical Computations at FreeStatistics.org, Office for Research Development and Education, URL https://freestatistics.org/blog/index.php?pk=132680, Retrieved Thu, 16 May 2024 05:04:23 +0000 | |||||||||||||||||||||||||||||||||
| QR Codes: | |||||||||||||||||||||||||||||||||
|
| |||||||||||||||||||||||||||||||||
| Original text written by user: | |||||||||||||||||||||||||||||||||
| IsPrivate? | No (this computation is public) | ||||||||||||||||||||||||||||||||
| User-defined keywords | |||||||||||||||||||||||||||||||||
| Estimated Impact | 225 | ||||||||||||||||||||||||||||||||
Tree of Dependent Computations | |||||||||||||||||||||||||||||||||
| Family? (F = Feedback message, R = changed R code, M = changed R Module, P = changed Parameters, D = changed Data) | |||||||||||||||||||||||||||||||||
| - [Percentiles] [Intrinsic Motivat...] [2010-10-12 12:10:58] [b98453cac15ba1066b407e146608df68] - RMPD [Kernel Density Estimation] [] [2011-10-18 22:42:23] [b98453cac15ba1066b407e146608df68] - RMPD [Percentiles] [] [2011-10-18 22:46:45] [b98453cac15ba1066b407e146608df68] - RMPD [Kernel Density Estimation] [] [2011-10-18 22:49:22] [d76b387543b13b5e3afd8ff9e5fdc89f] [Current] - RMPD [Kernel Density Estimation] [] [2014-10-15 12:51:24] [5d70ade31d892c55b68fa1af48da4bec] - RM [Kernel Density Estimation] [] [2014-10-15 13:09:46] [7b576ab45e161dc8fb6fe50455a3800c] - RMP [Kernel Density Estimation] [WS3-task3-AM] [2014-10-15 13:17:51] [81f624c2f0b20a2549c93e7c3dccf981] - RMP [Kernel Density Estimation] [] [2014-10-15 14:15:56] [eee95947b6243a1febfcd5f41483d733] - RMP [Kernel Density Estimation] [] [2014-10-15 14:15:56] [eee95947b6243a1febfcd5f41483d733] - RMP [Kernel Density Estimation] [Q3] [2014-10-15 14:36:47] [bcf5edf18529a33bd1494456d2c6cb9a] - RMP [Kernel Density Estimation] [Vraag 3 demotivatie] [2014-10-15 14:38:18] [36781f05c04c55e165b348994b753b95] - RMP [Kernel Density Estimation] [] [2014-10-15 14:50:50] [ae96d02647dd9ad9c105f1fa6642e295] - RMP [Kernel Density Estimation] [] [2014-10-15 14:52:29] [b007041690f75f30ec26eb43925b7b35] - RMP [Kernel Density Estimation] [WS3 Question 3.9] [2014-10-15 14:55:21] [ce9f16fa58bb2303d66047ab4343b505] - RMP [Kernel Density Estimation] [] [2014-10-15 14:57:57] [fda96889f4ef6d31c0c28fd64d281011] - RM [Kernel Density Estimation] [Task 3] [2014-10-15 15:37:40] [1651e47f7f65f3a10bbbb444d4b26be7] - RMP [Kernel Density Estimation] [] [2014-10-15 16:44:17] [2b9d0c54c8c845c625e475ed5f1f3af1] - RM [Kernel Density Estimation] [] [2014-10-15 16:47:03] [80a885d02035c87be624c190e38c794d] - RMP [Kernel Density Estimation] [] [2014-10-15 17:41:20] [5efa6717cfe6505454df834acc87b53b] - RMP [Kernel Density Estimation] [] [2014-10-15 18:32:57] [2b9d0c54c8c845c625e475ed5f1f3af1] - RMP [Kernel Density Estimation] [] [2014-10-15 18:44:25] [1a6d42b46b3d01bc960fcfb45e99fecd] - RMP [Kernel Density Estimation] [] [2014-10-15 19:36:26] [99723d3e379f668157309b7b2091b15d] - RM [Kernel Density Estimation] [] [2014-10-16 15:04:05] [6656361aa4da5489a6a45e803df0211c] - RM [Kernel Density Estimation] [] [2014-10-16 16:13:31] [044144d0728beecdb08e0d94daaff202] - RMP [Kernel Density Estimation] [q3 amotivation ga...] [2014-10-16 16:16:00] [673773038936aef3a5778d7e6bda5c1e] - RM [Kernel Density Estimation] [ws3 Q3] [2014-10-16 16:48:58] [8523551e1e4e3cbe97fa25692e177b2e] - RMPD [Kernel Density Estimation] [W3T3E3] [2014-10-16 17:53:10] [2a42404c3b0fbfc7622e3301a77a3a9b] - RMP [Kernel Density Estimation] [] [2014-10-16 19:54:09] [dacad244957cb51472792888970d4390] - RMP [Kernel Density Estimation] [Gaussian] [2014-10-16 20:00:23] [3d5212c89039da1a3a24d8e18d23c716] - RMPD [Cronbach Alpha] [Cronbach Alpha I1] [2014-11-30 16:47:26] [f12bfb29749f0c3f544bf278d0782c85] - RMPD [Kernel Density Estimation] [Demotivation Kernel] [2014-12-09 09:58:01] [1a6d42b46b3d01bc960fcfb45e99fecd] - P [Kernel Density Estimation] [] [2014-12-18 19:38:51] [d69b52d23ca73e15a0c741afa583703c] - RMPD [Kernel Density Estimation] [] [2014-12-09 11:17:33] [6795cd14e59cd8fafcdf800c40b889d9] | |||||||||||||||||||||||||||||||||
| Feedback Forum | |||||||||||||||||||||||||||||||||
Post a new message | |||||||||||||||||||||||||||||||||
Dataset | |||||||||||||||||||||||||||||||||
| Dataseries X: | |||||||||||||||||||||||||||||||||
4 4 6 8 8 4 4 8 5 4 4 4 4 4 4 8 4 4 4 8 4 7 4 4 5 4 4 4 4 4 4 4 15 10 4 8 4 4 4 4 7 4 6 5 4 16 5 12 6 9 9 4 5 4 4 5 4 4 4 5 4 6 4 4 18 4 6 4 4 5 4 4 5 10 5 8 8 5 4 4 4 5 4 4 8 4 5 14 8 8 4 4 6 4 7 7 4 6 4 7 4 4 8 4 4 10 8 6 4 4 4 5 4 6 4 5 7 8 5 8 10 8 5 12 4 5 4 6 4 4 7 7 10 4 5 8 11 7 4 8 6 7 5 4 8 4 8 6 4 9 5 6 4 4 4 5 6 16 6 6 4 4 | |||||||||||||||||||||||||||||||||
Tables (Output of Computation) | |||||||||||||||||||||||||||||||||
| |||||||||||||||||||||||||||||||||
Figures (Output of Computation) | |||||||||||||||||||||||||||||||||
Input Parameters & R Code | |||||||||||||||||||||||||||||||||
| Parameters (Session): | |||||||||||||||||||||||||||||||||
| par1 = 0 ; | |||||||||||||||||||||||||||||||||
| Parameters (R input): | |||||||||||||||||||||||||||||||||
| par1 = 0 ; | |||||||||||||||||||||||||||||||||
| R code (references can be found in the software module): | |||||||||||||||||||||||||||||||||
if (par1 == '0') bw <- 'nrd0' | |||||||||||||||||||||||||||||||||