Free Statistics

of Irreproducible Research!

Author's title

Author*Unverified author*
R Software Modulerwasp_centraltendency.wasp
Title produced by softwareCentral Tendency
Date of computationMon, 17 Oct 2011 14:25:32 -0400
Cite this page as followsStatistical Computations at FreeStatistics.org, Office for Research Development and Education, URL https://freestatistics.org/blog/index.php?v=date/2011/Oct/17/t1318876124cdtni0yauq7kej0.htm/, Retrieved Wed, 15 May 2024 10:40:35 +0000
Statistical Computations at FreeStatistics.org, Office for Research Development and Education, URL https://freestatistics.org/blog/index.php?pk=130901, Retrieved Wed, 15 May 2024 10:40:35 +0000
QR Codes:

Original text written by user:
IsPrivate?No (this computation is public)
User-defined keywordsKDG2011W52a
Estimated Impact50
Family? (F = Feedback message, R = changed R code, M = changed R Module, P = changed Parameters, D = changed Data)
-       [Central Tendency] [] [2011-10-17 18:25:32] [c7947c1eb3210bb9ed87c20003884d6d] [Current]
Feedback Forum

Post a new message
Dataseries X:
47460
50104
61465
53726
39477
43895
31481
29896
33842
39120
33702
25094
51442
45594
52518
48564
41745
49585
32747
33379
35645
37034
35681
20972
58552
54955
65540
51570
51145
46641
35704
33253
35193
41668
34865
21210
56126
49231
59723
48103
47472
50497
40059
34149
36860
46356
36577
23872
57276
56389
57657
62300
48929
51168
39636
33213
38127
43291
30600
21956
48033
46148
50736
48114
38390
44112
36287
30333
35908
40005
35263
26591
49709
47840
64781
57802
48154
54353
39737
37732
37163
43782
40649
29412


Summary of computational transaction
Raw Inputview raw input (R code)
Raw Outputview raw output of R engine
Computing time1 seconds
R Server'Herman Ole Andreas Wold' @ wold.wessa.net

\begin{tabular}{lllllllll}
\hline
Summary of computational transaction \tabularnewline
Raw Input & view raw input (R code)  \tabularnewline
Raw Output & view raw output of R engine  \tabularnewline
Computing time & 1 seconds \tabularnewline
R Server & 'Herman Ole Andreas Wold' @ wold.wessa.net \tabularnewline
\hline
\end{tabular}
%Source: https://freestatistics.org/blog/index.php?pk=130901&T=0

[TABLE]
[ROW][C]Summary of computational transaction[/C][/ROW]
[ROW][C]Raw Input[/C][C]view raw input (R code) [/C][/ROW]
[ROW][C]Raw Output[/C][C]view raw output of R engine [/C][/ROW]
[ROW][C]Computing time[/C][C]1 seconds[/C][/ROW]
[ROW][C]R Server[/C][C]'Herman Ole Andreas Wold' @ wold.wessa.net[/C][/ROW]
[/TABLE]
Source: https://freestatistics.org/blog/index.php?pk=130901&T=0

Globally Unique Identifier (entire table): ba.freestatistics.org/blog/index.php?pk=130901&T=0

As an alternative you can also use a QR Code:  

The GUIDs for individual cells are displayed in the table below:

Summary of computational transaction
Raw Inputview raw input (R code)
Raw Outputview raw output of R engine
Computing time1 seconds
R Server'Herman Ole Andreas Wold' @ wold.wessa.net


Central Tendency - Ungrouped Data
MeasureValueS.E.Value/S.E.
Arithmetic Mean42917.44047619051140.7079106382937.6235143772921
Geometric Mean41582.4750066788
Harmonic Mean40159.7264725873
Quadratic Mean44157.7570040752
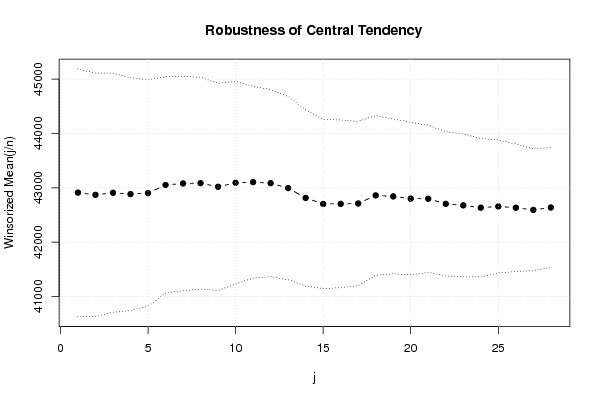
Winsorized Mean ( 1 / 28 )42911.23809523811137.9283708690337.7099641715296
Winsorized Mean ( 2 / 28 )42869.92857142861120.8782831262138.2467295662658
Winsorized Mean ( 3 / 28 )42908.53571428571099.9013562725739.011258118362
Winsorized Mean ( 4 / 28 )42883.77380952381071.7224688796840.0138795768202
Winsorized Mean ( 5 / 28 )42903.17857142861041.486827366541.1941634249117
Winsorized Mean ( 6 / 28 )43051.1071428571996.1729731199343.2164978417601
Winsorized Mean ( 7 / 28 )43079.3571428571987.44957657459943.6268931243019
Winsorized Mean ( 8 / 28 )43084.6904761905974.40998108504144.2161834469451
Winsorized Mean ( 9 / 28 )43018.2619047619953.54121237338645.1142135720474
Winsorized Mean ( 10 / 28 )43091.8333333333932.15691475285146.2280895537406
Winsorized Mean ( 11 / 28 )43104.2738095238882.64452371017948.835372170368
Winsorized Mean ( 12 / 28 )43084.8452380952859.58232620790150.1230003508409
Winsorized Mean ( 13 / 28 )42994843.62223734676150.9635688779595
Winsorized Mean ( 14 / 28 )42813.6666666667810.72457310047952.809138993941
Winsorized Mean ( 15 / 28 )42702.0595238095778.83493747093554.8281252796304
Winsorized Mean ( 16 / 28 )42704.3452380952771.79877826354655.3309313784804
Winsorized Mean ( 17 / 28 )42711.0238095238755.73958448472256.5155308606006
Winsorized Mean ( 18 / 28 )42859.5238095238734.53574143369258.3491331897195
Winsorized Mean ( 19 / 28 )42841.2023809524712.40843374537160.1357316276027
Winsorized Mean ( 20 / 28 )42800.9642857143702.69999091824260.9092996141708
Winsorized Mean ( 21 / 28 )42798.2142857143677.5879216653463.1625991510106
Winsorized Mean ( 22 / 28 )42704.1904761905663.08224340952764.4025547368124
Winsorized Mean ( 23 / 28 )42676.5357142857657.97014051393464.8609003456472
Winsorized Mean ( 24 / 28 )42633.6785714286637.84583459432266.8400987497929
Winsorized Mean ( 25 / 28 )42656.5952380952612.46556499712169.6473363988974
Winsorized Mean ( 26 / 28 )42633.380952381587.42276842610972.5769977670584
Winsorized Mean ( 27 / 28 )42592.5595238095560.26645353197576.0219700024905
Winsorized Mean ( 28 / 28 )42637.2261904762551.54682431528477.3048167640309
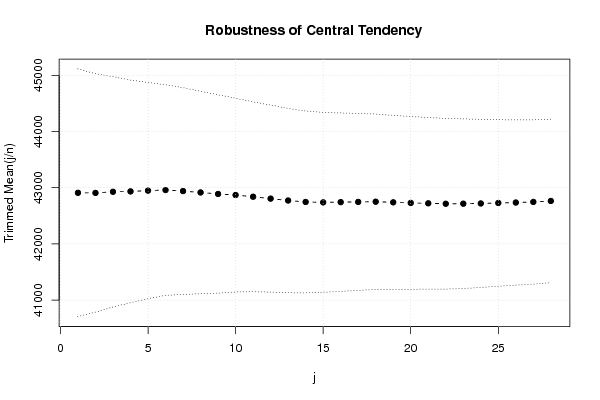
Trimmed Mean ( 1 / 28 )42909.18292682931102.8609428653438.9071561600026
Trimmed Mean ( 2 / 28 )42907.0251062.109817556140.3979177018893
Trimmed Mean ( 3 / 28 )429271025.3516620989341.8656365291564
Trimmed Mean ( 4 / 28 )42933.8026315789991.86429780997943.28596434651
Trimmed Mean ( 5 / 28 )42948962.79163148480144.6077828218826
Trimmed Mean ( 6 / 28 )42958.4583333333937.86161662975645.8046875696932
Trimmed Mean ( 7 / 28 )42939.9285714286920.50195783463946.6483837497089
Trimmed Mean ( 8 / 28 )42915.3235294118901.88038673425747.5842741018127
Trimmed Mean ( 9 / 28 )42888.3787878788882.51666169289548.5978119728729
Trimmed Mean ( 10 / 28 )42869.4375863.71851264449749.6335749117432
Trimmed Mean ( 11 / 28 )42839.3064516129845.3095989828750.6788359000772
Trimmed Mean ( 12 / 28 )42805.5833333333832.54914932422451.4150826627814
Trimmed Mean ( 13 / 28 )42771.8793103448820.98211370341352.0984301562952
Trimmed Mean ( 14 / 28 )42746.25809.36961290389952.8142511387754
Trimmed Mean ( 15 / 28 )42738.7592592593800.59559063553653.3837055301941
Trimmed Mean ( 16 / 28 )42742.7115384615794.67346773006853.7865088922035
Trimmed Mean ( 17 / 28 )42746.74787.62173756032854.2731846538527
Trimmed Mean ( 18 / 28 )42750.4166666667780.69947316841354.7591206808007
Trimmed Mean ( 19 / 28 )42739.347826087774.70852877573655.1682939306574
Trimmed Mean ( 20 / 28 )42729.1136363636769.89480639449955.4999374998628
Trimmed Mean ( 21 / 28 )42721.9285714286764.09528413918155.911781499291
Trimmed Mean ( 22 / 28 )42714.3759.8899280951956.2111674608869
Trimmed Mean ( 23 / 28 )42715.3157894737755.44577676303756.5431922493523
Trimmed Mean ( 24 / 28 )42719.25748.5701570062257.067797320225
Trimmed Mean ( 25 / 28 )42728.0588235294741.71089007673757.607430867179
Trimmed Mean ( 26 / 28 )42735.5625735.96464558524258.0674122817632
Trimmed Mean ( 27 / 28 )42746.5666666667731.40441143401258.4445021091089
Trimmed Mean ( 28 / 28 )42763.6785714286728.76317462670158.6798016973534
Median42518
Midrange43256
Midmean - Weighted Average at Xnp42548.4651162791
Midmean - Weighted Average at X(n+1)p42721.9285714286
Midmean - Empirical Distribution Function42548.4651162791
Midmean - Empirical Distribution Function - Averaging42721.9285714286
Midmean - Empirical Distribution Function - Interpolation42721.9285714286
Midmean - Closest Observation42548.4651162791
Midmean - True Basic - Statistics Graphics Toolkit42721.9285714286
Midmean - MS Excel (old versions)42729.1136363636
Number of observations84

\begin{tabular}{lllllllll}
\hline
Central Tendency - Ungrouped Data \tabularnewline
Measure & Value & S.E. & Value/S.E. \tabularnewline
Arithmetic Mean & 42917.4404761905 & 1140.70791063829 & 37.6235143772921 \tabularnewline
Geometric Mean & 41582.4750066788 &  &  \tabularnewline
Harmonic Mean & 40159.7264725873 &  &  \tabularnewline
Quadratic Mean & 44157.7570040752 &  &  \tabularnewline
Winsorized Mean ( 1 / 28 ) & 42911.2380952381 & 1137.92837086903 & 37.7099641715296 \tabularnewline
Winsorized Mean ( 2 / 28 ) & 42869.9285714286 & 1120.87828312621 & 38.2467295662658 \tabularnewline
Winsorized Mean ( 3 / 28 ) & 42908.5357142857 & 1099.90135627257 & 39.011258118362 \tabularnewline
Winsorized Mean ( 4 / 28 ) & 42883.7738095238 & 1071.72246887968 & 40.0138795768202 \tabularnewline
Winsorized Mean ( 5 / 28 ) & 42903.1785714286 & 1041.4868273665 & 41.1941634249117 \tabularnewline
Winsorized Mean ( 6 / 28 ) & 43051.1071428571 & 996.17297311993 & 43.2164978417601 \tabularnewline
Winsorized Mean ( 7 / 28 ) & 43079.3571428571 & 987.449576574599 & 43.6268931243019 \tabularnewline
Winsorized Mean ( 8 / 28 ) & 43084.6904761905 & 974.409981085041 & 44.2161834469451 \tabularnewline
Winsorized Mean ( 9 / 28 ) & 43018.2619047619 & 953.541212373386 & 45.1142135720474 \tabularnewline
Winsorized Mean ( 10 / 28 ) & 43091.8333333333 & 932.156914752851 & 46.2280895537406 \tabularnewline
Winsorized Mean ( 11 / 28 ) & 43104.2738095238 & 882.644523710179 & 48.835372170368 \tabularnewline
Winsorized Mean ( 12 / 28 ) & 43084.8452380952 & 859.582326207901 & 50.1230003508409 \tabularnewline
Winsorized Mean ( 13 / 28 ) & 42994 & 843.622237346761 & 50.9635688779595 \tabularnewline
Winsorized Mean ( 14 / 28 ) & 42813.6666666667 & 810.724573100479 & 52.809138993941 \tabularnewline
Winsorized Mean ( 15 / 28 ) & 42702.0595238095 & 778.834937470935 & 54.8281252796304 \tabularnewline
Winsorized Mean ( 16 / 28 ) & 42704.3452380952 & 771.798778263546 & 55.3309313784804 \tabularnewline
Winsorized Mean ( 17 / 28 ) & 42711.0238095238 & 755.739584484722 & 56.5155308606006 \tabularnewline
Winsorized Mean ( 18 / 28 ) & 42859.5238095238 & 734.535741433692 & 58.3491331897195 \tabularnewline
Winsorized Mean ( 19 / 28 ) & 42841.2023809524 & 712.408433745371 & 60.1357316276027 \tabularnewline
Winsorized Mean ( 20 / 28 ) & 42800.9642857143 & 702.699990918242 & 60.9092996141708 \tabularnewline
Winsorized Mean ( 21 / 28 ) & 42798.2142857143 & 677.58792166534 & 63.1625991510106 \tabularnewline
Winsorized Mean ( 22 / 28 ) & 42704.1904761905 & 663.082243409527 & 64.4025547368124 \tabularnewline
Winsorized Mean ( 23 / 28 ) & 42676.5357142857 & 657.970140513934 & 64.8609003456472 \tabularnewline
Winsorized Mean ( 24 / 28 ) & 42633.6785714286 & 637.845834594322 & 66.8400987497929 \tabularnewline
Winsorized Mean ( 25 / 28 ) & 42656.5952380952 & 612.465564997121 & 69.6473363988974 \tabularnewline
Winsorized Mean ( 26 / 28 ) & 42633.380952381 & 587.422768426109 & 72.5769977670584 \tabularnewline
Winsorized Mean ( 27 / 28 ) & 42592.5595238095 & 560.266453531975 & 76.0219700024905 \tabularnewline
Winsorized Mean ( 28 / 28 ) & 42637.2261904762 & 551.546824315284 & 77.3048167640309 \tabularnewline
Trimmed Mean ( 1 / 28 ) & 42909.1829268293 & 1102.86094286534 & 38.9071561600026 \tabularnewline
Trimmed Mean ( 2 / 28 ) & 42907.025 & 1062.1098175561 & 40.3979177018893 \tabularnewline
Trimmed Mean ( 3 / 28 ) & 42927 & 1025.35166209893 & 41.8656365291564 \tabularnewline
Trimmed Mean ( 4 / 28 ) & 42933.8026315789 & 991.864297809979 & 43.28596434651 \tabularnewline
Trimmed Mean ( 5 / 28 ) & 42948 & 962.791631484801 & 44.6077828218826 \tabularnewline
Trimmed Mean ( 6 / 28 ) & 42958.4583333333 & 937.861616629756 & 45.8046875696932 \tabularnewline
Trimmed Mean ( 7 / 28 ) & 42939.9285714286 & 920.501957834639 & 46.6483837497089 \tabularnewline
Trimmed Mean ( 8 / 28 ) & 42915.3235294118 & 901.880386734257 & 47.5842741018127 \tabularnewline
Trimmed Mean ( 9 / 28 ) & 42888.3787878788 & 882.516661692895 & 48.5978119728729 \tabularnewline
Trimmed Mean ( 10 / 28 ) & 42869.4375 & 863.718512644497 & 49.6335749117432 \tabularnewline
Trimmed Mean ( 11 / 28 ) & 42839.3064516129 & 845.30959898287 & 50.6788359000772 \tabularnewline
Trimmed Mean ( 12 / 28 ) & 42805.5833333333 & 832.549149324224 & 51.4150826627814 \tabularnewline
Trimmed Mean ( 13 / 28 ) & 42771.8793103448 & 820.982113703413 & 52.0984301562952 \tabularnewline
Trimmed Mean ( 14 / 28 ) & 42746.25 & 809.369612903899 & 52.8142511387754 \tabularnewline
Trimmed Mean ( 15 / 28 ) & 42738.7592592593 & 800.595590635536 & 53.3837055301941 \tabularnewline
Trimmed Mean ( 16 / 28 ) & 42742.7115384615 & 794.673467730068 & 53.7865088922035 \tabularnewline
Trimmed Mean ( 17 / 28 ) & 42746.74 & 787.621737560328 & 54.2731846538527 \tabularnewline
Trimmed Mean ( 18 / 28 ) & 42750.4166666667 & 780.699473168413 & 54.7591206808007 \tabularnewline
Trimmed Mean ( 19 / 28 ) & 42739.347826087 & 774.708528775736 & 55.1682939306574 \tabularnewline
Trimmed Mean ( 20 / 28 ) & 42729.1136363636 & 769.894806394499 & 55.4999374998628 \tabularnewline
Trimmed Mean ( 21 / 28 ) & 42721.9285714286 & 764.095284139181 & 55.911781499291 \tabularnewline
Trimmed Mean ( 22 / 28 ) & 42714.3 & 759.88992809519 & 56.2111674608869 \tabularnewline
Trimmed Mean ( 23 / 28 ) & 42715.3157894737 & 755.445776763037 & 56.5431922493523 \tabularnewline
Trimmed Mean ( 24 / 28 ) & 42719.25 & 748.57015700622 & 57.067797320225 \tabularnewline
Trimmed Mean ( 25 / 28 ) & 42728.0588235294 & 741.710890076737 & 57.607430867179 \tabularnewline
Trimmed Mean ( 26 / 28 ) & 42735.5625 & 735.964645585242 & 58.0674122817632 \tabularnewline
Trimmed Mean ( 27 / 28 ) & 42746.5666666667 & 731.404411434012 & 58.4445021091089 \tabularnewline
Trimmed Mean ( 28 / 28 ) & 42763.6785714286 & 728.763174626701 & 58.6798016973534 \tabularnewline
Median & 42518 &  &  \tabularnewline
Midrange & 43256 &  &  \tabularnewline
Midmean - Weighted Average at Xnp & 42548.4651162791 &  &  \tabularnewline
Midmean - Weighted Average at X(n+1)p & 42721.9285714286 &  &  \tabularnewline
Midmean - Empirical Distribution Function & 42548.4651162791 &  &  \tabularnewline
Midmean - Empirical Distribution Function - Averaging & 42721.9285714286 &  &  \tabularnewline
Midmean - Empirical Distribution Function - Interpolation & 42721.9285714286 &  &  \tabularnewline
Midmean - Closest Observation & 42548.4651162791 &  &  \tabularnewline
Midmean - True Basic - Statistics Graphics Toolkit & 42721.9285714286 &  &  \tabularnewline
Midmean - MS Excel (old versions) & 42729.1136363636 &  &  \tabularnewline
Number of observations & 84 &  &  \tabularnewline
\hline
\end{tabular}
%Source: https://freestatistics.org/blog/index.php?pk=130901&T=1

[TABLE]
[ROW][C]Central Tendency - Ungrouped Data[/C][/ROW]
[ROW][C]Measure[/C][C]Value[/C][C]S.E.[/C][C]Value/S.E.[/C][/ROW]
[ROW][C]Arithmetic Mean[/C][C]42917.4404761905[/C][C]1140.70791063829[/C][C]37.6235143772921[/C][/ROW]
[ROW][C]Geometric Mean[/C][C]41582.4750066788[/C][C][/C][C][/C][/ROW]
[ROW][C]Harmonic Mean[/C][C]40159.7264725873[/C][C][/C][C][/C][/ROW]
[ROW][C]Quadratic Mean[/C][C]44157.7570040752[/C][C][/C][C][/C][/ROW]
[ROW][C]Winsorized Mean ( 1 / 28 )[/C][C]42911.2380952381[/C][C]1137.92837086903[/C][C]37.7099641715296[/C][/ROW]
[ROW][C]Winsorized Mean ( 2 / 28 )[/C][C]42869.9285714286[/C][C]1120.87828312621[/C][C]38.2467295662658[/C][/ROW]
[ROW][C]Winsorized Mean ( 3 / 28 )[/C][C]42908.5357142857[/C][C]1099.90135627257[/C][C]39.011258118362[/C][/ROW]
[ROW][C]Winsorized Mean ( 4 / 28 )[/C][C]42883.7738095238[/C][C]1071.72246887968[/C][C]40.0138795768202[/C][/ROW]
[ROW][C]Winsorized Mean ( 5 / 28 )[/C][C]42903.1785714286[/C][C]1041.4868273665[/C][C]41.1941634249117[/C][/ROW]
[ROW][C]Winsorized Mean ( 6 / 28 )[/C][C]43051.1071428571[/C][C]996.17297311993[/C][C]43.2164978417601[/C][/ROW]
[ROW][C]Winsorized Mean ( 7 / 28 )[/C][C]43079.3571428571[/C][C]987.449576574599[/C][C]43.6268931243019[/C][/ROW]
[ROW][C]Winsorized Mean ( 8 / 28 )[/C][C]43084.6904761905[/C][C]974.409981085041[/C][C]44.2161834469451[/C][/ROW]
[ROW][C]Winsorized Mean ( 9 / 28 )[/C][C]43018.2619047619[/C][C]953.541212373386[/C][C]45.1142135720474[/C][/ROW]
[ROW][C]Winsorized Mean ( 10 / 28 )[/C][C]43091.8333333333[/C][C]932.156914752851[/C][C]46.2280895537406[/C][/ROW]
[ROW][C]Winsorized Mean ( 11 / 28 )[/C][C]43104.2738095238[/C][C]882.644523710179[/C][C]48.835372170368[/C][/ROW]
[ROW][C]Winsorized Mean ( 12 / 28 )[/C][C]43084.8452380952[/C][C]859.582326207901[/C][C]50.1230003508409[/C][/ROW]
[ROW][C]Winsorized Mean ( 13 / 28 )[/C][C]42994[/C][C]843.622237346761[/C][C]50.9635688779595[/C][/ROW]
[ROW][C]Winsorized Mean ( 14 / 28 )[/C][C]42813.6666666667[/C][C]810.724573100479[/C][C]52.809138993941[/C][/ROW]
[ROW][C]Winsorized Mean ( 15 / 28 )[/C][C]42702.0595238095[/C][C]778.834937470935[/C][C]54.8281252796304[/C][/ROW]
[ROW][C]Winsorized Mean ( 16 / 28 )[/C][C]42704.3452380952[/C][C]771.798778263546[/C][C]55.3309313784804[/C][/ROW]
[ROW][C]Winsorized Mean ( 17 / 28 )[/C][C]42711.0238095238[/C][C]755.739584484722[/C][C]56.5155308606006[/C][/ROW]
[ROW][C]Winsorized Mean ( 18 / 28 )[/C][C]42859.5238095238[/C][C]734.535741433692[/C][C]58.3491331897195[/C][/ROW]
[ROW][C]Winsorized Mean ( 19 / 28 )[/C][C]42841.2023809524[/C][C]712.408433745371[/C][C]60.1357316276027[/C][/ROW]
[ROW][C]Winsorized Mean ( 20 / 28 )[/C][C]42800.9642857143[/C][C]702.699990918242[/C][C]60.9092996141708[/C][/ROW]
[ROW][C]Winsorized Mean ( 21 / 28 )[/C][C]42798.2142857143[/C][C]677.58792166534[/C][C]63.1625991510106[/C][/ROW]
[ROW][C]Winsorized Mean ( 22 / 28 )[/C][C]42704.1904761905[/C][C]663.082243409527[/C][C]64.4025547368124[/C][/ROW]
[ROW][C]Winsorized Mean ( 23 / 28 )[/C][C]42676.5357142857[/C][C]657.970140513934[/C][C]64.8609003456472[/C][/ROW]
[ROW][C]Winsorized Mean ( 24 / 28 )[/C][C]42633.6785714286[/C][C]637.845834594322[/C][C]66.8400987497929[/C][/ROW]
[ROW][C]Winsorized Mean ( 25 / 28 )[/C][C]42656.5952380952[/C][C]612.465564997121[/C][C]69.6473363988974[/C][/ROW]
[ROW][C]Winsorized Mean ( 26 / 28 )[/C][C]42633.380952381[/C][C]587.422768426109[/C][C]72.5769977670584[/C][/ROW]
[ROW][C]Winsorized Mean ( 27 / 28 )[/C][C]42592.5595238095[/C][C]560.266453531975[/C][C]76.0219700024905[/C][/ROW]
[ROW][C]Winsorized Mean ( 28 / 28 )[/C][C]42637.2261904762[/C][C]551.546824315284[/C][C]77.3048167640309[/C][/ROW]
[ROW][C]Trimmed Mean ( 1 / 28 )[/C][C]42909.1829268293[/C][C]1102.86094286534[/C][C]38.9071561600026[/C][/ROW]
[ROW][C]Trimmed Mean ( 2 / 28 )[/C][C]42907.025[/C][C]1062.1098175561[/C][C]40.3979177018893[/C][/ROW]
[ROW][C]Trimmed Mean ( 3 / 28 )[/C][C]42927[/C][C]1025.35166209893[/C][C]41.8656365291564[/C][/ROW]
[ROW][C]Trimmed Mean ( 4 / 28 )[/C][C]42933.8026315789[/C][C]991.864297809979[/C][C]43.28596434651[/C][/ROW]
[ROW][C]Trimmed Mean ( 5 / 28 )[/C][C]42948[/C][C]962.791631484801[/C][C]44.6077828218826[/C][/ROW]
[ROW][C]Trimmed Mean ( 6 / 28 )[/C][C]42958.4583333333[/C][C]937.861616629756[/C][C]45.8046875696932[/C][/ROW]
[ROW][C]Trimmed Mean ( 7 / 28 )[/C][C]42939.9285714286[/C][C]920.501957834639[/C][C]46.6483837497089[/C][/ROW]
[ROW][C]Trimmed Mean ( 8 / 28 )[/C][C]42915.3235294118[/C][C]901.880386734257[/C][C]47.5842741018127[/C][/ROW]
[ROW][C]Trimmed Mean ( 9 / 28 )[/C][C]42888.3787878788[/C][C]882.516661692895[/C][C]48.5978119728729[/C][/ROW]
[ROW][C]Trimmed Mean ( 10 / 28 )[/C][C]42869.4375[/C][C]863.718512644497[/C][C]49.6335749117432[/C][/ROW]
[ROW][C]Trimmed Mean ( 11 / 28 )[/C][C]42839.3064516129[/C][C]845.30959898287[/C][C]50.6788359000772[/C][/ROW]
[ROW][C]Trimmed Mean ( 12 / 28 )[/C][C]42805.5833333333[/C][C]832.549149324224[/C][C]51.4150826627814[/C][/ROW]
[ROW][C]Trimmed Mean ( 13 / 28 )[/C][C]42771.8793103448[/C][C]820.982113703413[/C][C]52.0984301562952[/C][/ROW]
[ROW][C]Trimmed Mean ( 14 / 28 )[/C][C]42746.25[/C][C]809.369612903899[/C][C]52.8142511387754[/C][/ROW]
[ROW][C]Trimmed Mean ( 15 / 28 )[/C][C]42738.7592592593[/C][C]800.595590635536[/C][C]53.3837055301941[/C][/ROW]
[ROW][C]Trimmed Mean ( 16 / 28 )[/C][C]42742.7115384615[/C][C]794.673467730068[/C][C]53.7865088922035[/C][/ROW]
[ROW][C]Trimmed Mean ( 17 / 28 )[/C][C]42746.74[/C][C]787.621737560328[/C][C]54.2731846538527[/C][/ROW]
[ROW][C]Trimmed Mean ( 18 / 28 )[/C][C]42750.4166666667[/C][C]780.699473168413[/C][C]54.7591206808007[/C][/ROW]
[ROW][C]Trimmed Mean ( 19 / 28 )[/C][C]42739.347826087[/C][C]774.708528775736[/C][C]55.1682939306574[/C][/ROW]
[ROW][C]Trimmed Mean ( 20 / 28 )[/C][C]42729.1136363636[/C][C]769.894806394499[/C][C]55.4999374998628[/C][/ROW]
[ROW][C]Trimmed Mean ( 21 / 28 )[/C][C]42721.9285714286[/C][C]764.095284139181[/C][C]55.911781499291[/C][/ROW]
[ROW][C]Trimmed Mean ( 22 / 28 )[/C][C]42714.3[/C][C]759.88992809519[/C][C]56.2111674608869[/C][/ROW]
[ROW][C]Trimmed Mean ( 23 / 28 )[/C][C]42715.3157894737[/C][C]755.445776763037[/C][C]56.5431922493523[/C][/ROW]
[ROW][C]Trimmed Mean ( 24 / 28 )[/C][C]42719.25[/C][C]748.57015700622[/C][C]57.067797320225[/C][/ROW]
[ROW][C]Trimmed Mean ( 25 / 28 )[/C][C]42728.0588235294[/C][C]741.710890076737[/C][C]57.607430867179[/C][/ROW]
[ROW][C]Trimmed Mean ( 26 / 28 )[/C][C]42735.5625[/C][C]735.964645585242[/C][C]58.0674122817632[/C][/ROW]
[ROW][C]Trimmed Mean ( 27 / 28 )[/C][C]42746.5666666667[/C][C]731.404411434012[/C][C]58.4445021091089[/C][/ROW]
[ROW][C]Trimmed Mean ( 28 / 28 )[/C][C]42763.6785714286[/C][C]728.763174626701[/C][C]58.6798016973534[/C][/ROW]
[ROW][C]Median[/C][C]42518[/C][C][/C][C][/C][/ROW]
[ROW][C]Midrange[/C][C]43256[/C][C][/C][C][/C][/ROW]
[ROW][C]Midmean - Weighted Average at Xnp[/C][C]42548.4651162791[/C][C][/C][C][/C][/ROW]
[ROW][C]Midmean - Weighted Average at X(n+1)p[/C][C]42721.9285714286[/C][C][/C][C][/C][/ROW]
[ROW][C]Midmean - Empirical Distribution Function[/C][C]42548.4651162791[/C][C][/C][C][/C][/ROW]
[ROW][C]Midmean - Empirical Distribution Function - Averaging[/C][C]42721.9285714286[/C][C][/C][C][/C][/ROW]
[ROW][C]Midmean - Empirical Distribution Function - Interpolation[/C][C]42721.9285714286[/C][C][/C][C][/C][/ROW]
[ROW][C]Midmean - Closest Observation[/C][C]42548.4651162791[/C][C][/C][C][/C][/ROW]
[ROW][C]Midmean - True Basic - Statistics Graphics Toolkit[/C][C]42721.9285714286[/C][C][/C][C][/C][/ROW]
[ROW][C]Midmean - MS Excel (old versions)[/C][C]42729.1136363636[/C][C][/C][C][/C][/ROW]
[ROW][C]Number of observations[/C][C]84[/C][C][/C][C][/C][/ROW]
[/TABLE]
Source: https://freestatistics.org/blog/index.php?pk=130901&T=1

Globally Unique Identifier (entire table): ba.freestatistics.org/blog/index.php?pk=130901&T=1

As an alternative you can also use a QR Code:  

The GUIDs for individual cells are displayed in the table below:

Central Tendency - Ungrouped Data
MeasureValueS.E.Value/S.E.
Arithmetic Mean42917.44047619051140.7079106382937.6235143772921
Geometric Mean41582.4750066788
Harmonic Mean40159.7264725873
Quadratic Mean44157.7570040752
Winsorized Mean ( 1 / 28 )42911.23809523811137.9283708690337.7099641715296
Winsorized Mean ( 2 / 28 )42869.92857142861120.8782831262138.2467295662658
Winsorized Mean ( 3 / 28 )42908.53571428571099.9013562725739.011258118362
Winsorized Mean ( 4 / 28 )42883.77380952381071.7224688796840.0138795768202
Winsorized Mean ( 5 / 28 )42903.17857142861041.486827366541.1941634249117
Winsorized Mean ( 6 / 28 )43051.1071428571996.1729731199343.2164978417601
Winsorized Mean ( 7 / 28 )43079.3571428571987.44957657459943.6268931243019
Winsorized Mean ( 8 / 28 )43084.6904761905974.40998108504144.2161834469451
Winsorized Mean ( 9 / 28 )43018.2619047619953.54121237338645.1142135720474
Winsorized Mean ( 10 / 28 )43091.8333333333932.15691475285146.2280895537406
Winsorized Mean ( 11 / 28 )43104.2738095238882.64452371017948.835372170368
Winsorized Mean ( 12 / 28 )43084.8452380952859.58232620790150.1230003508409
Winsorized Mean ( 13 / 28 )42994843.62223734676150.9635688779595
Winsorized Mean ( 14 / 28 )42813.6666666667810.72457310047952.809138993941
Winsorized Mean ( 15 / 28 )42702.0595238095778.83493747093554.8281252796304
Winsorized Mean ( 16 / 28 )42704.3452380952771.79877826354655.3309313784804
Winsorized Mean ( 17 / 28 )42711.0238095238755.73958448472256.5155308606006
Winsorized Mean ( 18 / 28 )42859.5238095238734.53574143369258.3491331897195
Winsorized Mean ( 19 / 28 )42841.2023809524712.40843374537160.1357316276027
Winsorized Mean ( 20 / 28 )42800.9642857143702.69999091824260.9092996141708
Winsorized Mean ( 21 / 28 )42798.2142857143677.5879216653463.1625991510106
Winsorized Mean ( 22 / 28 )42704.1904761905663.08224340952764.4025547368124
Winsorized Mean ( 23 / 28 )42676.5357142857657.97014051393464.8609003456472
Winsorized Mean ( 24 / 28 )42633.6785714286637.84583459432266.8400987497929
Winsorized Mean ( 25 / 28 )42656.5952380952612.46556499712169.6473363988974
Winsorized Mean ( 26 / 28 )42633.380952381587.42276842610972.5769977670584
Winsorized Mean ( 27 / 28 )42592.5595238095560.26645353197576.0219700024905
Winsorized Mean ( 28 / 28 )42637.2261904762551.54682431528477.3048167640309
Trimmed Mean ( 1 / 28 )42909.18292682931102.8609428653438.9071561600026
Trimmed Mean ( 2 / 28 )42907.0251062.109817556140.3979177018893
Trimmed Mean ( 3 / 28 )429271025.3516620989341.8656365291564
Trimmed Mean ( 4 / 28 )42933.8026315789991.86429780997943.28596434651
Trimmed Mean ( 5 / 28 )42948962.79163148480144.6077828218826
Trimmed Mean ( 6 / 28 )42958.4583333333937.86161662975645.8046875696932
Trimmed Mean ( 7 / 28 )42939.9285714286920.50195783463946.6483837497089
Trimmed Mean ( 8 / 28 )42915.3235294118901.88038673425747.5842741018127
Trimmed Mean ( 9 / 28 )42888.3787878788882.51666169289548.5978119728729
Trimmed Mean ( 10 / 28 )42869.4375863.71851264449749.6335749117432
Trimmed Mean ( 11 / 28 )42839.3064516129845.3095989828750.6788359000772
Trimmed Mean ( 12 / 28 )42805.5833333333832.54914932422451.4150826627814
Trimmed Mean ( 13 / 28 )42771.8793103448820.98211370341352.0984301562952
Trimmed Mean ( 14 / 28 )42746.25809.36961290389952.8142511387754
Trimmed Mean ( 15 / 28 )42738.7592592593800.59559063553653.3837055301941
Trimmed Mean ( 16 / 28 )42742.7115384615794.67346773006853.7865088922035
Trimmed Mean ( 17 / 28 )42746.74787.62173756032854.2731846538527
Trimmed Mean ( 18 / 28 )42750.4166666667780.69947316841354.7591206808007
Trimmed Mean ( 19 / 28 )42739.347826087774.70852877573655.1682939306574
Trimmed Mean ( 20 / 28 )42729.1136363636769.89480639449955.4999374998628
Trimmed Mean ( 21 / 28 )42721.9285714286764.09528413918155.911781499291
Trimmed Mean ( 22 / 28 )42714.3759.8899280951956.2111674608869
Trimmed Mean ( 23 / 28 )42715.3157894737755.44577676303756.5431922493523
Trimmed Mean ( 24 / 28 )42719.25748.5701570062257.067797320225
Trimmed Mean ( 25 / 28 )42728.0588235294741.71089007673757.607430867179
Trimmed Mean ( 26 / 28 )42735.5625735.96464558524258.0674122817632
Trimmed Mean ( 27 / 28 )42746.5666666667731.40441143401258.4445021091089
Trimmed Mean ( 28 / 28 )42763.6785714286728.76317462670158.6798016973534
Median42518
Midrange43256
Midmean - Weighted Average at Xnp42548.4651162791
Midmean - Weighted Average at X(n+1)p42721.9285714286
Midmean - Empirical Distribution Function42548.4651162791
Midmean - Empirical Distribution Function - Averaging42721.9285714286
Midmean - Empirical Distribution Function - Interpolation42721.9285714286
Midmean - Closest Observation42548.4651162791
Midmean - True Basic - Statistics Graphics Toolkit42721.9285714286
Midmean - MS Excel (old versions)42729.1136363636
Number of observations84


Parameters (Session):
Parameters (R input):
R code (references can be found in the software module):
geomean <- function(x) {
return(exp(mean(log(x))))
}
harmean <- function(x) {
return(1/mean(1/x))
}
quamean <- function(x) {
return(sqrt(mean(x*x)))
}
winmean <- function(x) {
x <-sort(x[!is.na(x)])
n<-length(x)
denom <- 3
nodenom <- n/denom
if (nodenom>40) denom <- n/40
sqrtn = sqrt(n)
roundnodenom = floor(nodenom)
win <- array(NA,dim=c(roundnodenom,2))
for (j in 1:roundnodenom) {
win[j,1] <- (j*x[j+1]+sum(x[(j+1):(n-j)])+j*x[n-j])/n
win[j,2] <- sd(c(rep(x[j+1],j),x[(j+1):(n-j)],rep(x[n-j],j)))/sqrtn
}
return(win)
}
trimean <- function(x) {
x <-sort(x[!is.na(x)])
n<-length(x)
denom <- 3
nodenom <- n/denom
if (nodenom>40) denom <- n/40
sqrtn = sqrt(n)
roundnodenom = floor(nodenom)
tri <- array(NA,dim=c(roundnodenom,2))
for (j in 1:roundnodenom) {
tri[j,1] <- mean(x,trim=j/n)
tri[j,2] <- sd(x[(j+1):(n-j)]) / sqrt(n-j*2)
}
return(tri)
}
midrange <- function(x) {
return((max(x)+min(x))/2)
}
q1 <- function(data,n,p,i,f) {
np <- n*p;
i <<- floor(np)
f <<- np - i
qvalue <- (1-f)*data[i] + f*data[i+1]
}
q2 <- function(data,n,p,i,f) {
np <- (n+1)*p
i <<- floor(np)
f <<- np - i
qvalue <- (1-f)*data[i] + f*data[i+1]
}
q3 <- function(data,n,p,i,f) {
np <- n*p
i <<- floor(np)
f <<- np - i
if (f==0) {
qvalue <- data[i]
} else {
qvalue <- data[i+1]
}
}
q4 <- function(data,n,p,i,f) {
np <- n*p
i <<- floor(np)
f <<- np - i
if (f==0) {
qvalue <- (data[i]+data[i+1])/2
} else {
qvalue <- data[i+1]
}
}
q5 <- function(data,n,p,i,f) {
np <- (n-1)*p
i <<- floor(np)
f <<- np - i
if (f==0) {
qvalue <- data[i+1]
} else {
qvalue <- data[i+1] + f*(data[i+2]-data[i+1])
}
}
q6 <- function(data,n,p,i,f) {
np <- n*p+0.5
i <<- floor(np)
f <<- np - i
qvalue <- data[i]
}
q7 <- function(data,n,p,i,f) {
np <- (n+1)*p
i <<- floor(np)
f <<- np - i
if (f==0) {
qvalue <- data[i]
} else {
qvalue <- f*data[i] + (1-f)*data[i+1]
}
}
q8 <- function(data,n,p,i,f) {
np <- (n+1)*p
i <<- floor(np)
f <<- np - i
if (f==0) {
qvalue <- data[i]
} else {
if (f == 0.5) {
qvalue <- (data[i]+data[i+1])/2
} else {
if (f < 0.5) {
qvalue <- data[i]
} else {
qvalue <- data[i+1]
}
}
}
}
midmean <- function(x,def) {
x <-sort(x[!is.na(x)])
n<-length(x)
if (def==1) {
qvalue1 <- q1(x,n,0.25,i,f)
qvalue3 <- q1(x,n,0.75,i,f)
}
if (def==2) {
qvalue1 <- q2(x,n,0.25,i,f)
qvalue3 <- q2(x,n,0.75,i,f)
}
if (def==3) {
qvalue1 <- q3(x,n,0.25,i,f)
qvalue3 <- q3(x,n,0.75,i,f)
}
if (def==4) {
qvalue1 <- q4(x,n,0.25,i,f)
qvalue3 <- q4(x,n,0.75,i,f)
}
if (def==5) {
qvalue1 <- q5(x,n,0.25,i,f)
qvalue3 <- q5(x,n,0.75,i,f)
}
if (def==6) {
qvalue1 <- q6(x,n,0.25,i,f)
qvalue3 <- q6(x,n,0.75,i,f)
}
if (def==7) {
qvalue1 <- q7(x,n,0.25,i,f)
qvalue3 <- q7(x,n,0.75,i,f)
}
if (def==8) {
qvalue1 <- q8(x,n,0.25,i,f)
qvalue3 <- q8(x,n,0.75,i,f)
}
midm <- 0
myn <- 0
roundno4 <- round(n/4)
round3no4 <- round(3*n/4)
for (i in 1:n) {
if ((x[i]>=qvalue1) & (x[i]<=qvalue3)){
midm = midm + x[i]
myn = myn + 1
}
}
midm = midm / myn
return(midm)
}
(arm <- mean(x))
sqrtn <- sqrt(length(x))
(armse <- sd(x) / sqrtn)
(armose <- arm / armse)
(geo <- geomean(x))
(har <- harmean(x))
(qua <- quamean(x))
(win <- winmean(x))
(tri <- trimean(x))
(midr <- midrange(x))
midm <- array(NA,dim=8)
for (j in 1:8) midm[j] <- midmean(x,j)
midm
bitmap(file='test1.png')
lb <- win[,1] - 2*win[,2]
ub <- win[,1] + 2*win[,2]
if ((ylimmin == '') | (ylimmax == '')) plot(win[,1],type='b',main=main, xlab='j', pch=19, ylab='Winsorized Mean(j/n)', ylim=c(min(lb),max(ub))) else plot(win[,1],type='l',main=main, xlab='j', pch=19, ylab='Winsorized Mean(j/n)', ylim=c(ylimmin,ylimmax))
lines(ub,lty=3)
lines(lb,lty=3)
grid()
dev.off()
bitmap(file='test2.png')
lb <- tri[,1] - 2*tri[,2]
ub <- tri[,1] + 2*tri[,2]
if ((ylimmin == '') | (ylimmax == '')) plot(tri[,1],type='b',main=main, xlab='j', pch=19, ylab='Trimmed Mean(j/n)', ylim=c(min(lb),max(ub))) else plot(tri[,1],type='l',main=main, xlab='j', pch=19, ylab='Trimmed Mean(j/n)', ylim=c(ylimmin,ylimmax))
lines(ub,lty=3)
lines(lb,lty=3)
grid()
dev.off()
load(file='createtable')
a<-table.start()
a<-table.row.start(a)
a<-table.element(a,'Central Tendency - Ungrouped Data',4,TRUE)
a<-table.row.end(a)
a<-table.row.start(a)
a<-table.element(a,'Measure',header=TRUE)
a<-table.element(a,'Value',header=TRUE)
a<-table.element(a,'S.E.',header=TRUE)
a<-table.element(a,'Value/S.E.',header=TRUE)
a<-table.row.end(a)
a<-table.row.start(a)
a<-table.element(a,hyperlink('arithmetic_mean.htm', 'Arithmetic Mean', 'click to view the definition of the Arithmetic Mean'),header=TRUE)
a<-table.element(a,arm)
a<-table.element(a,hyperlink('arithmetic_mean_standard_error.htm', armse, 'click to view the definition of the Standard Error of the Arithmetic Mean'))
a<-table.element(a,armose)
a<-table.row.end(a)
a<-table.row.start(a)
a<-table.element(a,hyperlink('geometric_mean.htm', 'Geometric Mean', 'click to view the definition of the Geometric Mean'),header=TRUE)
a<-table.element(a,geo)
a<-table.element(a,'')
a<-table.row.end(a)
a<-table.row.start(a)
a<-table.element(a,hyperlink('harmonic_mean.htm', 'Harmonic Mean', 'click to view the definition of the Harmonic Mean'),header=TRUE)
a<-table.element(a,har)
a<-table.element(a,'')
a<-table.row.end(a)
a<-table.row.start(a)
a<-table.element(a,hyperlink('quadratic_mean.htm', 'Quadratic Mean', 'click to view the definition of the Quadratic Mean'),header=TRUE)
a<-table.element(a,qua)
a<-table.element(a,'')
a<-table.row.end(a)
for (j in 1:length(win[,1])) {
a<-table.row.start(a)
mylabel <- paste('Winsorized Mean (',j)
mylabel <- paste(mylabel,'/')
mylabel <- paste(mylabel,length(win[,1]))
mylabel <- paste(mylabel,')')
a<-table.element(a,hyperlink('winsorized_mean.htm', mylabel, 'click to view the definition of the Winsorized Mean'),header=TRUE)
a<-table.element(a,win[j,1])
a<-table.element(a,win[j,2])
a<-table.element(a,win[j,1]/win[j,2])
a<-table.row.end(a)
}
for (j in 1:length(tri[,1])) {
a<-table.row.start(a)
mylabel <- paste('Trimmed Mean (',j)
mylabel <- paste(mylabel,'/')
mylabel <- paste(mylabel,length(tri[,1]))
mylabel <- paste(mylabel,')')
a<-table.element(a,hyperlink('arithmetic_mean.htm', mylabel, 'click to view the definition of the Trimmed Mean'),header=TRUE)
a<-table.element(a,tri[j,1])
a<-table.element(a,tri[j,2])
a<-table.element(a,tri[j,1]/tri[j,2])
a<-table.row.end(a)
}
a<-table.row.start(a)
a<-table.element(a,hyperlink('median_1.htm', 'Median', 'click to view the definition of the Median'),header=TRUE)
a<-table.element(a,median(x))
a<-table.element(a,'')
a<-table.row.end(a)
a<-table.row.start(a)
a<-table.element(a,hyperlink('midrange.htm', 'Midrange', 'click to view the definition of the Midrange'),header=TRUE)
a<-table.element(a,midr)
a<-table.element(a,'')
a<-table.row.end(a)
a<-table.row.start(a)
mymid <- hyperlink('midmean.htm', 'Midmean', 'click to view the definition of the Midmean')
mylabel <- paste(mymid,hyperlink('method_1.htm','Weighted Average at Xnp',''),sep=' - ')
a<-table.element(a,mylabel,header=TRUE)
a<-table.element(a,midm[1])
a<-table.element(a,'')
a<-table.row.end(a)
a<-table.row.start(a)
mymid <- hyperlink('midmean.htm', 'Midmean', 'click to view the definition of the Midmean')
mylabel <- paste(mymid,hyperlink('method_2.htm','Weighted Average at X(n+1)p',''),sep=' - ')
a<-table.element(a,mylabel,header=TRUE)
a<-table.element(a,midm[2])
a<-table.element(a,'')
a<-table.row.end(a)
a<-table.row.start(a)
mymid <- hyperlink('midmean.htm', 'Midmean', 'click to view the definition of the Midmean')
mylabel <- paste(mymid,hyperlink('method_3.htm','Empirical Distribution Function',''),sep=' - ')
a<-table.element(a,mylabel,header=TRUE)
a<-table.element(a,midm[3])
a<-table.element(a,'')
a<-table.row.end(a)
a<-table.row.start(a)
mymid <- hyperlink('midmean.htm', 'Midmean', 'click to view the definition of the Midmean')
mylabel <- paste(mymid,hyperlink('method_4.htm','Empirical Distribution Function - Averaging',''),sep=' - ')
a<-table.element(a,mylabel,header=TRUE)
a<-table.element(a,midm[4])
a<-table.element(a,'')
a<-table.row.end(a)
a<-table.row.start(a)
mymid <- hyperlink('midmean.htm', 'Midmean', 'click to view the definition of the Midmean')
mylabel <- paste(mymid,hyperlink('method_5.htm','Empirical Distribution Function - Interpolation',''),sep=' - ')
a<-table.element(a,mylabel,header=TRUE)
a<-table.element(a,midm[5])
a<-table.element(a,'')
a<-table.row.end(a)
a<-table.row.start(a)
mymid <- hyperlink('midmean.htm', 'Midmean', 'click to view the definition of the Midmean')
mylabel <- paste(mymid,hyperlink('method_6.htm','Closest Observation',''),sep=' - ')
a<-table.element(a,mylabel,header=TRUE)
a<-table.element(a,midm[6])
a<-table.element(a,'')
a<-table.row.end(a)
a<-table.row.start(a)
mymid <- hyperlink('midmean.htm', 'Midmean', 'click to view the definition of the Midmean')
mylabel <- paste(mymid,hyperlink('method_7.htm','True Basic - Statistics Graphics Toolkit',''),sep=' - ')
a<-table.element(a,mylabel,header=TRUE)
a<-table.element(a,midm[7])
a<-table.element(a,'')
a<-table.row.end(a)
a<-table.row.start(a)
mymid <- hyperlink('midmean.htm', 'Midmean', 'click to view the definition of the Midmean')
mylabel <- paste(mymid,hyperlink('method_8.htm','MS Excel (old versions)',''),sep=' - ')
a<-table.element(a,mylabel,header=TRUE)
a<-table.element(a,midm[8])
a<-table.element(a,'')
a<-table.row.end(a)
a<-table.row.start(a)
a<-table.element(a,'Number of observations',header=TRUE)
a<-table.element(a,length(x))
a<-table.element(a,'')
a<-table.row.end(a)
a<-table.end(a)
table.save(a,file='mytable.tab')