Free Statistics

of Irreproducible Research!

Author's title

Author*Unverified author*
R Software Modulerwasp_centraltendency.wasp
Title produced by softwareCentral Tendency
Date of computationSun, 16 Oct 2011 18:41:31 -0400
Cite this page as followsStatistical Computations at FreeStatistics.org, Office for Research Development and Education, URL https://freestatistics.org/blog/index.php?v=date/2011/Oct/16/t1318804952seq7clyfdcf8s2k.htm/, Retrieved Thu, 16 May 2024 16:03:45 +0000
Statistical Computations at FreeStatistics.org, Office for Research Development and Education, URL https://freestatistics.org/blog/index.php?pk=130269, Retrieved Thu, 16 May 2024 16:03:45 +0000
QR Codes:

Original text written by user:
IsPrivate?No (this computation is public)
User-defined keywordsKDG2011W52a
Estimated Impact82
Family? (F = Feedback message, R = changed R code, M = changed R Module, P = changed Parameters, D = changed Data)
-       [Central Tendency] [Goudkoers te Brus...] [2011-10-16 22:41:31] [b7d89a59d057204a66389ee14552eeec] [Current]
Feedback Forum

Post a new message
Dataseries X:
10407
10463
10556
10646
10702
11353
11346
11451
11964
12574
13031
13812
14544
14931
14886
16005
17064
15168
16050
15839
15137
14954
15648
15305
15579
16348
15928
16171
15937
15713
15594
15683
16438
17032
17696
17745
19394
20148
20108
18584
18441
18391
19178
18079
18483
19644
19195
19650
20830
23595
22937
21814
21928
21777
21383
21467
22052
22680
24320
24977
25204
25739
26434
27525
30695
32436
30160
30236
31293
31077
32226
33865


Summary of computational transaction
Raw Inputview raw input (R code)
Raw Outputview raw output of R engine
Computing time2 seconds
R Server'George Udny Yule' @ yule.wessa.net

\begin{tabular}{lllllllll}
\hline
Summary of computational transaction \tabularnewline
Raw Input & view raw input (R code)  \tabularnewline
Raw Output & view raw output of R engine  \tabularnewline
Computing time & 2 seconds \tabularnewline
R Server & 'George Udny Yule' @ yule.wessa.net \tabularnewline
\hline
\end{tabular}
%Source: https://freestatistics.org/blog/index.php?pk=130269&T=0

[TABLE]
[ROW][C]Summary of computational transaction[/C][/ROW]
[ROW][C]Raw Input[/C][C]view raw input (R code) [/C][/ROW]
[ROW][C]Raw Output[/C][C]view raw output of R engine [/C][/ROW]
[ROW][C]Computing time[/C][C]2 seconds[/C][/ROW]
[ROW][C]R Server[/C][C]'George Udny Yule' @ yule.wessa.net[/C][/ROW]
[/TABLE]
Source: https://freestatistics.org/blog/index.php?pk=130269&T=0

Globally Unique Identifier (entire table): ba.freestatistics.org/blog/index.php?pk=130269&T=0

As an alternative you can also use a QR Code:  

The GUIDs for individual cells are displayed in the table below:

Summary of computational transaction
Raw Inputview raw input (R code)
Raw Outputview raw output of R engine
Computing time2 seconds
R Server'George Udny Yule' @ yule.wessa.net


Central Tendency - Ungrouped Data
MeasureValueS.E.Value/S.E.
Arithmetic Mean19106.1805555556709.41845447868426.9321730142976
Geometric Mean18229.64348271
Harmonic Mean17412.7939284588
Quadratic Mean20019.4562367185
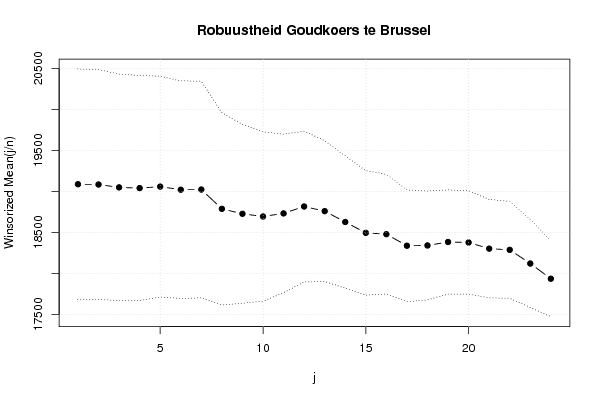
Winsorized Mean ( 1 / 24 )19087.1111111111703.72408753389527.1230038153153
Winsorized Mean ( 2 / 24 )19083.8611111111701.73144747559627.1953910285242
Winsorized Mean ( 3 / 24 )19048.7361111111691.10987063105127.5625293757095
Winsorized Mean ( 4 / 24 )19039.8472222222687.60119632508327.6902473759231
Winsorized Mean ( 5 / 24 )19058.0416666667673.6767469091528.2895940139029
Winsorized Mean ( 6 / 24 )19020.375664.3813480823928.6287010538431
Winsorized Mean ( 7 / 24 )19022.5138888889661.08346271591928.7747538120815
Winsorized Mean ( 8 / 24 )18786.7361111111586.10165086438132.0537164217239
Winsorized Mean ( 9 / 24 )18726.6111111111545.88639872344334.3049600702698
Winsorized Mean ( 10 / 24 )18693.5555555556517.08059251765336.1521121195771
Winsorized Mean ( 11 / 24 )18731.1388888889483.76313102871538.7196495298379
Winsorized Mean ( 12 / 24 )18815.3055555556459.89372438683640.9122902919398
Winsorized Mean ( 13 / 24 )18758.4305555556429.9215617154543.6322162598839
Winsorized Mean ( 14 / 24 )18626.2083333333403.72221917704546.1361982288251
Winsorized Mean ( 15 / 24 )18493.9166666667379.90966760006748.6797737564691
Winsorized Mean ( 16 / 24 )18477.4722222222365.28906756742850.583151434751
Winsorized Mean ( 17 / 24 )18336.5138888889340.92367570717353.7848063818205
Winsorized Mean ( 18 / 24 )18339.7638888889331.73419670943455.2845141405565
Winsorized Mean ( 19 / 24 )18381.9861111111318.00619420268257.8038618310539
Winsorized Mean ( 20 / 24 )18375.875315.92885565872758.1645983608728
Winsorized Mean ( 21 / 24 )18301.2083333333300.40401651232560.9219828210336
Winsorized Mean ( 22 / 24 )18286.2361111111295.27425813444261.9296657509006
Winsorized Mean ( 23 / 24 )18119.1666666667268.44188018264567.4975404521029
Winsorized Mean ( 24 / 24 )17933.8333333333231.57985842775977.4412483671491
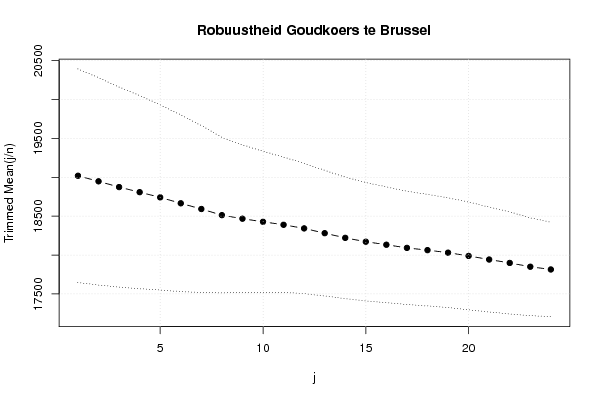
Trimmed Mean ( 1 / 24 )19019.6142857143686.86529709481627.6904574538271
Trimmed Mean ( 2 / 24 )18948.1470588235666.71031465185228.4203598510667
Trimmed Mean ( 3 / 24 )18874.1212121212643.79101291135829.3171554644239
Trimmed Mean ( 4 / 24 )18808.640625621.19035809937430.2783846847654
Trimmed Mean ( 5 / 24 )18741.5161290323595.09459261771431.4933396497382
Trimmed Mean ( 6 / 24 )18665.55567.83427867356132.8714744794943
Trimmed Mean ( 7 / 24 )18592.1379310345537.11642341098434.6147261946753
Trimmed Mean ( 8 / 24 )18513.0892857143499.54528887206737.0598816526032
Trimmed Mean ( 9 / 24 )18467.4814814815474.50098745992938.9197956791208
Trimmed Mean ( 10 / 24 )18427.6153846154453.7847844337640.6087114789661
Trimmed Mean ( 11 / 24 )18389.32434.92827599173542.2812703038637
Trimmed Mean ( 12 / 24 )18342.7083333333418.94009600547443.7836065543215
Trimmed Mean ( 13 / 24 )18281.0652173913403.68685477369245.2852625772016
Trimmed Mean ( 14 / 24 )18220.9772727273390.95177336858146.6067134463383
Trimmed Mean ( 15 / 24 )18171.3571428571380.54611228981847.750736523142
Trimmed Mean ( 16 / 24 )18132.65372.31892268901448.7019297032766
Trimmed Mean ( 17 / 24 )18091.8157894737364.23860033410449.6702320206553
Trimmed Mean ( 18 / 24 )18063.0277777778358.86957326147750.3331269174409
Trimmed Mean ( 19 / 24 )18030.4705882353352.84850595631651.0997504137584
Trimmed Mean ( 20 / 24 )17988.84375346.80434578126651.8702950779797
Trimmed Mean ( 21 / 24 )17942.4337.60643821828553.1459059095284
Trimmed Mean ( 22 / 24 )17898.4642857143328.17401453374254.5395536911836
Trimmed Mean ( 23 / 24 )17849.6538461538314.53900793827356.7486174867595
Trimmed Mean ( 24 / 24 )17814.5303.4529545945758.7059698390519
Median17912
Midrange22136
Midmean - Weighted Average at Xnp17984.7837837838
Midmean - Weighted Average at X(n+1)p18063.0277777778
Midmean - Empirical Distribution Function17984.7837837838
Midmean - Empirical Distribution Function - Averaging18063.0277777778
Midmean - Empirical Distribution Function - Interpolation18063.0277777778
Midmean - Closest Observation17984.7837837838
Midmean - True Basic - Statistics Graphics Toolkit18063.0277777778
Midmean - MS Excel (old versions)18091.8157894737
Number of observations72

\begin{tabular}{lllllllll}
\hline
Central Tendency - Ungrouped Data \tabularnewline
Measure & Value & S.E. & Value/S.E. \tabularnewline
Arithmetic Mean & 19106.1805555556 & 709.418454478684 & 26.9321730142976 \tabularnewline
Geometric Mean & 18229.64348271 &  &  \tabularnewline
Harmonic Mean & 17412.7939284588 &  &  \tabularnewline
Quadratic Mean & 20019.4562367185 &  &  \tabularnewline
Winsorized Mean ( 1 / 24 ) & 19087.1111111111 & 703.724087533895 & 27.1230038153153 \tabularnewline
Winsorized Mean ( 2 / 24 ) & 19083.8611111111 & 701.731447475596 & 27.1953910285242 \tabularnewline
Winsorized Mean ( 3 / 24 ) & 19048.7361111111 & 691.109870631051 & 27.5625293757095 \tabularnewline
Winsorized Mean ( 4 / 24 ) & 19039.8472222222 & 687.601196325083 & 27.6902473759231 \tabularnewline
Winsorized Mean ( 5 / 24 ) & 19058.0416666667 & 673.67674690915 & 28.2895940139029 \tabularnewline
Winsorized Mean ( 6 / 24 ) & 19020.375 & 664.38134808239 & 28.6287010538431 \tabularnewline
Winsorized Mean ( 7 / 24 ) & 19022.5138888889 & 661.083462715919 & 28.7747538120815 \tabularnewline
Winsorized Mean ( 8 / 24 ) & 18786.7361111111 & 586.101650864381 & 32.0537164217239 \tabularnewline
Winsorized Mean ( 9 / 24 ) & 18726.6111111111 & 545.886398723443 & 34.3049600702698 \tabularnewline
Winsorized Mean ( 10 / 24 ) & 18693.5555555556 & 517.080592517653 & 36.1521121195771 \tabularnewline
Winsorized Mean ( 11 / 24 ) & 18731.1388888889 & 483.763131028715 & 38.7196495298379 \tabularnewline
Winsorized Mean ( 12 / 24 ) & 18815.3055555556 & 459.893724386836 & 40.9122902919398 \tabularnewline
Winsorized Mean ( 13 / 24 ) & 18758.4305555556 & 429.92156171545 & 43.6322162598839 \tabularnewline
Winsorized Mean ( 14 / 24 ) & 18626.2083333333 & 403.722219177045 & 46.1361982288251 \tabularnewline
Winsorized Mean ( 15 / 24 ) & 18493.9166666667 & 379.909667600067 & 48.6797737564691 \tabularnewline
Winsorized Mean ( 16 / 24 ) & 18477.4722222222 & 365.289067567428 & 50.583151434751 \tabularnewline
Winsorized Mean ( 17 / 24 ) & 18336.5138888889 & 340.923675707173 & 53.7848063818205 \tabularnewline
Winsorized Mean ( 18 / 24 ) & 18339.7638888889 & 331.734196709434 & 55.2845141405565 \tabularnewline
Winsorized Mean ( 19 / 24 ) & 18381.9861111111 & 318.006194202682 & 57.8038618310539 \tabularnewline
Winsorized Mean ( 20 / 24 ) & 18375.875 & 315.928855658727 & 58.1645983608728 \tabularnewline
Winsorized Mean ( 21 / 24 ) & 18301.2083333333 & 300.404016512325 & 60.9219828210336 \tabularnewline
Winsorized Mean ( 22 / 24 ) & 18286.2361111111 & 295.274258134442 & 61.9296657509006 \tabularnewline
Winsorized Mean ( 23 / 24 ) & 18119.1666666667 & 268.441880182645 & 67.4975404521029 \tabularnewline
Winsorized Mean ( 24 / 24 ) & 17933.8333333333 & 231.579858427759 & 77.4412483671491 \tabularnewline
Trimmed Mean ( 1 / 24 ) & 19019.6142857143 & 686.865297094816 & 27.6904574538271 \tabularnewline
Trimmed Mean ( 2 / 24 ) & 18948.1470588235 & 666.710314651852 & 28.4203598510667 \tabularnewline
Trimmed Mean ( 3 / 24 ) & 18874.1212121212 & 643.791012911358 & 29.3171554644239 \tabularnewline
Trimmed Mean ( 4 / 24 ) & 18808.640625 & 621.190358099374 & 30.2783846847654 \tabularnewline
Trimmed Mean ( 5 / 24 ) & 18741.5161290323 & 595.094592617714 & 31.4933396497382 \tabularnewline
Trimmed Mean ( 6 / 24 ) & 18665.55 & 567.834278673561 & 32.8714744794943 \tabularnewline
Trimmed Mean ( 7 / 24 ) & 18592.1379310345 & 537.116423410984 & 34.6147261946753 \tabularnewline
Trimmed Mean ( 8 / 24 ) & 18513.0892857143 & 499.545288872067 & 37.0598816526032 \tabularnewline
Trimmed Mean ( 9 / 24 ) & 18467.4814814815 & 474.500987459929 & 38.9197956791208 \tabularnewline
Trimmed Mean ( 10 / 24 ) & 18427.6153846154 & 453.78478443376 & 40.6087114789661 \tabularnewline
Trimmed Mean ( 11 / 24 ) & 18389.32 & 434.928275991735 & 42.2812703038637 \tabularnewline
Trimmed Mean ( 12 / 24 ) & 18342.7083333333 & 418.940096005474 & 43.7836065543215 \tabularnewline
Trimmed Mean ( 13 / 24 ) & 18281.0652173913 & 403.686854773692 & 45.2852625772016 \tabularnewline
Trimmed Mean ( 14 / 24 ) & 18220.9772727273 & 390.951773368581 & 46.6067134463383 \tabularnewline
Trimmed Mean ( 15 / 24 ) & 18171.3571428571 & 380.546112289818 & 47.750736523142 \tabularnewline
Trimmed Mean ( 16 / 24 ) & 18132.65 & 372.318922689014 & 48.7019297032766 \tabularnewline
Trimmed Mean ( 17 / 24 ) & 18091.8157894737 & 364.238600334104 & 49.6702320206553 \tabularnewline
Trimmed Mean ( 18 / 24 ) & 18063.0277777778 & 358.869573261477 & 50.3331269174409 \tabularnewline
Trimmed Mean ( 19 / 24 ) & 18030.4705882353 & 352.848505956316 & 51.0997504137584 \tabularnewline
Trimmed Mean ( 20 / 24 ) & 17988.84375 & 346.804345781266 & 51.8702950779797 \tabularnewline
Trimmed Mean ( 21 / 24 ) & 17942.4 & 337.606438218285 & 53.1459059095284 \tabularnewline
Trimmed Mean ( 22 / 24 ) & 17898.4642857143 & 328.174014533742 & 54.5395536911836 \tabularnewline
Trimmed Mean ( 23 / 24 ) & 17849.6538461538 & 314.539007938273 & 56.7486174867595 \tabularnewline
Trimmed Mean ( 24 / 24 ) & 17814.5 & 303.45295459457 & 58.7059698390519 \tabularnewline
Median & 17912 &  &  \tabularnewline
Midrange & 22136 &  &  \tabularnewline
Midmean - Weighted Average at Xnp & 17984.7837837838 &  &  \tabularnewline
Midmean - Weighted Average at X(n+1)p & 18063.0277777778 &  &  \tabularnewline
Midmean - Empirical Distribution Function & 17984.7837837838 &  &  \tabularnewline
Midmean - Empirical Distribution Function - Averaging & 18063.0277777778 &  &  \tabularnewline
Midmean - Empirical Distribution Function - Interpolation & 18063.0277777778 &  &  \tabularnewline
Midmean - Closest Observation & 17984.7837837838 &  &  \tabularnewline
Midmean - True Basic - Statistics Graphics Toolkit & 18063.0277777778 &  &  \tabularnewline
Midmean - MS Excel (old versions) & 18091.8157894737 &  &  \tabularnewline
Number of observations & 72 &  &  \tabularnewline
\hline
\end{tabular}
%Source: https://freestatistics.org/blog/index.php?pk=130269&T=1

[TABLE]
[ROW][C]Central Tendency - Ungrouped Data[/C][/ROW]
[ROW][C]Measure[/C][C]Value[/C][C]S.E.[/C][C]Value/S.E.[/C][/ROW]
[ROW][C]Arithmetic Mean[/C][C]19106.1805555556[/C][C]709.418454478684[/C][C]26.9321730142976[/C][/ROW]
[ROW][C]Geometric Mean[/C][C]18229.64348271[/C][C][/C][C][/C][/ROW]
[ROW][C]Harmonic Mean[/C][C]17412.7939284588[/C][C][/C][C][/C][/ROW]
[ROW][C]Quadratic Mean[/C][C]20019.4562367185[/C][C][/C][C][/C][/ROW]
[ROW][C]Winsorized Mean ( 1 / 24 )[/C][C]19087.1111111111[/C][C]703.724087533895[/C][C]27.1230038153153[/C][/ROW]
[ROW][C]Winsorized Mean ( 2 / 24 )[/C][C]19083.8611111111[/C][C]701.731447475596[/C][C]27.1953910285242[/C][/ROW]
[ROW][C]Winsorized Mean ( 3 / 24 )[/C][C]19048.7361111111[/C][C]691.109870631051[/C][C]27.5625293757095[/C][/ROW]
[ROW][C]Winsorized Mean ( 4 / 24 )[/C][C]19039.8472222222[/C][C]687.601196325083[/C][C]27.6902473759231[/C][/ROW]
[ROW][C]Winsorized Mean ( 5 / 24 )[/C][C]19058.0416666667[/C][C]673.67674690915[/C][C]28.2895940139029[/C][/ROW]
[ROW][C]Winsorized Mean ( 6 / 24 )[/C][C]19020.375[/C][C]664.38134808239[/C][C]28.6287010538431[/C][/ROW]
[ROW][C]Winsorized Mean ( 7 / 24 )[/C][C]19022.5138888889[/C][C]661.083462715919[/C][C]28.7747538120815[/C][/ROW]
[ROW][C]Winsorized Mean ( 8 / 24 )[/C][C]18786.7361111111[/C][C]586.101650864381[/C][C]32.0537164217239[/C][/ROW]
[ROW][C]Winsorized Mean ( 9 / 24 )[/C][C]18726.6111111111[/C][C]545.886398723443[/C][C]34.3049600702698[/C][/ROW]
[ROW][C]Winsorized Mean ( 10 / 24 )[/C][C]18693.5555555556[/C][C]517.080592517653[/C][C]36.1521121195771[/C][/ROW]
[ROW][C]Winsorized Mean ( 11 / 24 )[/C][C]18731.1388888889[/C][C]483.763131028715[/C][C]38.7196495298379[/C][/ROW]
[ROW][C]Winsorized Mean ( 12 / 24 )[/C][C]18815.3055555556[/C][C]459.893724386836[/C][C]40.9122902919398[/C][/ROW]
[ROW][C]Winsorized Mean ( 13 / 24 )[/C][C]18758.4305555556[/C][C]429.92156171545[/C][C]43.6322162598839[/C][/ROW]
[ROW][C]Winsorized Mean ( 14 / 24 )[/C][C]18626.2083333333[/C][C]403.722219177045[/C][C]46.1361982288251[/C][/ROW]
[ROW][C]Winsorized Mean ( 15 / 24 )[/C][C]18493.9166666667[/C][C]379.909667600067[/C][C]48.6797737564691[/C][/ROW]
[ROW][C]Winsorized Mean ( 16 / 24 )[/C][C]18477.4722222222[/C][C]365.289067567428[/C][C]50.583151434751[/C][/ROW]
[ROW][C]Winsorized Mean ( 17 / 24 )[/C][C]18336.5138888889[/C][C]340.923675707173[/C][C]53.7848063818205[/C][/ROW]
[ROW][C]Winsorized Mean ( 18 / 24 )[/C][C]18339.7638888889[/C][C]331.734196709434[/C][C]55.2845141405565[/C][/ROW]
[ROW][C]Winsorized Mean ( 19 / 24 )[/C][C]18381.9861111111[/C][C]318.006194202682[/C][C]57.8038618310539[/C][/ROW]
[ROW][C]Winsorized Mean ( 20 / 24 )[/C][C]18375.875[/C][C]315.928855658727[/C][C]58.1645983608728[/C][/ROW]
[ROW][C]Winsorized Mean ( 21 / 24 )[/C][C]18301.2083333333[/C][C]300.404016512325[/C][C]60.9219828210336[/C][/ROW]
[ROW][C]Winsorized Mean ( 22 / 24 )[/C][C]18286.2361111111[/C][C]295.274258134442[/C][C]61.9296657509006[/C][/ROW]
[ROW][C]Winsorized Mean ( 23 / 24 )[/C][C]18119.1666666667[/C][C]268.441880182645[/C][C]67.4975404521029[/C][/ROW]
[ROW][C]Winsorized Mean ( 24 / 24 )[/C][C]17933.8333333333[/C][C]231.579858427759[/C][C]77.4412483671491[/C][/ROW]
[ROW][C]Trimmed Mean ( 1 / 24 )[/C][C]19019.6142857143[/C][C]686.865297094816[/C][C]27.6904574538271[/C][/ROW]
[ROW][C]Trimmed Mean ( 2 / 24 )[/C][C]18948.1470588235[/C][C]666.710314651852[/C][C]28.4203598510667[/C][/ROW]
[ROW][C]Trimmed Mean ( 3 / 24 )[/C][C]18874.1212121212[/C][C]643.791012911358[/C][C]29.3171554644239[/C][/ROW]
[ROW][C]Trimmed Mean ( 4 / 24 )[/C][C]18808.640625[/C][C]621.190358099374[/C][C]30.2783846847654[/C][/ROW]
[ROW][C]Trimmed Mean ( 5 / 24 )[/C][C]18741.5161290323[/C][C]595.094592617714[/C][C]31.4933396497382[/C][/ROW]
[ROW][C]Trimmed Mean ( 6 / 24 )[/C][C]18665.55[/C][C]567.834278673561[/C][C]32.8714744794943[/C][/ROW]
[ROW][C]Trimmed Mean ( 7 / 24 )[/C][C]18592.1379310345[/C][C]537.116423410984[/C][C]34.6147261946753[/C][/ROW]
[ROW][C]Trimmed Mean ( 8 / 24 )[/C][C]18513.0892857143[/C][C]499.545288872067[/C][C]37.0598816526032[/C][/ROW]
[ROW][C]Trimmed Mean ( 9 / 24 )[/C][C]18467.4814814815[/C][C]474.500987459929[/C][C]38.9197956791208[/C][/ROW]
[ROW][C]Trimmed Mean ( 10 / 24 )[/C][C]18427.6153846154[/C][C]453.78478443376[/C][C]40.6087114789661[/C][/ROW]
[ROW][C]Trimmed Mean ( 11 / 24 )[/C][C]18389.32[/C][C]434.928275991735[/C][C]42.2812703038637[/C][/ROW]
[ROW][C]Trimmed Mean ( 12 / 24 )[/C][C]18342.7083333333[/C][C]418.940096005474[/C][C]43.7836065543215[/C][/ROW]
[ROW][C]Trimmed Mean ( 13 / 24 )[/C][C]18281.0652173913[/C][C]403.686854773692[/C][C]45.2852625772016[/C][/ROW]
[ROW][C]Trimmed Mean ( 14 / 24 )[/C][C]18220.9772727273[/C][C]390.951773368581[/C][C]46.6067134463383[/C][/ROW]
[ROW][C]Trimmed Mean ( 15 / 24 )[/C][C]18171.3571428571[/C][C]380.546112289818[/C][C]47.750736523142[/C][/ROW]
[ROW][C]Trimmed Mean ( 16 / 24 )[/C][C]18132.65[/C][C]372.318922689014[/C][C]48.7019297032766[/C][/ROW]
[ROW][C]Trimmed Mean ( 17 / 24 )[/C][C]18091.8157894737[/C][C]364.238600334104[/C][C]49.6702320206553[/C][/ROW]
[ROW][C]Trimmed Mean ( 18 / 24 )[/C][C]18063.0277777778[/C][C]358.869573261477[/C][C]50.3331269174409[/C][/ROW]
[ROW][C]Trimmed Mean ( 19 / 24 )[/C][C]18030.4705882353[/C][C]352.848505956316[/C][C]51.0997504137584[/C][/ROW]
[ROW][C]Trimmed Mean ( 20 / 24 )[/C][C]17988.84375[/C][C]346.804345781266[/C][C]51.8702950779797[/C][/ROW]
[ROW][C]Trimmed Mean ( 21 / 24 )[/C][C]17942.4[/C][C]337.606438218285[/C][C]53.1459059095284[/C][/ROW]
[ROW][C]Trimmed Mean ( 22 / 24 )[/C][C]17898.4642857143[/C][C]328.174014533742[/C][C]54.5395536911836[/C][/ROW]
[ROW][C]Trimmed Mean ( 23 / 24 )[/C][C]17849.6538461538[/C][C]314.539007938273[/C][C]56.7486174867595[/C][/ROW]
[ROW][C]Trimmed Mean ( 24 / 24 )[/C][C]17814.5[/C][C]303.45295459457[/C][C]58.7059698390519[/C][/ROW]
[ROW][C]Median[/C][C]17912[/C][C][/C][C][/C][/ROW]
[ROW][C]Midrange[/C][C]22136[/C][C][/C][C][/C][/ROW]
[ROW][C]Midmean - Weighted Average at Xnp[/C][C]17984.7837837838[/C][C][/C][C][/C][/ROW]
[ROW][C]Midmean - Weighted Average at X(n+1)p[/C][C]18063.0277777778[/C][C][/C][C][/C][/ROW]
[ROW][C]Midmean - Empirical Distribution Function[/C][C]17984.7837837838[/C][C][/C][C][/C][/ROW]
[ROW][C]Midmean - Empirical Distribution Function - Averaging[/C][C]18063.0277777778[/C][C][/C][C][/C][/ROW]
[ROW][C]Midmean - Empirical Distribution Function - Interpolation[/C][C]18063.0277777778[/C][C][/C][C][/C][/ROW]
[ROW][C]Midmean - Closest Observation[/C][C]17984.7837837838[/C][C][/C][C][/C][/ROW]
[ROW][C]Midmean - True Basic - Statistics Graphics Toolkit[/C][C]18063.0277777778[/C][C][/C][C][/C][/ROW]
[ROW][C]Midmean - MS Excel (old versions)[/C][C]18091.8157894737[/C][C][/C][C][/C][/ROW]
[ROW][C]Number of observations[/C][C]72[/C][C][/C][C][/C][/ROW]
[/TABLE]
Source: https://freestatistics.org/blog/index.php?pk=130269&T=1

Globally Unique Identifier (entire table): ba.freestatistics.org/blog/index.php?pk=130269&T=1

As an alternative you can also use a QR Code:  

The GUIDs for individual cells are displayed in the table below:

Central Tendency - Ungrouped Data
MeasureValueS.E.Value/S.E.
Arithmetic Mean19106.1805555556709.41845447868426.9321730142976
Geometric Mean18229.64348271
Harmonic Mean17412.7939284588
Quadratic Mean20019.4562367185
Winsorized Mean ( 1 / 24 )19087.1111111111703.72408753389527.1230038153153
Winsorized Mean ( 2 / 24 )19083.8611111111701.73144747559627.1953910285242
Winsorized Mean ( 3 / 24 )19048.7361111111691.10987063105127.5625293757095
Winsorized Mean ( 4 / 24 )19039.8472222222687.60119632508327.6902473759231
Winsorized Mean ( 5 / 24 )19058.0416666667673.6767469091528.2895940139029
Winsorized Mean ( 6 / 24 )19020.375664.3813480823928.6287010538431
Winsorized Mean ( 7 / 24 )19022.5138888889661.08346271591928.7747538120815
Winsorized Mean ( 8 / 24 )18786.7361111111586.10165086438132.0537164217239
Winsorized Mean ( 9 / 24 )18726.6111111111545.88639872344334.3049600702698
Winsorized Mean ( 10 / 24 )18693.5555555556517.08059251765336.1521121195771
Winsorized Mean ( 11 / 24 )18731.1388888889483.76313102871538.7196495298379
Winsorized Mean ( 12 / 24 )18815.3055555556459.89372438683640.9122902919398
Winsorized Mean ( 13 / 24 )18758.4305555556429.9215617154543.6322162598839
Winsorized Mean ( 14 / 24 )18626.2083333333403.72221917704546.1361982288251
Winsorized Mean ( 15 / 24 )18493.9166666667379.90966760006748.6797737564691
Winsorized Mean ( 16 / 24 )18477.4722222222365.28906756742850.583151434751
Winsorized Mean ( 17 / 24 )18336.5138888889340.92367570717353.7848063818205
Winsorized Mean ( 18 / 24 )18339.7638888889331.73419670943455.2845141405565
Winsorized Mean ( 19 / 24 )18381.9861111111318.00619420268257.8038618310539
Winsorized Mean ( 20 / 24 )18375.875315.92885565872758.1645983608728
Winsorized Mean ( 21 / 24 )18301.2083333333300.40401651232560.9219828210336
Winsorized Mean ( 22 / 24 )18286.2361111111295.27425813444261.9296657509006
Winsorized Mean ( 23 / 24 )18119.1666666667268.44188018264567.4975404521029
Winsorized Mean ( 24 / 24 )17933.8333333333231.57985842775977.4412483671491
Trimmed Mean ( 1 / 24 )19019.6142857143686.86529709481627.6904574538271
Trimmed Mean ( 2 / 24 )18948.1470588235666.71031465185228.4203598510667
Trimmed Mean ( 3 / 24 )18874.1212121212643.79101291135829.3171554644239
Trimmed Mean ( 4 / 24 )18808.640625621.19035809937430.2783846847654
Trimmed Mean ( 5 / 24 )18741.5161290323595.09459261771431.4933396497382
Trimmed Mean ( 6 / 24 )18665.55567.83427867356132.8714744794943
Trimmed Mean ( 7 / 24 )18592.1379310345537.11642341098434.6147261946753
Trimmed Mean ( 8 / 24 )18513.0892857143499.54528887206737.0598816526032
Trimmed Mean ( 9 / 24 )18467.4814814815474.50098745992938.9197956791208
Trimmed Mean ( 10 / 24 )18427.6153846154453.7847844337640.6087114789661
Trimmed Mean ( 11 / 24 )18389.32434.92827599173542.2812703038637
Trimmed Mean ( 12 / 24 )18342.7083333333418.94009600547443.7836065543215
Trimmed Mean ( 13 / 24 )18281.0652173913403.68685477369245.2852625772016
Trimmed Mean ( 14 / 24 )18220.9772727273390.95177336858146.6067134463383
Trimmed Mean ( 15 / 24 )18171.3571428571380.54611228981847.750736523142
Trimmed Mean ( 16 / 24 )18132.65372.31892268901448.7019297032766
Trimmed Mean ( 17 / 24 )18091.8157894737364.23860033410449.6702320206553
Trimmed Mean ( 18 / 24 )18063.0277777778358.86957326147750.3331269174409
Trimmed Mean ( 19 / 24 )18030.4705882353352.84850595631651.0997504137584
Trimmed Mean ( 20 / 24 )17988.84375346.80434578126651.8702950779797
Trimmed Mean ( 21 / 24 )17942.4337.60643821828553.1459059095284
Trimmed Mean ( 22 / 24 )17898.4642857143328.17401453374254.5395536911836
Trimmed Mean ( 23 / 24 )17849.6538461538314.53900793827356.7486174867595
Trimmed Mean ( 24 / 24 )17814.5303.4529545945758.7059698390519
Median17912
Midrange22136
Midmean - Weighted Average at Xnp17984.7837837838
Midmean - Weighted Average at X(n+1)p18063.0277777778
Midmean - Empirical Distribution Function17984.7837837838
Midmean - Empirical Distribution Function - Averaging18063.0277777778
Midmean - Empirical Distribution Function - Interpolation18063.0277777778
Midmean - Closest Observation17984.7837837838
Midmean - True Basic - Statistics Graphics Toolkit18063.0277777778
Midmean - MS Excel (old versions)18091.8157894737
Number of observations72


Parameters (Session):
Parameters (R input):
R code (references can be found in the software module):
geomean <- function(x) {
return(exp(mean(log(x))))
}
harmean <- function(x) {
return(1/mean(1/x))
}
quamean <- function(x) {
return(sqrt(mean(x*x)))
}
winmean <- function(x) {
x <-sort(x[!is.na(x)])
n<-length(x)
denom <- 3
nodenom <- n/denom
if (nodenom>40) denom <- n/40
sqrtn = sqrt(n)
roundnodenom = floor(nodenom)
win <- array(NA,dim=c(roundnodenom,2))
for (j in 1:roundnodenom) {
win[j,1] <- (j*x[j+1]+sum(x[(j+1):(n-j)])+j*x[n-j])/n
win[j,2] <- sd(c(rep(x[j+1],j),x[(j+1):(n-j)],rep(x[n-j],j)))/sqrtn
}
return(win)
}
trimean <- function(x) {
x <-sort(x[!is.na(x)])
n<-length(x)
denom <- 3
nodenom <- n/denom
if (nodenom>40) denom <- n/40
sqrtn = sqrt(n)
roundnodenom = floor(nodenom)
tri <- array(NA,dim=c(roundnodenom,2))
for (j in 1:roundnodenom) {
tri[j,1] <- mean(x,trim=j/n)
tri[j,2] <- sd(x[(j+1):(n-j)]) / sqrt(n-j*2)
}
return(tri)
}
midrange <- function(x) {
return((max(x)+min(x))/2)
}
q1 <- function(data,n,p,i,f) {
np <- n*p;
i <<- floor(np)
f <<- np - i
qvalue <- (1-f)*data[i] + f*data[i+1]
}
q2 <- function(data,n,p,i,f) {
np <- (n+1)*p
i <<- floor(np)
f <<- np - i
qvalue <- (1-f)*data[i] + f*data[i+1]
}
q3 <- function(data,n,p,i,f) {
np <- n*p
i <<- floor(np)
f <<- np - i
if (f==0) {
qvalue <- data[i]
} else {
qvalue <- data[i+1]
}
}
q4 <- function(data,n,p,i,f) {
np <- n*p
i <<- floor(np)
f <<- np - i
if (f==0) {
qvalue <- (data[i]+data[i+1])/2
} else {
qvalue <- data[i+1]
}
}
q5 <- function(data,n,p,i,f) {
np <- (n-1)*p
i <<- floor(np)
f <<- np - i
if (f==0) {
qvalue <- data[i+1]
} else {
qvalue <- data[i+1] + f*(data[i+2]-data[i+1])
}
}
q6 <- function(data,n,p,i,f) {
np <- n*p+0.5
i <<- floor(np)
f <<- np - i
qvalue <- data[i]
}
q7 <- function(data,n,p,i,f) {
np <- (n+1)*p
i <<- floor(np)
f <<- np - i
if (f==0) {
qvalue <- data[i]
} else {
qvalue <- f*data[i] + (1-f)*data[i+1]
}
}
q8 <- function(data,n,p,i,f) {
np <- (n+1)*p
i <<- floor(np)
f <<- np - i
if (f==0) {
qvalue <- data[i]
} else {
if (f == 0.5) {
qvalue <- (data[i]+data[i+1])/2
} else {
if (f < 0.5) {
qvalue <- data[i]
} else {
qvalue <- data[i+1]
}
}
}
}
midmean <- function(x,def) {
x <-sort(x[!is.na(x)])
n<-length(x)
if (def==1) {
qvalue1 <- q1(x,n,0.25,i,f)
qvalue3 <- q1(x,n,0.75,i,f)
}
if (def==2) {
qvalue1 <- q2(x,n,0.25,i,f)
qvalue3 <- q2(x,n,0.75,i,f)
}
if (def==3) {
qvalue1 <- q3(x,n,0.25,i,f)
qvalue3 <- q3(x,n,0.75,i,f)
}
if (def==4) {
qvalue1 <- q4(x,n,0.25,i,f)
qvalue3 <- q4(x,n,0.75,i,f)
}
if (def==5) {
qvalue1 <- q5(x,n,0.25,i,f)
qvalue3 <- q5(x,n,0.75,i,f)
}
if (def==6) {
qvalue1 <- q6(x,n,0.25,i,f)
qvalue3 <- q6(x,n,0.75,i,f)
}
if (def==7) {
qvalue1 <- q7(x,n,0.25,i,f)
qvalue3 <- q7(x,n,0.75,i,f)
}
if (def==8) {
qvalue1 <- q8(x,n,0.25,i,f)
qvalue3 <- q8(x,n,0.75,i,f)
}
midm <- 0
myn <- 0
roundno4 <- round(n/4)
round3no4 <- round(3*n/4)
for (i in 1:n) {
if ((x[i]>=qvalue1) & (x[i]<=qvalue3)){
midm = midm + x[i]
myn = myn + 1
}
}
midm = midm / myn
return(midm)
}
(arm <- mean(x))
sqrtn <- sqrt(length(x))
(armse <- sd(x) / sqrtn)
(armose <- arm / armse)
(geo <- geomean(x))
(har <- harmean(x))
(qua <- quamean(x))
(win <- winmean(x))
(tri <- trimean(x))
(midr <- midrange(x))
midm <- array(NA,dim=8)
for (j in 1:8) midm[j] <- midmean(x,j)
midm
bitmap(file='test1.png')
lb <- win[,1] - 2*win[,2]
ub <- win[,1] + 2*win[,2]
if ((ylimmin == '') | (ylimmax == '')) plot(win[,1],type='b',main=main, xlab='j', pch=19, ylab='Winsorized Mean(j/n)', ylim=c(min(lb),max(ub))) else plot(win[,1],type='l',main=main, xlab='j', pch=19, ylab='Winsorized Mean(j/n)', ylim=c(ylimmin,ylimmax))
lines(ub,lty=3)
lines(lb,lty=3)
grid()
dev.off()
bitmap(file='test2.png')
lb <- tri[,1] - 2*tri[,2]
ub <- tri[,1] + 2*tri[,2]
if ((ylimmin == '') | (ylimmax == '')) plot(tri[,1],type='b',main=main, xlab='j', pch=19, ylab='Trimmed Mean(j/n)', ylim=c(min(lb),max(ub))) else plot(tri[,1],type='l',main=main, xlab='j', pch=19, ylab='Trimmed Mean(j/n)', ylim=c(ylimmin,ylimmax))
lines(ub,lty=3)
lines(lb,lty=3)
grid()
dev.off()
load(file='createtable')
a<-table.start()
a<-table.row.start(a)
a<-table.element(a,'Central Tendency - Ungrouped Data',4,TRUE)
a<-table.row.end(a)
a<-table.row.start(a)
a<-table.element(a,'Measure',header=TRUE)
a<-table.element(a,'Value',header=TRUE)
a<-table.element(a,'S.E.',header=TRUE)
a<-table.element(a,'Value/S.E.',header=TRUE)
a<-table.row.end(a)
a<-table.row.start(a)
a<-table.element(a,hyperlink('arithmetic_mean.htm', 'Arithmetic Mean', 'click to view the definition of the Arithmetic Mean'),header=TRUE)
a<-table.element(a,arm)
a<-table.element(a,hyperlink('arithmetic_mean_standard_error.htm', armse, 'click to view the definition of the Standard Error of the Arithmetic Mean'))
a<-table.element(a,armose)
a<-table.row.end(a)
a<-table.row.start(a)
a<-table.element(a,hyperlink('geometric_mean.htm', 'Geometric Mean', 'click to view the definition of the Geometric Mean'),header=TRUE)
a<-table.element(a,geo)
a<-table.element(a,'')
a<-table.row.end(a)
a<-table.row.start(a)
a<-table.element(a,hyperlink('harmonic_mean.htm', 'Harmonic Mean', 'click to view the definition of the Harmonic Mean'),header=TRUE)
a<-table.element(a,har)
a<-table.element(a,'')
a<-table.row.end(a)
a<-table.row.start(a)
a<-table.element(a,hyperlink('quadratic_mean.htm', 'Quadratic Mean', 'click to view the definition of the Quadratic Mean'),header=TRUE)
a<-table.element(a,qua)
a<-table.element(a,'')
a<-table.row.end(a)
for (j in 1:length(win[,1])) {
a<-table.row.start(a)
mylabel <- paste('Winsorized Mean (',j)
mylabel <- paste(mylabel,'/')
mylabel <- paste(mylabel,length(win[,1]))
mylabel <- paste(mylabel,')')
a<-table.element(a,hyperlink('winsorized_mean.htm', mylabel, 'click to view the definition of the Winsorized Mean'),header=TRUE)
a<-table.element(a,win[j,1])
a<-table.element(a,win[j,2])
a<-table.element(a,win[j,1]/win[j,2])
a<-table.row.end(a)
}
for (j in 1:length(tri[,1])) {
a<-table.row.start(a)
mylabel <- paste('Trimmed Mean (',j)
mylabel <- paste(mylabel,'/')
mylabel <- paste(mylabel,length(tri[,1]))
mylabel <- paste(mylabel,')')
a<-table.element(a,hyperlink('arithmetic_mean.htm', mylabel, 'click to view the definition of the Trimmed Mean'),header=TRUE)
a<-table.element(a,tri[j,1])
a<-table.element(a,tri[j,2])
a<-table.element(a,tri[j,1]/tri[j,2])
a<-table.row.end(a)
}
a<-table.row.start(a)
a<-table.element(a,hyperlink('median_1.htm', 'Median', 'click to view the definition of the Median'),header=TRUE)
a<-table.element(a,median(x))
a<-table.element(a,'')
a<-table.row.end(a)
a<-table.row.start(a)
a<-table.element(a,hyperlink('midrange.htm', 'Midrange', 'click to view the definition of the Midrange'),header=TRUE)
a<-table.element(a,midr)
a<-table.element(a,'')
a<-table.row.end(a)
a<-table.row.start(a)
mymid <- hyperlink('midmean.htm', 'Midmean', 'click to view the definition of the Midmean')
mylabel <- paste(mymid,hyperlink('method_1.htm','Weighted Average at Xnp',''),sep=' - ')
a<-table.element(a,mylabel,header=TRUE)
a<-table.element(a,midm[1])
a<-table.element(a,'')
a<-table.row.end(a)
a<-table.row.start(a)
mymid <- hyperlink('midmean.htm', 'Midmean', 'click to view the definition of the Midmean')
mylabel <- paste(mymid,hyperlink('method_2.htm','Weighted Average at X(n+1)p',''),sep=' - ')
a<-table.element(a,mylabel,header=TRUE)
a<-table.element(a,midm[2])
a<-table.element(a,'')
a<-table.row.end(a)
a<-table.row.start(a)
mymid <- hyperlink('midmean.htm', 'Midmean', 'click to view the definition of the Midmean')
mylabel <- paste(mymid,hyperlink('method_3.htm','Empirical Distribution Function',''),sep=' - ')
a<-table.element(a,mylabel,header=TRUE)
a<-table.element(a,midm[3])
a<-table.element(a,'')
a<-table.row.end(a)
a<-table.row.start(a)
mymid <- hyperlink('midmean.htm', 'Midmean', 'click to view the definition of the Midmean')
mylabel <- paste(mymid,hyperlink('method_4.htm','Empirical Distribution Function - Averaging',''),sep=' - ')
a<-table.element(a,mylabel,header=TRUE)
a<-table.element(a,midm[4])
a<-table.element(a,'')
a<-table.row.end(a)
a<-table.row.start(a)
mymid <- hyperlink('midmean.htm', 'Midmean', 'click to view the definition of the Midmean')
mylabel <- paste(mymid,hyperlink('method_5.htm','Empirical Distribution Function - Interpolation',''),sep=' - ')
a<-table.element(a,mylabel,header=TRUE)
a<-table.element(a,midm[5])
a<-table.element(a,'')
a<-table.row.end(a)
a<-table.row.start(a)
mymid <- hyperlink('midmean.htm', 'Midmean', 'click to view the definition of the Midmean')
mylabel <- paste(mymid,hyperlink('method_6.htm','Closest Observation',''),sep=' - ')
a<-table.element(a,mylabel,header=TRUE)
a<-table.element(a,midm[6])
a<-table.element(a,'')
a<-table.row.end(a)
a<-table.row.start(a)
mymid <- hyperlink('midmean.htm', 'Midmean', 'click to view the definition of the Midmean')
mylabel <- paste(mymid,hyperlink('method_7.htm','True Basic - Statistics Graphics Toolkit',''),sep=' - ')
a<-table.element(a,mylabel,header=TRUE)
a<-table.element(a,midm[7])
a<-table.element(a,'')
a<-table.row.end(a)
a<-table.row.start(a)
mymid <- hyperlink('midmean.htm', 'Midmean', 'click to view the definition of the Midmean')
mylabel <- paste(mymid,hyperlink('method_8.htm','MS Excel (old versions)',''),sep=' - ')
a<-table.element(a,mylabel,header=TRUE)
a<-table.element(a,midm[8])
a<-table.element(a,'')
a<-table.row.end(a)
a<-table.row.start(a)
a<-table.element(a,'Number of observations',header=TRUE)
a<-table.element(a,length(x))
a<-table.element(a,'')
a<-table.row.end(a)
a<-table.end(a)
table.save(a,file='mytable.tab')