Free Statistics

of Irreproducible Research!

Author's title

Author*Unverified author*
R Software Modulerwasp_histogram.wasp
Title produced by softwareHistogram
Date of computationSat, 15 Oct 2011 22:19:00 -0400
Cite this page as followsStatistical Computations at FreeStatistics.org, Office for Research Development and Education, URL https://freestatistics.org/blog/index.php?v=date/2011/Oct/15/t1318731910u5x0jxrsy49v6uj.htm/, Retrieved Thu, 16 May 2024 00:41:20 +0000
Statistical Computations at FreeStatistics.org, Office for Research Development and Education, URL https://freestatistics.org/blog/index.php?pk=129931, Retrieved Thu, 16 May 2024 00:41:20 +0000
QR Codes:

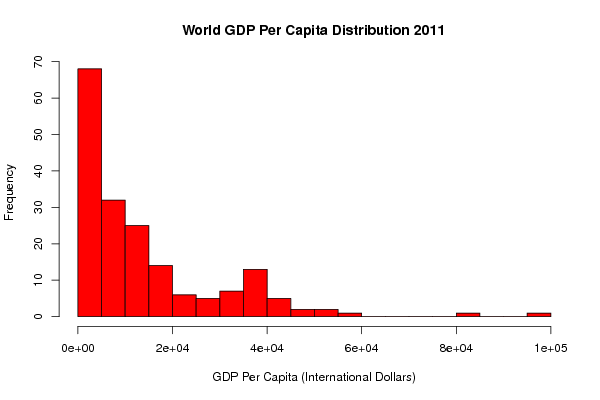
Original text written by user:Sources http://www.newsneconomics.com/2010/01/world-income-distributions-not-normal.html https://www.cia.gov/library/publications/the-world-factbook/rankorder/2119rank.html Calculations are based on estimated populations and GDP per capita data for 182 countries. Raw data describes average GDP per capita for each country and the corresponding population estimate.
IsPrivate?No (this computation is public)
User-defined keywordsGDP Per Capita, Wealth Distribution, World GDP Per Capita, 2011 GDP Per Capita
Estimated Impact108
Family? (F = Feedback message, R = changed R code, M = changed R Module, P = changed Parameters, D = changed Data)
-       [Histogram] [World GDP Per Cap...] [2011-10-16 02:19:00] [d41d8cd98f00b204e9800998ecf8427e] [Current]
Feedback Forum

Post a new message
Dataseries X:
9.877
366.039
419.143
427.905
501.518
739.59
783.497
800.607
801.108
860.167
940.289
995.236
996.838
1025.529
1035.326
1083.42
1194.72
1204.083
1257.839
1305.391
1309.826
1320.579
1382.331
1405.615
1434.516
1526.671
1578.684
1632.267
1696.234
1729.52
1772.581
1774.579
1856.344
1902.466
1979.525
1991.965
2230.159
2247.297
2267.026
2292.01
2292.278
2369.351
2400.296
2512.111
2568.291
2676.632
2701.316
2727.441
2848.67
2900.615
2953.187
3051.192
3229.79
3290.98
3354.077
3752.025
3896.176
3932.587
3969.586
4291.648
4340.245
4572.873
4579.963
4648.801
4725.585
4852.104
4900.06
4955.072
5021.405
5172.593
5185.719
5248.463
5336.012
5404.867
5596.047
5942.952
6055.384
6313.989
6636.357
6642.545
6676.467
6964.026
7109.219
7211.087
7386.55
7496.07
7745.115
7774.204
7985.211
7990.4
8015.194
8015.525
8727.758
8750.61
8996.103
9049.184
9131.789
9382.888
9716.912
9917.963
10588.346
10599.639
10818.928
11117.894
11191.645
11255.839
11301.699
11327.33
11342.183
11638.818
11762.594
12164.469
12363.141
12622.35
12633.151
12816.683
13389.071
13404.741
13488.734
14046.596
14274.844
14392.045
14447.835
14806.503
14850.309
15143.559
15258.171
15489.266
15626.999
15901.515
16270.493
16370.634
16526.998
18279.577
18431.239
18949.059
19588.612
19652.141
19705.722
21535.745
22000.113
22699.933
23960.68
24589.337
24870.627
26074.393
27642.99
28076.145
28225.332
29743.507
30037.405
30041.815
30566.317
31052.639
31293.891
31865.489
32588.615
35257.712
35333.269
35967.974
36369.799
37101.771
37145.878
37191.617
37941.408
38049.884
38532.16
39318.483
39460.31
39770.684
40604.925
40681.235
40847.188
41091.324
44759.545
46421.093
48918.412
50513.53
53399.867
55893.043
80724.846
98337.052


Summary of computational transaction
Raw Inputview raw input (R code)
Raw Outputview raw output of R engine
Computing time1 seconds
R Server'Herman Ole Andreas Wold' @ wold.wessa.net

\begin{tabular}{lllllllll}
\hline
Summary of computational transaction \tabularnewline
Raw Input & view raw input (R code)  \tabularnewline
Raw Output & view raw output of R engine  \tabularnewline
Computing time & 1 seconds \tabularnewline
R Server & 'Herman Ole Andreas Wold' @ wold.wessa.net \tabularnewline
\hline
\end{tabular}
%Source: https://freestatistics.org/blog/index.php?pk=129931&T=0

[TABLE]
[ROW][C]Summary of computational transaction[/C][/ROW]
[ROW][C]Raw Input[/C][C]view raw input (R code) [/C][/ROW]
[ROW][C]Raw Output[/C][C]view raw output of R engine [/C][/ROW]
[ROW][C]Computing time[/C][C]1 seconds[/C][/ROW]
[ROW][C]R Server[/C][C]'Herman Ole Andreas Wold' @ wold.wessa.net[/C][/ROW]
[/TABLE]
Source: https://freestatistics.org/blog/index.php?pk=129931&T=0

Globally Unique Identifier (entire table): ba.freestatistics.org/blog/index.php?pk=129931&T=0

As an alternative you can also use a QR Code:  

The GUIDs for individual cells are displayed in the table below:

Summary of computational transaction
Raw Inputview raw input (R code)
Raw Outputview raw output of R engine
Computing time1 seconds
R Server'Herman Ole Andreas Wold' @ wold.wessa.net


Frequency Table (Histogram)
BinsMidpointAbs. FrequencyRel. FrequencyCumul. Rel. Freq.Density
[0,5000[2500680.3736260.3736267.5e-05
[5000,10000[7500320.1758240.5494513.5e-05
[10000,15000[12500250.1373630.6868132.7e-05
[15000,20000[17500140.0769230.7637361.5e-05
[20000,25000[2250060.0329670.7967037e-06
[25000,30000[2750050.0274730.8241765e-06
[30000,35000[3250070.0384620.8626378e-06
[35000,40000[37500130.0714290.9340661.4e-05
[40000,45000[4250050.0274730.9615385e-06
[45000,50000[4750020.0109890.9725272e-06
[50000,55000[5250020.0109890.9835162e-06
[55000,60000[5750010.0054950.9890111e-06
[60000,65000[62500000.9890110
[65000,70000[67500000.9890110
[70000,75000[72500000.9890110
[75000,80000[77500000.9890110
[80000,85000[8250010.0054950.9945051e-06
[85000,90000[87500000.9945050
[90000,95000[92500000.9945050
[95000,1e+05]9750010.00549511e-06

\begin{tabular}{lllllllll}
\hline
Frequency Table (Histogram) \tabularnewline
Bins & Midpoint & Abs. Frequency & Rel. Frequency & Cumul. Rel. Freq. & Density \tabularnewline
[0,5000[ & 2500 & 68 & 0.373626 & 0.373626 & 7.5e-05 \tabularnewline
[5000,10000[ & 7500 & 32 & 0.175824 & 0.549451 & 3.5e-05 \tabularnewline
[10000,15000[ & 12500 & 25 & 0.137363 & 0.686813 & 2.7e-05 \tabularnewline
[15000,20000[ & 17500 & 14 & 0.076923 & 0.763736 & 1.5e-05 \tabularnewline
[20000,25000[ & 22500 & 6 & 0.032967 & 0.796703 & 7e-06 \tabularnewline
[25000,30000[ & 27500 & 5 & 0.027473 & 0.824176 & 5e-06 \tabularnewline
[30000,35000[ & 32500 & 7 & 0.038462 & 0.862637 & 8e-06 \tabularnewline
[35000,40000[ & 37500 & 13 & 0.071429 & 0.934066 & 1.4e-05 \tabularnewline
[40000,45000[ & 42500 & 5 & 0.027473 & 0.961538 & 5e-06 \tabularnewline
[45000,50000[ & 47500 & 2 & 0.010989 & 0.972527 & 2e-06 \tabularnewline
[50000,55000[ & 52500 & 2 & 0.010989 & 0.983516 & 2e-06 \tabularnewline
[55000,60000[ & 57500 & 1 & 0.005495 & 0.989011 & 1e-06 \tabularnewline
[60000,65000[ & 62500 & 0 & 0 & 0.989011 & 0 \tabularnewline
[65000,70000[ & 67500 & 0 & 0 & 0.989011 & 0 \tabularnewline
[70000,75000[ & 72500 & 0 & 0 & 0.989011 & 0 \tabularnewline
[75000,80000[ & 77500 & 0 & 0 & 0.989011 & 0 \tabularnewline
[80000,85000[ & 82500 & 1 & 0.005495 & 0.994505 & 1e-06 \tabularnewline
[85000,90000[ & 87500 & 0 & 0 & 0.994505 & 0 \tabularnewline
[90000,95000[ & 92500 & 0 & 0 & 0.994505 & 0 \tabularnewline
[95000,1e+05] & 97500 & 1 & 0.005495 & 1 & 1e-06 \tabularnewline
\hline
\end{tabular}
%Source: https://freestatistics.org/blog/index.php?pk=129931&T=1

[TABLE]
[ROW][C]Frequency Table (Histogram)[/C][/ROW]
[ROW][C]Bins[/C][C]Midpoint[/C][C]Abs. Frequency[/C][C]Rel. Frequency[/C][C]Cumul. Rel. Freq.[/C][C]Density[/C][/ROW]
[ROW][C][0,5000[[/C][C]2500[/C][C]68[/C][C]0.373626[/C][C]0.373626[/C][C]7.5e-05[/C][/ROW]
[ROW][C][5000,10000[[/C][C]7500[/C][C]32[/C][C]0.175824[/C][C]0.549451[/C][C]3.5e-05[/C][/ROW]
[ROW][C][10000,15000[[/C][C]12500[/C][C]25[/C][C]0.137363[/C][C]0.686813[/C][C]2.7e-05[/C][/ROW]
[ROW][C][15000,20000[[/C][C]17500[/C][C]14[/C][C]0.076923[/C][C]0.763736[/C][C]1.5e-05[/C][/ROW]
[ROW][C][20000,25000[[/C][C]22500[/C][C]6[/C][C]0.032967[/C][C]0.796703[/C][C]7e-06[/C][/ROW]
[ROW][C][25000,30000[[/C][C]27500[/C][C]5[/C][C]0.027473[/C][C]0.824176[/C][C]5e-06[/C][/ROW]
[ROW][C][30000,35000[[/C][C]32500[/C][C]7[/C][C]0.038462[/C][C]0.862637[/C][C]8e-06[/C][/ROW]
[ROW][C][35000,40000[[/C][C]37500[/C][C]13[/C][C]0.071429[/C][C]0.934066[/C][C]1.4e-05[/C][/ROW]
[ROW][C][40000,45000[[/C][C]42500[/C][C]5[/C][C]0.027473[/C][C]0.961538[/C][C]5e-06[/C][/ROW]
[ROW][C][45000,50000[[/C][C]47500[/C][C]2[/C][C]0.010989[/C][C]0.972527[/C][C]2e-06[/C][/ROW]
[ROW][C][50000,55000[[/C][C]52500[/C][C]2[/C][C]0.010989[/C][C]0.983516[/C][C]2e-06[/C][/ROW]
[ROW][C][55000,60000[[/C][C]57500[/C][C]1[/C][C]0.005495[/C][C]0.989011[/C][C]1e-06[/C][/ROW]
[ROW][C][60000,65000[[/C][C]62500[/C][C]0[/C][C]0[/C][C]0.989011[/C][C]0[/C][/ROW]
[ROW][C][65000,70000[[/C][C]67500[/C][C]0[/C][C]0[/C][C]0.989011[/C][C]0[/C][/ROW]
[ROW][C][70000,75000[[/C][C]72500[/C][C]0[/C][C]0[/C][C]0.989011[/C][C]0[/C][/ROW]
[ROW][C][75000,80000[[/C][C]77500[/C][C]0[/C][C]0[/C][C]0.989011[/C][C]0[/C][/ROW]
[ROW][C][80000,85000[[/C][C]82500[/C][C]1[/C][C]0.005495[/C][C]0.994505[/C][C]1e-06[/C][/ROW]
[ROW][C][85000,90000[[/C][C]87500[/C][C]0[/C][C]0[/C][C]0.994505[/C][C]0[/C][/ROW]
[ROW][C][90000,95000[[/C][C]92500[/C][C]0[/C][C]0[/C][C]0.994505[/C][C]0[/C][/ROW]
[ROW][C][95000,1e+05][/C][C]97500[/C][C]1[/C][C]0.005495[/C][C]1[/C][C]1e-06[/C][/ROW]
[/TABLE]
Source: https://freestatistics.org/blog/index.php?pk=129931&T=1

Globally Unique Identifier (entire table): ba.freestatistics.org/blog/index.php?pk=129931&T=1

As an alternative you can also use a QR Code:  

The GUIDs for individual cells are displayed in the table below:

Frequency Table (Histogram)
BinsMidpointAbs. FrequencyRel. FrequencyCumul. Rel. Freq.Density
[0,5000[2500680.3736260.3736267.5e-05
[5000,10000[7500320.1758240.5494513.5e-05
[10000,15000[12500250.1373630.6868132.7e-05
[15000,20000[17500140.0769230.7637361.5e-05
[20000,25000[2250060.0329670.7967037e-06
[25000,30000[2750050.0274730.8241765e-06
[30000,35000[3250070.0384620.8626378e-06
[35000,40000[37500130.0714290.9340661.4e-05
[40000,45000[4250050.0274730.9615385e-06
[45000,50000[4750020.0109890.9725272e-06
[50000,55000[5250020.0109890.9835162e-06
[55000,60000[5750010.0054950.9890111e-06
[60000,65000[62500000.9890110
[65000,70000[67500000.9890110
[70000,75000[72500000.9890110
[75000,80000[77500000.9890110
[80000,85000[8250010.0054950.9945051e-06
[85000,90000[87500000.9945050
[90000,95000[92500000.9945050
[95000,1e+05]9750010.00549511e-06


Parameters (Session):
par1 = 30 ; par2 = red ; par3 = FALSE ; par4 = Unknown ;
Parameters (R input):
par1 = 30 ; par2 = red ; par3 = FALSE ; par4 = Unknown ;
R code (references can be found in the software module):
par1 <- as.numeric(par1)
if (par3 == 'TRUE') par3 <- TRUE
if (par3 == 'FALSE') par3 <- FALSE
if (par4 == 'Unknown') par1 <- as.numeric(par1)
if (par4 == 'Interval/Ratio') par1 <- as.numeric(par1)
if (par4 == '3-point Likert') par1 <- c(1:3 - 0.5, 3.5)
if (par4 == '4-point Likert') par1 <- c(1:4 - 0.5, 4.5)
if (par4 == '5-point Likert') par1 <- c(1:5 - 0.5, 5.5)
if (par4 == '6-point Likert') par1 <- c(1:6 - 0.5, 6.5)
if (par4 == '7-point Likert') par1 <- c(1:7 - 0.5, 7.5)
if (par4 == '8-point Likert') par1 <- c(1:8 - 0.5, 8.5)
if (par4 == '9-point Likert') par1 <- c(1:9 - 0.5, 9.5)
if (par4 == '10-point Likert') par1 <- c(1:10 - 0.5, 10.5)
bitmap(file='test1.png')
if(is.numeric(x[1])) {
if (is.na(par1)) {
myhist<-hist(x,col=par2,main=main,xlab=xlab,right=par3)
} else {
if (par1 < 0) par1 <- 3
if (par1 > 50) par1 <- 50
myhist<-hist(x,breaks=par1,col=par2,main=main,xlab=xlab,right=par3)
}
} else {
plot(mytab <- table(x),col=par2,main='Frequency Plot',xlab=xlab,ylab='Absolute Frequency')
}
dev.off()
if(is.numeric(x[1])) {
myhist
n <- length(x)
load(file='createtable')
a<-table.start()
a<-table.row.start(a)
a<-table.element(a,hyperlink('histogram.htm','Frequency Table (Histogram)',''),6,TRUE)
a<-table.row.end(a)
a<-table.row.start(a)
a<-table.element(a,'Bins',header=TRUE)
a<-table.element(a,'Midpoint',header=TRUE)
a<-table.element(a,'Abs. Frequency',header=TRUE)
a<-table.element(a,'Rel. Frequency',header=TRUE)
a<-table.element(a,'Cumul. Rel. Freq.',header=TRUE)
a<-table.element(a,'Density',header=TRUE)
a<-table.row.end(a)
crf <- 0
if (par3 == FALSE) mybracket <- '[' else mybracket <- ']'
mynumrows <- (length(myhist$breaks)-1)
for (i in 1:mynumrows) {
a<-table.row.start(a)
if (i == 1)
dum <- paste('[',myhist$breaks[i],sep='')
else
dum <- paste(mybracket,myhist$breaks[i],sep='')
dum <- paste(dum,myhist$breaks[i+1],sep=',')
if (i==mynumrows)
dum <- paste(dum,']',sep='')
else
dum <- paste(dum,mybracket,sep='')
a<-table.element(a,dum,header=TRUE)
a<-table.element(a,myhist$mids[i])
a<-table.element(a,myhist$counts[i])
rf <- myhist$counts[i]/n
crf <- crf + rf
a<-table.element(a,round(rf,6))
a<-table.element(a,round(crf,6))
a<-table.element(a,round(myhist$density[i],6))
a<-table.row.end(a)
}
a<-table.end(a)
table.save(a,file='mytable.tab')
} else {
mytab
reltab <- mytab / sum(mytab)
n <- length(mytab)
load(file='createtable')
a<-table.start()
a<-table.row.start(a)
a<-table.element(a,'Frequency Table (Categorical Data)',3,TRUE)
a<-table.row.end(a)
a<-table.row.start(a)
a<-table.element(a,'Category',header=TRUE)
a<-table.element(a,'Abs. Frequency',header=TRUE)
a<-table.element(a,'Rel. Frequency',header=TRUE)
a<-table.row.end(a)
for (i in 1:n) {
a<-table.row.start(a)
a<-table.element(a,labels(mytab)$x[i],header=TRUE)
a<-table.element(a,mytab[i])
a<-table.element(a,round(reltab[i],4))
a<-table.row.end(a)
}
a<-table.end(a)
table.save(a,file='mytable1.tab')
}