Free Statistics

of Irreproducible Research!

Author's title

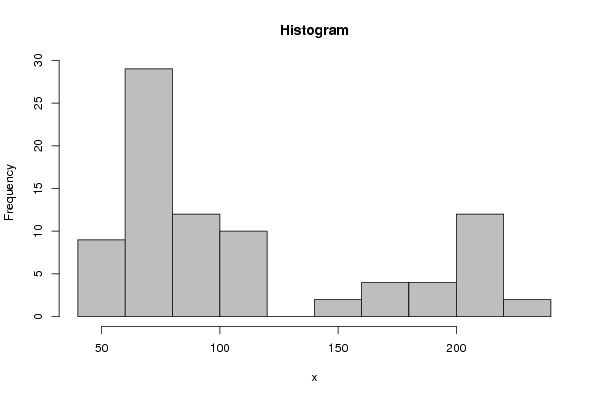
histogram 1, gemiddelde kp van een woonhuis in arrondissement antwerpen van...

Author*Unverified author*
R Software Modulerwasp_histogram.wasp
Title produced by softwareHistogram
Date of computationWed, 05 Oct 2011 05:13:17 -0400
Cite this page as followsStatistical Computations at FreeStatistics.org, Office for Research Development and Education, URL https://freestatistics.org/blog/index.php?v=date/2011/Oct/05/t131780613595eisjli5mgwyus.htm/, Retrieved Wed, 15 May 2024 03:14:47 +0000
Statistical Computations at FreeStatistics.org, Office for Research Development and Education, URL https://freestatistics.org/blog/index.php?pk=126681, Retrieved Wed, 15 May 2024 03:14:47 +0000
QR Codes:

Original text written by user:
IsPrivate?No (this computation is public)
User-defined keywordsKDG2011W2EC
Estimated Impact127
Family? (F = Feedback message, R = changed R code, M = changed R Module, P = changed Parameters, D = changed Data)
-       [Histogram] [histogram 1, gemi...] [2011-10-05 09:13:17] [31886bd2f92a612f059dd2285dd41f3c] [Current]
Feedback Forum

Post a new message
Dataseries X:
49.164
50.112
52.329
52.872
53.008
53.804
57.150
57.863
58.334
60.621
62.084
62.395
61.064
65.989
67.170
68.813
69.255
70.643
73.657
72.723
72.966
75.159
74.414
75.573
70.977
72.291
72.384
74.385
70.977
68.889
71.950
70.463
70.615
72.567
75.962
75.851
75.005
78.635
82.937
80.337
82.336
81.858
83.732
84.158
84.806
86.610
91.300
92.038
99.274
99.292
100.169
103.661
100.427
106.692
108.459
109.815
108.914
111.181
114.572
115.019
149.365
154.780
163.305
168.139
170.969
178.788
184.302
182.706
189.415
192.260
200.070
200.555
203.220
207.325
209.362
205.709
205.752
204.527
208.881
212.113
216.893
219.171
226.970
222.226


Summary of computational transaction
Raw Inputview raw input (R code)
Raw Outputview raw output of R engine
Computing time2 seconds
R Server'George Udny Yule' @ yule.wessa.net

\begin{tabular}{lllllllll}
\hline
Summary of computational transaction \tabularnewline
Raw Input & view raw input (R code)  \tabularnewline
Raw Output & view raw output of R engine  \tabularnewline
Computing time & 2 seconds \tabularnewline
R Server & 'George Udny Yule' @ yule.wessa.net \tabularnewline
\hline
\end{tabular}
%Source: https://freestatistics.org/blog/index.php?pk=126681&T=0

[TABLE]
[ROW][C]Summary of computational transaction[/C][/ROW]
[ROW][C]Raw Input[/C][C]view raw input (R code) [/C][/ROW]
[ROW][C]Raw Output[/C][C]view raw output of R engine [/C][/ROW]
[ROW][C]Computing time[/C][C]2 seconds[/C][/ROW]
[ROW][C]R Server[/C][C]'George Udny Yule' @ yule.wessa.net[/C][/ROW]
[/TABLE]
Source: https://freestatistics.org/blog/index.php?pk=126681&T=0

Globally Unique Identifier (entire table): ba.freestatistics.org/blog/index.php?pk=126681&T=0

As an alternative you can also use a QR Code:  

The GUIDs for individual cells are displayed in the table below:

Summary of computational transaction
Raw Inputview raw input (R code)
Raw Outputview raw output of R engine
Computing time2 seconds
R Server'George Udny Yule' @ yule.wessa.net


Frequency Table (Histogram)
BinsMidpointAbs. FrequencyRel. FrequencyCumul. Rel. Freq.Density
[40,60[5090.1071430.1071430.005357
[60,80[70290.3452380.4523810.017262
[80,100[90120.1428570.5952380.007143
[100,120[110100.1190480.7142860.005952
[120,140[130000.7142860
[140,160[15020.023810.7380950.00119
[160,180[17040.0476190.7857140.002381
[180,200[19040.0476190.8333330.002381
[200,220[210120.1428570.976190.007143
[220,240]23020.0238110.00119

\begin{tabular}{lllllllll}
\hline
Frequency Table (Histogram) \tabularnewline
Bins & Midpoint & Abs. Frequency & Rel. Frequency & Cumul. Rel. Freq. & Density \tabularnewline
[40,60[ & 50 & 9 & 0.107143 & 0.107143 & 0.005357 \tabularnewline
[60,80[ & 70 & 29 & 0.345238 & 0.452381 & 0.017262 \tabularnewline
[80,100[ & 90 & 12 & 0.142857 & 0.595238 & 0.007143 \tabularnewline
[100,120[ & 110 & 10 & 0.119048 & 0.714286 & 0.005952 \tabularnewline
[120,140[ & 130 & 0 & 0 & 0.714286 & 0 \tabularnewline
[140,160[ & 150 & 2 & 0.02381 & 0.738095 & 0.00119 \tabularnewline
[160,180[ & 170 & 4 & 0.047619 & 0.785714 & 0.002381 \tabularnewline
[180,200[ & 190 & 4 & 0.047619 & 0.833333 & 0.002381 \tabularnewline
[200,220[ & 210 & 12 & 0.142857 & 0.97619 & 0.007143 \tabularnewline
[220,240] & 230 & 2 & 0.02381 & 1 & 0.00119 \tabularnewline
\hline
\end{tabular}
%Source: https://freestatistics.org/blog/index.php?pk=126681&T=1

[TABLE]
[ROW][C]Frequency Table (Histogram)[/C][/ROW]
[ROW][C]Bins[/C][C]Midpoint[/C][C]Abs. Frequency[/C][C]Rel. Frequency[/C][C]Cumul. Rel. Freq.[/C][C]Density[/C][/ROW]
[ROW][C][40,60[[/C][C]50[/C][C]9[/C][C]0.107143[/C][C]0.107143[/C][C]0.005357[/C][/ROW]
[ROW][C][60,80[[/C][C]70[/C][C]29[/C][C]0.345238[/C][C]0.452381[/C][C]0.017262[/C][/ROW]
[ROW][C][80,100[[/C][C]90[/C][C]12[/C][C]0.142857[/C][C]0.595238[/C][C]0.007143[/C][/ROW]
[ROW][C][100,120[[/C][C]110[/C][C]10[/C][C]0.119048[/C][C]0.714286[/C][C]0.005952[/C][/ROW]
[ROW][C][120,140[[/C][C]130[/C][C]0[/C][C]0[/C][C]0.714286[/C][C]0[/C][/ROW]
[ROW][C][140,160[[/C][C]150[/C][C]2[/C][C]0.02381[/C][C]0.738095[/C][C]0.00119[/C][/ROW]
[ROW][C][160,180[[/C][C]170[/C][C]4[/C][C]0.047619[/C][C]0.785714[/C][C]0.002381[/C][/ROW]
[ROW][C][180,200[[/C][C]190[/C][C]4[/C][C]0.047619[/C][C]0.833333[/C][C]0.002381[/C][/ROW]
[ROW][C][200,220[[/C][C]210[/C][C]12[/C][C]0.142857[/C][C]0.97619[/C][C]0.007143[/C][/ROW]
[ROW][C][220,240][/C][C]230[/C][C]2[/C][C]0.02381[/C][C]1[/C][C]0.00119[/C][/ROW]
[/TABLE]
Source: https://freestatistics.org/blog/index.php?pk=126681&T=1

Globally Unique Identifier (entire table): ba.freestatistics.org/blog/index.php?pk=126681&T=1

As an alternative you can also use a QR Code:  

The GUIDs for individual cells are displayed in the table below:

Frequency Table (Histogram)
BinsMidpointAbs. FrequencyRel. FrequencyCumul. Rel. Freq.Density
[40,60[5090.1071430.1071430.005357
[60,80[70290.3452380.4523810.017262
[80,100[90120.1428570.5952380.007143
[100,120[110100.1190480.7142860.005952
[120,140[130000.7142860
[140,160[15020.023810.7380950.00119
[160,180[17040.0476190.7857140.002381
[180,200[19040.0476190.8333330.002381
[200,220[210120.1428570.976190.007143
[220,240]23020.0238110.00119


Parameters (Session):
par1 = 10 ; par2 = grey ; par3 = FALSE ; par4 = Unknown ;
Parameters (R input):
par1 = 10 ; par2 = grey ; par3 = FALSE ; par4 = Unknown ;
R code (references can be found in the software module):
par1 <- as.numeric(par1)
if (par3 == 'TRUE') par3 <- TRUE
if (par3 == 'FALSE') par3 <- FALSE
if (par4 == 'Unknown') par1 <- as.numeric(par1)
if (par4 == 'Interval/Ratio') par1 <- as.numeric(par1)
if (par4 == '3-point Likert') par1 <- c(1:3 - 0.5, 3.5)
if (par4 == '4-point Likert') par1 <- c(1:4 - 0.5, 4.5)
if (par4 == '5-point Likert') par1 <- c(1:5 - 0.5, 5.5)
if (par4 == '6-point Likert') par1 <- c(1:6 - 0.5, 6.5)
if (par4 == '7-point Likert') par1 <- c(1:7 - 0.5, 7.5)
if (par4 == '8-point Likert') par1 <- c(1:8 - 0.5, 8.5)
if (par4 == '9-point Likert') par1 <- c(1:9 - 0.5, 9.5)
if (par4 == '10-point Likert') par1 <- c(1:10 - 0.5, 10.5)
bitmap(file='test1.png')
if(is.numeric(x[1])) {
if (is.na(par1)) {
myhist<-hist(x,col=par2,main=main,xlab=xlab,right=par3)
} else {
if (par1 < 0) par1 <- 3
if (par1 > 50) par1 <- 50
myhist<-hist(x,breaks=par1,col=par2,main=main,xlab=xlab,right=par3)
}
} else {
plot(mytab <- table(x),col=par2,main='Frequency Plot',xlab=xlab,ylab='Absolute Frequency')
}
dev.off()
if(is.numeric(x[1])) {
myhist
n <- length(x)
load(file='createtable')
a<-table.start()
a<-table.row.start(a)
a<-table.element(a,hyperlink('histogram.htm','Frequency Table (Histogram)',''),6,TRUE)
a<-table.row.end(a)
a<-table.row.start(a)
a<-table.element(a,'Bins',header=TRUE)
a<-table.element(a,'Midpoint',header=TRUE)
a<-table.element(a,'Abs. Frequency',header=TRUE)
a<-table.element(a,'Rel. Frequency',header=TRUE)
a<-table.element(a,'Cumul. Rel. Freq.',header=TRUE)
a<-table.element(a,'Density',header=TRUE)
a<-table.row.end(a)
crf <- 0
if (par3 == FALSE) mybracket <- '[' else mybracket <- ']'
mynumrows <- (length(myhist$breaks)-1)
for (i in 1:mynumrows) {
a<-table.row.start(a)
if (i == 1)
dum <- paste('[',myhist$breaks[i],sep='')
else
dum <- paste(mybracket,myhist$breaks[i],sep='')
dum <- paste(dum,myhist$breaks[i+1],sep=',')
if (i==mynumrows)
dum <- paste(dum,']',sep='')
else
dum <- paste(dum,mybracket,sep='')
a<-table.element(a,dum,header=TRUE)
a<-table.element(a,myhist$mids[i])
a<-table.element(a,myhist$counts[i])
rf <- myhist$counts[i]/n
crf <- crf + rf
a<-table.element(a,round(rf,6))
a<-table.element(a,round(crf,6))
a<-table.element(a,round(myhist$density[i],6))
a<-table.row.end(a)
}
a<-table.end(a)
table.save(a,file='mytable.tab')
} else {
mytab
reltab <- mytab / sum(mytab)
n <- length(mytab)
load(file='createtable')
a<-table.start()
a<-table.row.start(a)
a<-table.element(a,'Frequency Table (Categorical Data)',3,TRUE)
a<-table.row.end(a)
a<-table.row.start(a)
a<-table.element(a,'Category',header=TRUE)
a<-table.element(a,'Abs. Frequency',header=TRUE)
a<-table.element(a,'Rel. Frequency',header=TRUE)
a<-table.row.end(a)
for (i in 1:n) {
a<-table.row.start(a)
a<-table.element(a,labels(mytab)$x[i],header=TRUE)
a<-table.element(a,mytab[i])
a<-table.element(a,round(reltab[i],4))
a<-table.row.end(a)
}
a<-table.end(a)
table.save(a,file='mytable1.tab')
}