Free Statistics
of Irreproducible Research!
Description of Statistical Computation | |||||||||||||||||||||||||||||||||||||||||||||
|---|---|---|---|---|---|---|---|---|---|---|---|---|---|---|---|---|---|---|---|---|---|---|---|---|---|---|---|---|---|---|---|---|---|---|---|---|---|---|---|---|---|---|---|---|---|
| Author's title | |||||||||||||||||||||||||||||||||||||||||||||
| Author | *Unverified author* | ||||||||||||||||||||||||||||||||||||||||||||
| R Software Module | rwasp_univariatedataseries.wasp | ||||||||||||||||||||||||||||||||||||||||||||
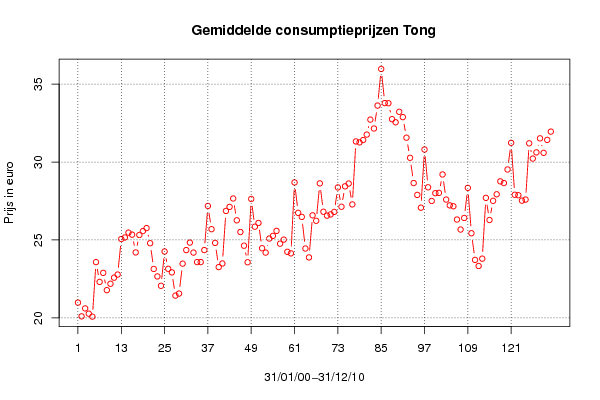
| Title produced by software | Univariate Data Series | ||||||||||||||||||||||||||||||||||||||||||||
| Date of computation | Tue, 04 Oct 2011 11:22:14 -0400 | ||||||||||||||||||||||||||||||||||||||||||||
| Cite this page as follows | Statistical Computations at FreeStatistics.org, Office for Research Development and Education, URL https://freestatistics.org/blog/index.php?v=date/2011/Oct/04/t13177418408y98cldm24pou62.htm/, Retrieved Thu, 16 May 2024 03:49:16 +0000 | ||||||||||||||||||||||||||||||||||||||||||||
| Statistical Computations at FreeStatistics.org, Office for Research Development and Education, URL https://freestatistics.org/blog/index.php?pk=126090, Retrieved Thu, 16 May 2024 03:49:16 +0000 | |||||||||||||||||||||||||||||||||||||||||||||
| QR Codes: | |||||||||||||||||||||||||||||||||||||||||||||
|
| |||||||||||||||||||||||||||||||||||||||||||||
| Original text written by user: | |||||||||||||||||||||||||||||||||||||||||||||
| IsPrivate? | No (this computation is public) | ||||||||||||||||||||||||||||||||||||||||||||
| User-defined keywords | KDG2011W2EC | ||||||||||||||||||||||||||||||||||||||||||||
| Estimated Impact | 71 | ||||||||||||||||||||||||||||||||||||||||||||
Tree of Dependent Computations | |||||||||||||||||||||||||||||||||||||||||||||
| Family? (F = Feedback message, R = changed R code, M = changed R Module, P = changed Parameters, D = changed Data) | |||||||||||||||||||||||||||||||||||||||||||||
| - [Univariate Data Series] [Tong] [2011-09-27 16:12:35] [74f6ba82782ee27f10a153e0e3d780e9] - R D [Univariate Data Series] [Gemiddelde consum...] [2011-10-04 15:22:14] [bd8cebb9d7961275d2f6ed94788b7e5f] [Current] | |||||||||||||||||||||||||||||||||||||||||||||
| Feedback Forum | |||||||||||||||||||||||||||||||||||||||||||||
Post a new message | |||||||||||||||||||||||||||||||||||||||||||||
Dataset | |||||||||||||||||||||||||||||||||||||||||||||
| Dataseries X: | |||||||||||||||||||||||||||||||||||||||||||||
20.98 20.1 20.61 20.27 20.08 23.58 22.31 22.89 21.78 22.19 22.58 22.78 25.06 25.16 25.47 25.34 24.2 25.32 25.57 25.76 24.79 23.14 22.66 22.06 24.26 23.15 22.92 21.43 21.56 23.48 24.35 24.83 24.19 23.58 23.58 24.35 27.18 25.69 24.81 23.26 23.49 26.86 27.12 27.66 26.26 25.51 24.63 23.57 27.63 25.85 26.09 24.47 24.19 25.09 25.26 25.58 24.76 25.02 24.24 24.14 28.69 26.74 26.48 24.45 23.88 26.58 26.23 28.63 26.81 26.56 26.64 26.8 28.37 27.13 28.44 28.62 27.28 31.32 31.26 31.41 31.76 32.72 32.15 33.62 35.97 33.78 33.77 32.75 32.55 33.22 32.88 31.56 30.27 28.65 27.89 27.07 30.8 28.38 27.5 28 28.02 29.2 27.59 27.22 27.16 26.31 25.67 26.41 28.34 25.43 23.72 23.33 23.8 27.7 26.28 27.51 27.93 28.76 28.65 29.52 31.23 27.9 27.87 27.52 27.59 31.2 30.22 30.62 31.52 30.59 31.42 31.95 | |||||||||||||||||||||||||||||||||||||||||||||
Tables (Output of Computation) | |||||||||||||||||||||||||||||||||||||||||||||
| |||||||||||||||||||||||||||||||||||||||||||||
Figures (Output of Computation) | |||||||||||||||||||||||||||||||||||||||||||||
Input Parameters & R Code | |||||||||||||||||||||||||||||||||||||||||||||
| Parameters (Session): | |||||||||||||||||||||||||||||||||||||||||||||
| par1 = Vis ; par2 = Belgostat ; par3 = Tong ; par4 = 12 ; | |||||||||||||||||||||||||||||||||||||||||||||
| Parameters (R input): | |||||||||||||||||||||||||||||||||||||||||||||
| par1 = Vis ; par2 = Belgostat ; par3 = Tong ; par4 = 12 ; | |||||||||||||||||||||||||||||||||||||||||||||
| R code (references can be found in the software module): | |||||||||||||||||||||||||||||||||||||||||||||
if (par4 != 'No season') { | |||||||||||||||||||||||||||||||||||||||||||||