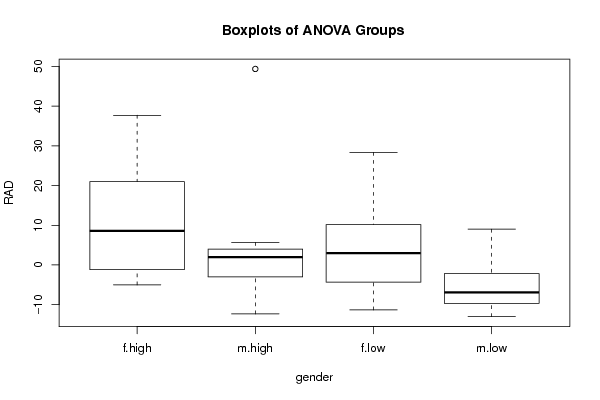
| ANOVA Model | ||||
| xdf2$RAD ~ xdf2$gender * xdf2$BPVT | ||||
| names | (Intercept) | xdf2$genderm | xdf2$BPVTlow | xdf2$genderm:xdf2$BPVTlow |
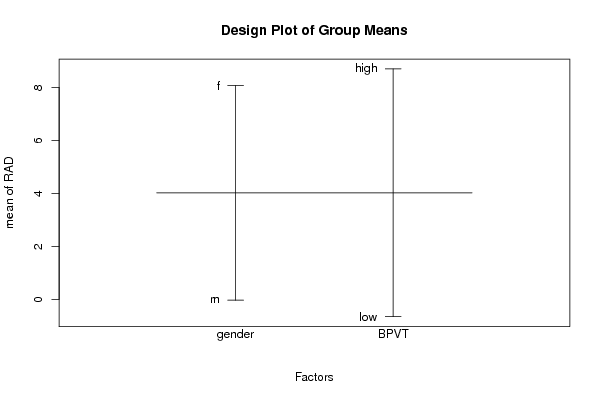
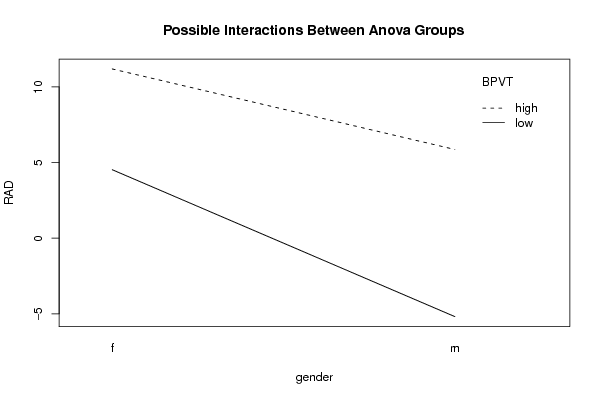
| means | 11.188 | -5.3261 | -6.6604 | -4.3886 |
| ANOVA Statistics | |||||
| Df | Sum Sq | Mean Sq | F value | Pr(>F) | |
| 1 | |||||
| xdf2$gender | 1 | 493.37 | 493.37 | 2.3224 | 0.1396 |
| xdf2$BPVT | 1 | 585.42 | 585.42 | 2.7557 | 0.10893 |
| xdf2$gender:xdf2$BPVT | 1 | 35.951 | 35.951 | 0.16923 | 0.68417 |
| Residuals | 26 | 5523.5 | 212.44 | ||
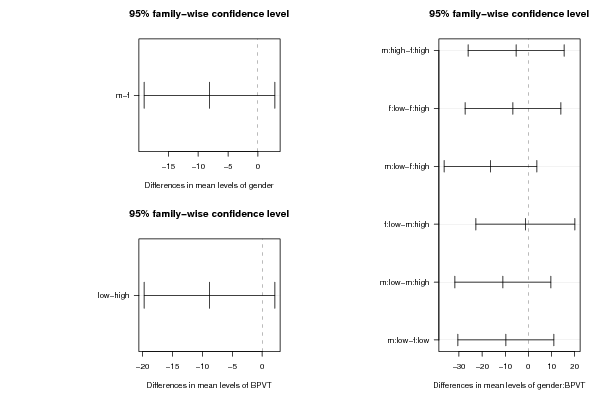
| Tukey Honest Significant Difference Comparisons | ||||
| diff | lwr | upr | p adj | |
| m-f | -8.1107 | -19.051 | 2.8293 | 0.1396 |
| low-high | -8.8153 | -19.755 | 2.1246 | 0.10968 |
| m:high-f:high | -5.3261 | -26.02 | 15.368 | 0.89378 |
| f:low-f:high | -6.6604 | -27.355 | 14.034 | 0.81365 |
| m:low-f:high | -16.375 | -36.368 | 3.6175 | 0.13722 |
| f:low-m:high | -1.3343 | -22.707 | 20.039 | 0.99817 |
| m:low-m:high | -11.049 | -31.743 | 9.6453 | 0.47235 |
| m:low-f:low | -9.7146 | -30.409 | 10.98 | 0.57859 |
| Levenes Test for Homogeneity of Variance | |||
| Df | F value | Pr(>F) | |
| Group | 3 | 0.59544 | 0.62365 |
| 26 | |||