Free Statistics

of Irreproducible Research!

Author's title

Author*Unverified author*
R Software Modulerwasp_autocorrelation.wasp
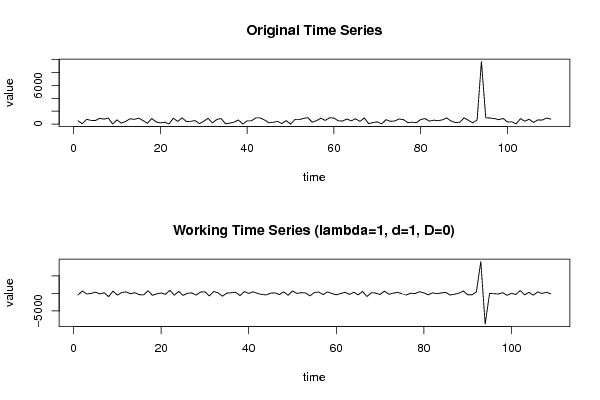
Title produced by software(Partial) Autocorrelation Function
Date of computationFri, 27 May 2011 08:36:10 +0000
Cite this page as followsStatistical Computations at FreeStatistics.org, Office for Research Development and Education, URL https://freestatistics.org/blog/index.php?v=date/2011/May/27/t1306485132tsto0eyl3yqautd.htm/, Retrieved Sun, 12 May 2024 20:51:01 +0000
Statistical Computations at FreeStatistics.org, Office for Research Development and Education, URL https://freestatistics.org/blog/index.php?pk=122514, Retrieved Sun, 12 May 2024 20:51:01 +0000
QR Codes:

Original text written by user:
IsPrivate?No (this computation is public)
User-defined keywordsKDGP2W12
Estimated Impact165
Family? (F = Feedback message, R = changed R code, M = changed R Module, P = changed Parameters, D = changed Data)
-       [(Partial) Autocorrelation Function] [] [2011-05-27 08:36:10] [6e43eada780a1520be8ab5bc59456d41] [Current]
Feedback Forum

Post a new message
Dataseries X:
505,7
55,7
735,7
575,9
545,8
905,8
765,8
945,7
15,7
645,7
155,9
416
825,8
725,9
925,9
556
116,1
876,3
336,2
186,1
286,1
26
915,8
405,7
965,7
395,6
425,8
545,6
65,6
445,6
895,5
175,4
715,4
865,5
57,4
145,4
315,3
635,4
5,2
515,2
515,1
955
955
634,9
205
275
425
84,9
534,7
4,8
704,7
684,7
884,6
994,6
294,7
524,7
914,5
564,4
984,5
934,4
514,6
474,5
784,4
504,5
824,4
414,6
964,7
64,6
244,7
344,7
34,7
685
425
484,8
785,1
704,9
245,4
285,6
218,8
706,1
856,2
456,6
606,8
527,3
657,8
948,2
486,6
238,9
289,4
969,5
589,5
189,7
639,8
9710,1
969,9
939,9
859,7
679,9
879,9
329,8
349,6
39,5
849,5
449,6
749,6
249,7
649,8
619,4
939
778,9


Summary of computational transaction
Raw Inputview raw input (R code)
Raw Outputview raw output of R engine
Computing time2 seconds
R Server'George Udny Yule' @ 216.218.223.82

\begin{tabular}{lllllllll}
\hline
Summary of computational transaction \tabularnewline
Raw Input & view raw input (R code)  \tabularnewline
Raw Output & view raw output of R engine  \tabularnewline
Computing time & 2 seconds \tabularnewline
R Server & 'George Udny Yule' @ 216.218.223.82 \tabularnewline
\hline
\end{tabular}
%Source: https://freestatistics.org/blog/index.php?pk=122514&T=0

[TABLE]
[ROW][C]Summary of computational transaction[/C][/ROW]
[ROW][C]Raw Input[/C][C]view raw input (R code) [/C][/ROW]
[ROW][C]Raw Output[/C][C]view raw output of R engine [/C][/ROW]
[ROW][C]Computing time[/C][C]2 seconds[/C][/ROW]
[ROW][C]R Server[/C][C]'George Udny Yule' @ 216.218.223.82[/C][/ROW]
[/TABLE]
Source: https://freestatistics.org/blog/index.php?pk=122514&T=0

Globally Unique Identifier (entire table): ba.freestatistics.org/blog/index.php?pk=122514&T=0

As an alternative you can also use a QR Code:  

The GUIDs for individual cells are displayed in the table below:

Summary of computational transaction
Raw Inputview raw input (R code)
Raw Outputview raw output of R engine
Computing time2 seconds
R Server'George Udny Yule' @ 216.218.223.82


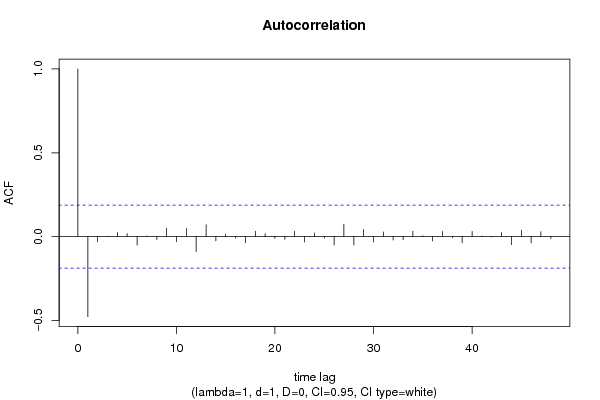
Autocorrelation Function
Time lag kACF(k)T-STATP-value
1-0.4775-4.98521e-06
2-0.030721-0.32070.374512
30.0021680.02260.490991
40.0244520.25530.39949
50.0170280.17780.429612
6-0.051047-0.53290.297579
70.00350.03650.48546
8-0.017034-0.17780.429588
90.0501940.5240.300656
10-0.029928-0.31250.377647
110.0479720.50080.308745
12-0.089072-0.92990.177228
130.0711250.74260.229671
14-0.02468-0.25770.398573
150.0143230.14950.440702
16-0.007943-0.08290.467032
17-0.035835-0.37410.354518
180.0321630.33580.368837
190.017240.180.428749
20-0.010129-0.10580.457986
21-0.015982-0.16690.433894
220.032040.33450.369319
23-0.032473-0.3390.36762
240.0212840.22220.412283
25-0.008178-0.08540.466058
26-0.050306-0.52520.300253
270.0741840.77450.220156
28-0.049668-0.51850.302565
290.0426010.44480.328684
30-0.032299-0.33720.368303
310.027710.28930.386451
32-0.020525-0.21430.415361
33-0.018626-0.19450.423088
340.0313730.32750.371944
350.0048950.05110.479666
36-0.025798-0.26930.394088
370.0304790.31820.375467
38-0.007152-0.07470.470306
39-0.036897-0.38520.350414
400.0302220.31550.376482
410.0027230.02840.488685
42-0.001662-0.01740.493095
430.0249220.26020.397603
44-0.047962-0.50070.308782
450.0381370.39820.345644
46-0.037681-0.39340.347397
470.0290950.30380.380946
48-0.010634-0.1110.455901

\begin{tabular}{lllllllll}
\hline
Autocorrelation Function \tabularnewline
Time lag k & ACF(k) & T-STAT & P-value \tabularnewline
1 & -0.4775 & -4.9852 & 1e-06 \tabularnewline
2 & -0.030721 & -0.3207 & 0.374512 \tabularnewline
3 & 0.002168 & 0.0226 & 0.490991 \tabularnewline
4 & 0.024452 & 0.2553 & 0.39949 \tabularnewline
5 & 0.017028 & 0.1778 & 0.429612 \tabularnewline
6 & -0.051047 & -0.5329 & 0.297579 \tabularnewline
7 & 0.0035 & 0.0365 & 0.48546 \tabularnewline
8 & -0.017034 & -0.1778 & 0.429588 \tabularnewline
9 & 0.050194 & 0.524 & 0.300656 \tabularnewline
10 & -0.029928 & -0.3125 & 0.377647 \tabularnewline
11 & 0.047972 & 0.5008 & 0.308745 \tabularnewline
12 & -0.089072 & -0.9299 & 0.177228 \tabularnewline
13 & 0.071125 & 0.7426 & 0.229671 \tabularnewline
14 & -0.02468 & -0.2577 & 0.398573 \tabularnewline
15 & 0.014323 & 0.1495 & 0.440702 \tabularnewline
16 & -0.007943 & -0.0829 & 0.467032 \tabularnewline
17 & -0.035835 & -0.3741 & 0.354518 \tabularnewline
18 & 0.032163 & 0.3358 & 0.368837 \tabularnewline
19 & 0.01724 & 0.18 & 0.428749 \tabularnewline
20 & -0.010129 & -0.1058 & 0.457986 \tabularnewline
21 & -0.015982 & -0.1669 & 0.433894 \tabularnewline
22 & 0.03204 & 0.3345 & 0.369319 \tabularnewline
23 & -0.032473 & -0.339 & 0.36762 \tabularnewline
24 & 0.021284 & 0.2222 & 0.412283 \tabularnewline
25 & -0.008178 & -0.0854 & 0.466058 \tabularnewline
26 & -0.050306 & -0.5252 & 0.300253 \tabularnewline
27 & 0.074184 & 0.7745 & 0.220156 \tabularnewline
28 & -0.049668 & -0.5185 & 0.302565 \tabularnewline
29 & 0.042601 & 0.4448 & 0.328684 \tabularnewline
30 & -0.032299 & -0.3372 & 0.368303 \tabularnewline
31 & 0.02771 & 0.2893 & 0.386451 \tabularnewline
32 & -0.020525 & -0.2143 & 0.415361 \tabularnewline
33 & -0.018626 & -0.1945 & 0.423088 \tabularnewline
34 & 0.031373 & 0.3275 & 0.371944 \tabularnewline
35 & 0.004895 & 0.0511 & 0.479666 \tabularnewline
36 & -0.025798 & -0.2693 & 0.394088 \tabularnewline
37 & 0.030479 & 0.3182 & 0.375467 \tabularnewline
38 & -0.007152 & -0.0747 & 0.470306 \tabularnewline
39 & -0.036897 & -0.3852 & 0.350414 \tabularnewline
40 & 0.030222 & 0.3155 & 0.376482 \tabularnewline
41 & 0.002723 & 0.0284 & 0.488685 \tabularnewline
42 & -0.001662 & -0.0174 & 0.493095 \tabularnewline
43 & 0.024922 & 0.2602 & 0.397603 \tabularnewline
44 & -0.047962 & -0.5007 & 0.308782 \tabularnewline
45 & 0.038137 & 0.3982 & 0.345644 \tabularnewline
46 & -0.037681 & -0.3934 & 0.347397 \tabularnewline
47 & 0.029095 & 0.3038 & 0.380946 \tabularnewline
48 & -0.010634 & -0.111 & 0.455901 \tabularnewline
\hline
\end{tabular}
%Source: https://freestatistics.org/blog/index.php?pk=122514&T=1

[TABLE]
[ROW][C]Autocorrelation Function[/C][/ROW]
[ROW][C]Time lag k[/C][C]ACF(k)[/C][C]T-STAT[/C][C]P-value[/C][/ROW]
[ROW][C]1[/C][C]-0.4775[/C][C]-4.9852[/C][C]1e-06[/C][/ROW]
[ROW][C]2[/C][C]-0.030721[/C][C]-0.3207[/C][C]0.374512[/C][/ROW]
[ROW][C]3[/C][C]0.002168[/C][C]0.0226[/C][C]0.490991[/C][/ROW]
[ROW][C]4[/C][C]0.024452[/C][C]0.2553[/C][C]0.39949[/C][/ROW]
[ROW][C]5[/C][C]0.017028[/C][C]0.1778[/C][C]0.429612[/C][/ROW]
[ROW][C]6[/C][C]-0.051047[/C][C]-0.5329[/C][C]0.297579[/C][/ROW]
[ROW][C]7[/C][C]0.0035[/C][C]0.0365[/C][C]0.48546[/C][/ROW]
[ROW][C]8[/C][C]-0.017034[/C][C]-0.1778[/C][C]0.429588[/C][/ROW]
[ROW][C]9[/C][C]0.050194[/C][C]0.524[/C][C]0.300656[/C][/ROW]
[ROW][C]10[/C][C]-0.029928[/C][C]-0.3125[/C][C]0.377647[/C][/ROW]
[ROW][C]11[/C][C]0.047972[/C][C]0.5008[/C][C]0.308745[/C][/ROW]
[ROW][C]12[/C][C]-0.089072[/C][C]-0.9299[/C][C]0.177228[/C][/ROW]
[ROW][C]13[/C][C]0.071125[/C][C]0.7426[/C][C]0.229671[/C][/ROW]
[ROW][C]14[/C][C]-0.02468[/C][C]-0.2577[/C][C]0.398573[/C][/ROW]
[ROW][C]15[/C][C]0.014323[/C][C]0.1495[/C][C]0.440702[/C][/ROW]
[ROW][C]16[/C][C]-0.007943[/C][C]-0.0829[/C][C]0.467032[/C][/ROW]
[ROW][C]17[/C][C]-0.035835[/C][C]-0.3741[/C][C]0.354518[/C][/ROW]
[ROW][C]18[/C][C]0.032163[/C][C]0.3358[/C][C]0.368837[/C][/ROW]
[ROW][C]19[/C][C]0.01724[/C][C]0.18[/C][C]0.428749[/C][/ROW]
[ROW][C]20[/C][C]-0.010129[/C][C]-0.1058[/C][C]0.457986[/C][/ROW]
[ROW][C]21[/C][C]-0.015982[/C][C]-0.1669[/C][C]0.433894[/C][/ROW]
[ROW][C]22[/C][C]0.03204[/C][C]0.3345[/C][C]0.369319[/C][/ROW]
[ROW][C]23[/C][C]-0.032473[/C][C]-0.339[/C][C]0.36762[/C][/ROW]
[ROW][C]24[/C][C]0.021284[/C][C]0.2222[/C][C]0.412283[/C][/ROW]
[ROW][C]25[/C][C]-0.008178[/C][C]-0.0854[/C][C]0.466058[/C][/ROW]
[ROW][C]26[/C][C]-0.050306[/C][C]-0.5252[/C][C]0.300253[/C][/ROW]
[ROW][C]27[/C][C]0.074184[/C][C]0.7745[/C][C]0.220156[/C][/ROW]
[ROW][C]28[/C][C]-0.049668[/C][C]-0.5185[/C][C]0.302565[/C][/ROW]
[ROW][C]29[/C][C]0.042601[/C][C]0.4448[/C][C]0.328684[/C][/ROW]
[ROW][C]30[/C][C]-0.032299[/C][C]-0.3372[/C][C]0.368303[/C][/ROW]
[ROW][C]31[/C][C]0.02771[/C][C]0.2893[/C][C]0.386451[/C][/ROW]
[ROW][C]32[/C][C]-0.020525[/C][C]-0.2143[/C][C]0.415361[/C][/ROW]
[ROW][C]33[/C][C]-0.018626[/C][C]-0.1945[/C][C]0.423088[/C][/ROW]
[ROW][C]34[/C][C]0.031373[/C][C]0.3275[/C][C]0.371944[/C][/ROW]
[ROW][C]35[/C][C]0.004895[/C][C]0.0511[/C][C]0.479666[/C][/ROW]
[ROW][C]36[/C][C]-0.025798[/C][C]-0.2693[/C][C]0.394088[/C][/ROW]
[ROW][C]37[/C][C]0.030479[/C][C]0.3182[/C][C]0.375467[/C][/ROW]
[ROW][C]38[/C][C]-0.007152[/C][C]-0.0747[/C][C]0.470306[/C][/ROW]
[ROW][C]39[/C][C]-0.036897[/C][C]-0.3852[/C][C]0.350414[/C][/ROW]
[ROW][C]40[/C][C]0.030222[/C][C]0.3155[/C][C]0.376482[/C][/ROW]
[ROW][C]41[/C][C]0.002723[/C][C]0.0284[/C][C]0.488685[/C][/ROW]
[ROW][C]42[/C][C]-0.001662[/C][C]-0.0174[/C][C]0.493095[/C][/ROW]
[ROW][C]43[/C][C]0.024922[/C][C]0.2602[/C][C]0.397603[/C][/ROW]
[ROW][C]44[/C][C]-0.047962[/C][C]-0.5007[/C][C]0.308782[/C][/ROW]
[ROW][C]45[/C][C]0.038137[/C][C]0.3982[/C][C]0.345644[/C][/ROW]
[ROW][C]46[/C][C]-0.037681[/C][C]-0.3934[/C][C]0.347397[/C][/ROW]
[ROW][C]47[/C][C]0.029095[/C][C]0.3038[/C][C]0.380946[/C][/ROW]
[ROW][C]48[/C][C]-0.010634[/C][C]-0.111[/C][C]0.455901[/C][/ROW]
[/TABLE]
Source: https://freestatistics.org/blog/index.php?pk=122514&T=1

Globally Unique Identifier (entire table): ba.freestatistics.org/blog/index.php?pk=122514&T=1

As an alternative you can also use a QR Code:  

The GUIDs for individual cells are displayed in the table below:

Autocorrelation Function
Time lag kACF(k)T-STATP-value
1-0.4775-4.98521e-06
2-0.030721-0.32070.374512
30.0021680.02260.490991
40.0244520.25530.39949
50.0170280.17780.429612
6-0.051047-0.53290.297579
70.00350.03650.48546
8-0.017034-0.17780.429588
90.0501940.5240.300656
10-0.029928-0.31250.377647
110.0479720.50080.308745
12-0.089072-0.92990.177228
130.0711250.74260.229671
14-0.02468-0.25770.398573
150.0143230.14950.440702
16-0.007943-0.08290.467032
17-0.035835-0.37410.354518
180.0321630.33580.368837
190.017240.180.428749
20-0.010129-0.10580.457986
21-0.015982-0.16690.433894
220.032040.33450.369319
23-0.032473-0.3390.36762
240.0212840.22220.412283
25-0.008178-0.08540.466058
26-0.050306-0.52520.300253
270.0741840.77450.220156
28-0.049668-0.51850.302565
290.0426010.44480.328684
30-0.032299-0.33720.368303
310.027710.28930.386451
32-0.020525-0.21430.415361
33-0.018626-0.19450.423088
340.0313730.32750.371944
350.0048950.05110.479666
36-0.025798-0.26930.394088
370.0304790.31820.375467
38-0.007152-0.07470.470306
39-0.036897-0.38520.350414
400.0302220.31550.376482
410.0027230.02840.488685
42-0.001662-0.01740.493095
430.0249220.26020.397603
44-0.047962-0.50070.308782
450.0381370.39820.345644
46-0.037681-0.39340.347397
470.0290950.30380.380946
48-0.010634-0.1110.455901


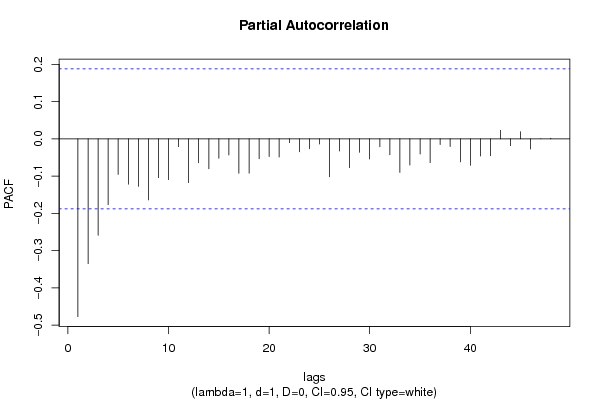
Partial Autocorrelation Function
Time lag kPACF(k)T-STATP-value
1-0.4775-4.98521e-06
2-0.335142-3.4990.000339
3-0.25894-2.70340.003982
4-0.176728-1.84510.033869
5-0.095485-0.99690.160512
6-0.12167-1.27030.103347
7-0.127686-1.33310.092642
8-0.163855-1.71070.044991
9-0.104089-1.08670.139779
10-0.109634-1.14460.127438
11-0.020947-0.21870.413651
12-0.117651-1.22830.110987
13-0.064227-0.67050.251963
14-0.080155-0.83680.202256
15-0.05225-0.54550.293261
16-0.043311-0.45220.326019
17-0.0924-0.96470.168419
18-0.092014-0.96070.169425
19-0.053401-0.55750.289156
20-0.047633-0.49730.309989
21-0.048787-0.50930.305768
22-0.010095-0.10540.458128
23-0.034458-0.35980.359864
24-0.026561-0.27730.391036
25-0.013995-0.14610.442051
26-0.101735-1.06210.14526
27-0.032843-0.34290.36617
28-0.077373-0.80780.210485
29-0.036184-0.37780.353168
30-0.054302-0.56690.285966
31-0.02139-0.22330.411851
32-0.042696-0.44580.328329
33-0.090061-0.94030.174582
34-0.070404-0.7350.231946
35-0.040666-0.42460.335995
36-0.06396-0.66780.252849
37-0.015289-0.15960.436736
38-0.020703-0.21610.414637
39-0.061762-0.64480.260201
40-0.070777-0.73890.230766
41-0.04609-0.48120.315671
42-0.04541-0.47410.31819
430.0227910.23790.406185
44-0.018295-0.1910.424437
450.0190430.19880.421389
46-0.027364-0.28570.387828
470.0002490.00260.498965
480.0018410.01920.492349

\begin{tabular}{lllllllll}
\hline
Partial Autocorrelation Function \tabularnewline
Time lag k & PACF(k) & T-STAT & P-value \tabularnewline
1 & -0.4775 & -4.9852 & 1e-06 \tabularnewline
2 & -0.335142 & -3.499 & 0.000339 \tabularnewline
3 & -0.25894 & -2.7034 & 0.003982 \tabularnewline
4 & -0.176728 & -1.8451 & 0.033869 \tabularnewline
5 & -0.095485 & -0.9969 & 0.160512 \tabularnewline
6 & -0.12167 & -1.2703 & 0.103347 \tabularnewline
7 & -0.127686 & -1.3331 & 0.092642 \tabularnewline
8 & -0.163855 & -1.7107 & 0.044991 \tabularnewline
9 & -0.104089 & -1.0867 & 0.139779 \tabularnewline
10 & -0.109634 & -1.1446 & 0.127438 \tabularnewline
11 & -0.020947 & -0.2187 & 0.413651 \tabularnewline
12 & -0.117651 & -1.2283 & 0.110987 \tabularnewline
13 & -0.064227 & -0.6705 & 0.251963 \tabularnewline
14 & -0.080155 & -0.8368 & 0.202256 \tabularnewline
15 & -0.05225 & -0.5455 & 0.293261 \tabularnewline
16 & -0.043311 & -0.4522 & 0.326019 \tabularnewline
17 & -0.0924 & -0.9647 & 0.168419 \tabularnewline
18 & -0.092014 & -0.9607 & 0.169425 \tabularnewline
19 & -0.053401 & -0.5575 & 0.289156 \tabularnewline
20 & -0.047633 & -0.4973 & 0.309989 \tabularnewline
21 & -0.048787 & -0.5093 & 0.305768 \tabularnewline
22 & -0.010095 & -0.1054 & 0.458128 \tabularnewline
23 & -0.034458 & -0.3598 & 0.359864 \tabularnewline
24 & -0.026561 & -0.2773 & 0.391036 \tabularnewline
25 & -0.013995 & -0.1461 & 0.442051 \tabularnewline
26 & -0.101735 & -1.0621 & 0.14526 \tabularnewline
27 & -0.032843 & -0.3429 & 0.36617 \tabularnewline
28 & -0.077373 & -0.8078 & 0.210485 \tabularnewline
29 & -0.036184 & -0.3778 & 0.353168 \tabularnewline
30 & -0.054302 & -0.5669 & 0.285966 \tabularnewline
31 & -0.02139 & -0.2233 & 0.411851 \tabularnewline
32 & -0.042696 & -0.4458 & 0.328329 \tabularnewline
33 & -0.090061 & -0.9403 & 0.174582 \tabularnewline
34 & -0.070404 & -0.735 & 0.231946 \tabularnewline
35 & -0.040666 & -0.4246 & 0.335995 \tabularnewline
36 & -0.06396 & -0.6678 & 0.252849 \tabularnewline
37 & -0.015289 & -0.1596 & 0.436736 \tabularnewline
38 & -0.020703 & -0.2161 & 0.414637 \tabularnewline
39 & -0.061762 & -0.6448 & 0.260201 \tabularnewline
40 & -0.070777 & -0.7389 & 0.230766 \tabularnewline
41 & -0.04609 & -0.4812 & 0.315671 \tabularnewline
42 & -0.04541 & -0.4741 & 0.31819 \tabularnewline
43 & 0.022791 & 0.2379 & 0.406185 \tabularnewline
44 & -0.018295 & -0.191 & 0.424437 \tabularnewline
45 & 0.019043 & 0.1988 & 0.421389 \tabularnewline
46 & -0.027364 & -0.2857 & 0.387828 \tabularnewline
47 & 0.000249 & 0.0026 & 0.498965 \tabularnewline
48 & 0.001841 & 0.0192 & 0.492349 \tabularnewline
\hline
\end{tabular}
%Source: https://freestatistics.org/blog/index.php?pk=122514&T=2

[TABLE]
[ROW][C]Partial Autocorrelation Function[/C][/ROW]
[ROW][C]Time lag k[/C][C]PACF(k)[/C][C]T-STAT[/C][C]P-value[/C][/ROW]
[ROW][C]1[/C][C]-0.4775[/C][C]-4.9852[/C][C]1e-06[/C][/ROW]
[ROW][C]2[/C][C]-0.335142[/C][C]-3.499[/C][C]0.000339[/C][/ROW]
[ROW][C]3[/C][C]-0.25894[/C][C]-2.7034[/C][C]0.003982[/C][/ROW]
[ROW][C]4[/C][C]-0.176728[/C][C]-1.8451[/C][C]0.033869[/C][/ROW]
[ROW][C]5[/C][C]-0.095485[/C][C]-0.9969[/C][C]0.160512[/C][/ROW]
[ROW][C]6[/C][C]-0.12167[/C][C]-1.2703[/C][C]0.103347[/C][/ROW]
[ROW][C]7[/C][C]-0.127686[/C][C]-1.3331[/C][C]0.092642[/C][/ROW]
[ROW][C]8[/C][C]-0.163855[/C][C]-1.7107[/C][C]0.044991[/C][/ROW]
[ROW][C]9[/C][C]-0.104089[/C][C]-1.0867[/C][C]0.139779[/C][/ROW]
[ROW][C]10[/C][C]-0.109634[/C][C]-1.1446[/C][C]0.127438[/C][/ROW]
[ROW][C]11[/C][C]-0.020947[/C][C]-0.2187[/C][C]0.413651[/C][/ROW]
[ROW][C]12[/C][C]-0.117651[/C][C]-1.2283[/C][C]0.110987[/C][/ROW]
[ROW][C]13[/C][C]-0.064227[/C][C]-0.6705[/C][C]0.251963[/C][/ROW]
[ROW][C]14[/C][C]-0.080155[/C][C]-0.8368[/C][C]0.202256[/C][/ROW]
[ROW][C]15[/C][C]-0.05225[/C][C]-0.5455[/C][C]0.293261[/C][/ROW]
[ROW][C]16[/C][C]-0.043311[/C][C]-0.4522[/C][C]0.326019[/C][/ROW]
[ROW][C]17[/C][C]-0.0924[/C][C]-0.9647[/C][C]0.168419[/C][/ROW]
[ROW][C]18[/C][C]-0.092014[/C][C]-0.9607[/C][C]0.169425[/C][/ROW]
[ROW][C]19[/C][C]-0.053401[/C][C]-0.5575[/C][C]0.289156[/C][/ROW]
[ROW][C]20[/C][C]-0.047633[/C][C]-0.4973[/C][C]0.309989[/C][/ROW]
[ROW][C]21[/C][C]-0.048787[/C][C]-0.5093[/C][C]0.305768[/C][/ROW]
[ROW][C]22[/C][C]-0.010095[/C][C]-0.1054[/C][C]0.458128[/C][/ROW]
[ROW][C]23[/C][C]-0.034458[/C][C]-0.3598[/C][C]0.359864[/C][/ROW]
[ROW][C]24[/C][C]-0.026561[/C][C]-0.2773[/C][C]0.391036[/C][/ROW]
[ROW][C]25[/C][C]-0.013995[/C][C]-0.1461[/C][C]0.442051[/C][/ROW]
[ROW][C]26[/C][C]-0.101735[/C][C]-1.0621[/C][C]0.14526[/C][/ROW]
[ROW][C]27[/C][C]-0.032843[/C][C]-0.3429[/C][C]0.36617[/C][/ROW]
[ROW][C]28[/C][C]-0.077373[/C][C]-0.8078[/C][C]0.210485[/C][/ROW]
[ROW][C]29[/C][C]-0.036184[/C][C]-0.3778[/C][C]0.353168[/C][/ROW]
[ROW][C]30[/C][C]-0.054302[/C][C]-0.5669[/C][C]0.285966[/C][/ROW]
[ROW][C]31[/C][C]-0.02139[/C][C]-0.2233[/C][C]0.411851[/C][/ROW]
[ROW][C]32[/C][C]-0.042696[/C][C]-0.4458[/C][C]0.328329[/C][/ROW]
[ROW][C]33[/C][C]-0.090061[/C][C]-0.9403[/C][C]0.174582[/C][/ROW]
[ROW][C]34[/C][C]-0.070404[/C][C]-0.735[/C][C]0.231946[/C][/ROW]
[ROW][C]35[/C][C]-0.040666[/C][C]-0.4246[/C][C]0.335995[/C][/ROW]
[ROW][C]36[/C][C]-0.06396[/C][C]-0.6678[/C][C]0.252849[/C][/ROW]
[ROW][C]37[/C][C]-0.015289[/C][C]-0.1596[/C][C]0.436736[/C][/ROW]
[ROW][C]38[/C][C]-0.020703[/C][C]-0.2161[/C][C]0.414637[/C][/ROW]
[ROW][C]39[/C][C]-0.061762[/C][C]-0.6448[/C][C]0.260201[/C][/ROW]
[ROW][C]40[/C][C]-0.070777[/C][C]-0.7389[/C][C]0.230766[/C][/ROW]
[ROW][C]41[/C][C]-0.04609[/C][C]-0.4812[/C][C]0.315671[/C][/ROW]
[ROW][C]42[/C][C]-0.04541[/C][C]-0.4741[/C][C]0.31819[/C][/ROW]
[ROW][C]43[/C][C]0.022791[/C][C]0.2379[/C][C]0.406185[/C][/ROW]
[ROW][C]44[/C][C]-0.018295[/C][C]-0.191[/C][C]0.424437[/C][/ROW]
[ROW][C]45[/C][C]0.019043[/C][C]0.1988[/C][C]0.421389[/C][/ROW]
[ROW][C]46[/C][C]-0.027364[/C][C]-0.2857[/C][C]0.387828[/C][/ROW]
[ROW][C]47[/C][C]0.000249[/C][C]0.0026[/C][C]0.498965[/C][/ROW]
[ROW][C]48[/C][C]0.001841[/C][C]0.0192[/C][C]0.492349[/C][/ROW]
[/TABLE]
Source: https://freestatistics.org/blog/index.php?pk=122514&T=2

Globally Unique Identifier (entire table): ba.freestatistics.org/blog/index.php?pk=122514&T=2

As an alternative you can also use a QR Code:  

The GUIDs for individual cells are displayed in the table below:

Partial Autocorrelation Function
Time lag kPACF(k)T-STATP-value
1-0.4775-4.98521e-06
2-0.335142-3.4990.000339
3-0.25894-2.70340.003982
4-0.176728-1.84510.033869
5-0.095485-0.99690.160512
6-0.12167-1.27030.103347
7-0.127686-1.33310.092642
8-0.163855-1.71070.044991
9-0.104089-1.08670.139779
10-0.109634-1.14460.127438
11-0.020947-0.21870.413651
12-0.117651-1.22830.110987
13-0.064227-0.67050.251963
14-0.080155-0.83680.202256
15-0.05225-0.54550.293261
16-0.043311-0.45220.326019
17-0.0924-0.96470.168419
18-0.092014-0.96070.169425
19-0.053401-0.55750.289156
20-0.047633-0.49730.309989
21-0.048787-0.50930.305768
22-0.010095-0.10540.458128
23-0.034458-0.35980.359864
24-0.026561-0.27730.391036
25-0.013995-0.14610.442051
26-0.101735-1.06210.14526
27-0.032843-0.34290.36617
28-0.077373-0.80780.210485
29-0.036184-0.37780.353168
30-0.054302-0.56690.285966
31-0.02139-0.22330.411851
32-0.042696-0.44580.328329
33-0.090061-0.94030.174582
34-0.070404-0.7350.231946
35-0.040666-0.42460.335995
36-0.06396-0.66780.252849
37-0.015289-0.15960.436736
38-0.020703-0.21610.414637
39-0.061762-0.64480.260201
40-0.070777-0.73890.230766
41-0.04609-0.48120.315671
42-0.04541-0.47410.31819
430.0227910.23790.406185
44-0.018295-0.1910.424437
450.0190430.19880.421389
46-0.027364-0.28570.387828
470.0002490.00260.498965
480.0018410.01920.492349


Parameters (Session):
par1 = 48 ; par2 = 1 ; par3 = 1 ; par4 = 0 ; par5 = 12 ; par6 = White Noise ; par7 = 0.95 ;
Parameters (R input):
par1 = 48 ; par2 = 1 ; par3 = 1 ; par4 = 0 ; par5 = 12 ; par6 = White Noise ; par7 = 0.95 ; par8 = ;
R code (references can be found in the software module):
if (par1 == 'Default') {
par1 = 10*log10(length(x))
} else {
par1 <- as.numeric(par1)
}
par2 <- as.numeric(par2)
par3 <- as.numeric(par3)
par4 <- as.numeric(par4)
par5 <- as.numeric(par5)
if (par6 == 'White Noise') par6 <- 'white' else par6 <- 'ma'
par7 <- as.numeric(par7)
if (par8 != '') par8 <- as.numeric(par8)
ox <- x
if (par8 == '') {
if (par2 == 0) {
x <- log(x)
} else {
x <- (x ^ par2 - 1) / par2
}
} else {
x <- log(x,base=par8)
}
if (par3 > 0) x <- diff(x,lag=1,difference=par3)
if (par4 > 0) x <- diff(x,lag=par5,difference=par4)
bitmap(file='picts.png')
op <- par(mfrow=c(2,1))
plot(ox,type='l',main='Original Time Series',xlab='time',ylab='value')
if (par8=='') {
mytitle <- paste('Working Time Series (lambda=',par2,', d=',par3,', D=',par4,')',sep='')
mysub <- paste('(lambda=',par2,', d=',par3,', D=',par4,', CI=', par7, ', CI type=',par6,')',sep='')
} else {
mytitle <- paste('Working Time Series (base=',par8,', d=',par3,', D=',par4,')',sep='')
mysub <- paste('(base=',par8,', d=',par3,', D=',par4,', CI=', par7, ', CI type=',par6,')',sep='')
}
plot(x,type='l', main=mytitle,xlab='time',ylab='value')
par(op)
dev.off()
bitmap(file='pic1.png')
racf <- acf(x, par1, main='Autocorrelation', xlab='time lag', ylab='ACF', ci.type=par6, ci=par7, sub=mysub)
dev.off()
bitmap(file='pic2.png')
rpacf <- pacf(x,par1,main='Partial Autocorrelation',xlab='lags',ylab='PACF',sub=mysub)
dev.off()
(myacf <- c(racf$acf))
(mypacf <- c(rpacf$acf))
lengthx <- length(x)
sqrtn <- sqrt(lengthx)
load(file='createtable')
a<-table.start()
a<-table.row.start(a)
a<-table.element(a,'Autocorrelation Function',4,TRUE)
a<-table.row.end(a)
a<-table.row.start(a)
a<-table.element(a,'Time lag k',header=TRUE)
a<-table.element(a,hyperlink('basics.htm','ACF(k)','click here for more information about the Autocorrelation Function'),header=TRUE)
a<-table.element(a,'T-STAT',header=TRUE)
a<-table.element(a,'P-value',header=TRUE)
a<-table.row.end(a)
for (i in 2:(par1+1)) {
a<-table.row.start(a)
a<-table.element(a,i-1,header=TRUE)
a<-table.element(a,round(myacf[i],6))
mytstat <- myacf[i]*sqrtn
a<-table.element(a,round(mytstat,4))
a<-table.element(a,round(1-pt(abs(mytstat),lengthx),6))
a<-table.row.end(a)
}
a<-table.end(a)
table.save(a,file='mytable.tab')
a<-table.start()
a<-table.row.start(a)
a<-table.element(a,'Partial Autocorrelation Function',4,TRUE)
a<-table.row.end(a)
a<-table.row.start(a)
a<-table.element(a,'Time lag k',header=TRUE)
a<-table.element(a,hyperlink('basics.htm','PACF(k)','click here for more information about the Partial Autocorrelation Function'),header=TRUE)
a<-table.element(a,'T-STAT',header=TRUE)
a<-table.element(a,'P-value',header=TRUE)
a<-table.row.end(a)
for (i in 1:par1) {
a<-table.row.start(a)
a<-table.element(a,i,header=TRUE)
a<-table.element(a,round(mypacf[i],6))
mytstat <- mypacf[i]*sqrtn
a<-table.element(a,round(mytstat,4))
a<-table.element(a,round(1-pt(abs(mytstat),lengthx),6))
a<-table.row.end(a)
}
a<-table.end(a)
table.save(a,file='mytable1.tab')