Free Statistics
of Irreproducible Research!
Description of Statistical Computation | |||||||||||||||||||||||||||||||||||||||||
|---|---|---|---|---|---|---|---|---|---|---|---|---|---|---|---|---|---|---|---|---|---|---|---|---|---|---|---|---|---|---|---|---|---|---|---|---|---|---|---|---|---|
| Author's title | Datareeks-tijdreeks inschrijvingen - nieuwe personenwagens - Frederik Verbr... | ||||||||||||||||||||||||||||||||||||||||
| Author | *Unverified author* | ||||||||||||||||||||||||||||||||||||||||
| R Software Module | rwasp_univariatedataseries.wasp | ||||||||||||||||||||||||||||||||||||||||
| Title produced by software | Univariate Data Series | ||||||||||||||||||||||||||||||||||||||||
| Date of computation | Fri, 20 May 2011 09:52:47 +0000 | ||||||||||||||||||||||||||||||||||||||||
| Cite this page as follows | Statistical Computations at FreeStatistics.org, Office for Research Development and Education, URL https://freestatistics.org/blog/index.php?v=date/2011/May/20/t1305885027i2ghs7mrpc3a9dh.htm/, Retrieved Mon, 13 May 2024 04:54:43 +0000 | ||||||||||||||||||||||||||||||||||||||||
| Statistical Computations at FreeStatistics.org, Office for Research Development and Education, URL https://freestatistics.org/blog/index.php?pk=122444, Retrieved Mon, 13 May 2024 04:54:43 +0000 | |||||||||||||||||||||||||||||||||||||||||
| QR Codes: | |||||||||||||||||||||||||||||||||||||||||
|
| |||||||||||||||||||||||||||||||||||||||||
| Original text written by user: | |||||||||||||||||||||||||||||||||||||||||
| IsPrivate? | No (this computation is public) | ||||||||||||||||||||||||||||||||||||||||
| User-defined keywords | KDGP1W51 | ||||||||||||||||||||||||||||||||||||||||
| Estimated Impact | 99 | ||||||||||||||||||||||||||||||||||||||||
Tree of Dependent Computations | |||||||||||||||||||||||||||||||||||||||||
| Family? (F = Feedback message, R = changed R code, M = changed R Module, P = changed Parameters, D = changed Data) | |||||||||||||||||||||||||||||||||||||||||
| - [Univariate Data Series] [Datareeks-tijdree...] [2011-05-20 09:52:47] [7bcd6f70ebc29c57c8a78e561eff7496] [Current] - PD [Univariate Data Series] [Datareeks-tijdree...] [2011-05-20 10:08:12] [1a2529c7ddde8b9806f7cce4d00981a3] - RMPD [Mean Plot] [datareeks - modul...] [2011-05-20 10:23:08] [1a2529c7ddde8b9806f7cce4d00981a3] - RMPD [(Partial) Autocorrelation Function] [ datareeks - gemi...] [2011-05-20 10:50:15] [1a2529c7ddde8b9806f7cce4d00981a3] - [(Partial) Autocorrelation Function] [datareeks - degre...] [2011-05-20 11:04:18] [1a2529c7ddde8b9806f7cce4d00981a3] - D [(Partial) Autocorrelation Function] [datareeks - aanvu...] [2011-05-20 11:19:06] [1a2529c7ddde8b9806f7cce4d00981a3] - D [(Partial) Autocorrelation Function] [datareeks - degre...] [2011-05-20 11:26:35] [1a2529c7ddde8b9806f7cce4d00981a3] - RM D [Bootstrap Plot - Central Tendency] [datareeks - boots...] [2011-05-20 11:51:24] [1a2529c7ddde8b9806f7cce4d00981a3] - RM D [Bootstrap Plot - Central Tendency] [datareeks - boots...] [2011-05-20 11:57:11] [1a2529c7ddde8b9806f7cce4d00981a3] - RM D [Blocked Bootstrap Plot - Central Tendency] [datareeks - Block...] [2011-05-20 12:23:50] [1a2529c7ddde8b9806f7cce4d00981a3] - RM D [Variability] [datareeks - sprei...] [2011-05-20 13:30:00] [1a2529c7ddde8b9806f7cce4d00981a3] - RM [Standard Deviation Plot] [datareeks - stand...] [2011-05-20 13:36:37] [1a2529c7ddde8b9806f7cce4d00981a3] - RM [Standard Deviation-Mean Plot] [datareeks - Stand...] [2011-05-20 13:48:53] [1a2529c7ddde8b9806f7cce4d00981a3] - RM D [Variability] [datareeks - modul...] [2011-05-20 14:00:23] [1a2529c7ddde8b9806f7cce4d00981a3] - RM D [Standard Deviation Plot] [datareeks - Stand...] [2011-05-20 14:04:47] [1a2529c7ddde8b9806f7cce4d00981a3] - RM D [Standard Deviation-Mean Plot] [datareeks -spreid...] [2011-05-20 14:11:38] [1a2529c7ddde8b9806f7cce4d00981a3] - RM [Classical Decomposition] [datareeks- decomp...] [2011-05-20 14:21:49] [1a2529c7ddde8b9806f7cce4d00981a3] - RM D [Classical Decomposition] [datareeks - decom...] [2011-05-20 14:31:28] [1a2529c7ddde8b9806f7cce4d00981a3] - RM [Exponential Smoothing] [datareeks -expone...] [2011-05-20 14:45:07] [1a2529c7ddde8b9806f7cce4d00981a3] - RM D [Exponential Smoothing] [datareeks - expon...] [2011-05-20 14:51:38] [1a2529c7ddde8b9806f7cce4d00981a3] | |||||||||||||||||||||||||||||||||||||||||
| Feedback Forum | |||||||||||||||||||||||||||||||||||||||||
Post a new message | |||||||||||||||||||||||||||||||||||||||||
Dataset | |||||||||||||||||||||||||||||||||||||||||
| Dataseries X: | |||||||||||||||||||||||||||||||||||||||||
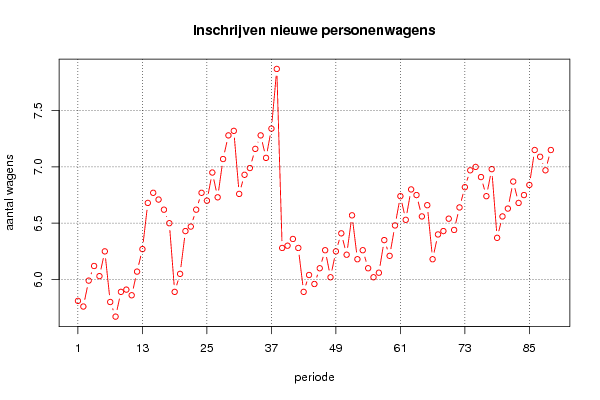
5.81 5.76 5.99 6.12 6.03 6.25 5.80 5.67 5.89 5.91 5.86 6.07 6.27 6.68 6.77 6.71 6.62 6.50 5.89 6.05 6.43 6.47 6.62 6.77 6.70 6.95 6.73 7.07 7.28 7.32 6.76 6.93 6.99 7.16 7.28 7.08 7.34 7.87 6.28 6.30 6.36 6.28 5.89 6.04 5.96 6.10 6.26 6.02 6.25 6.41 6.22 6.57 6.18 6.26 6.10 6.02 6.06 6.35 6.21 6.48 6.74 6.53 6.80 6.75 6.56 6.66 6.18 6.40 6.43 6.54 6.44 6.64 6.82 6.97 7.00 6.91 6.74 6.98 6.37 6.56 6.63 6.87 6.68 6.75 6.84 7.15 7.09 6.97 7.15 | |||||||||||||||||||||||||||||||||||||||||
Tables (Output of Computation) | |||||||||||||||||||||||||||||||||||||||||
| |||||||||||||||||||||||||||||||||||||||||
Figures (Output of Computation) | |||||||||||||||||||||||||||||||||||||||||
Input Parameters & R Code | |||||||||||||||||||||||||||||||||||||||||
| Parameters (Session): | |||||||||||||||||||||||||||||||||||||||||
| par1 = Inschrijvingen nieuwe personenwagens ; par2 = https://bb.kdg.be/webapps/portal/frameset.jsp?tab_tab_group_id=null&url=%2Fwebapps%2Fblackboard%2Fexecute%2Flauncher%3Ftype%3DCourse%26id%3D_71898_1%26url%3D ; par3 = De datareeks bevat de maandelijkse inschrijvingen van nieuwe personenwagens gedurende de periode tussen 2000-2005 ; par4 = 12 ; | |||||||||||||||||||||||||||||||||||||||||
| Parameters (R input): | |||||||||||||||||||||||||||||||||||||||||
| par1 = Inschrijvingen nieuwe personenwagens ; par2 = https://bb.kdg.be/webapps/portal/frameset.jsp?tab_tab_group_id=null&url=%2Fwebapps%2Fblackboard%2Fexecute%2Flauncher%3Ftype%3DCourse%26id%3D_71898_1%26url%3D ; par3 = De datareeks bevat de maandelijkse inschrijvingen van nieuwe personenwagens gedurende de periode tussen 2000-2005 ; par4 = 12 ; | |||||||||||||||||||||||||||||||||||||||||
| R code (references can be found in the software module): | |||||||||||||||||||||||||||||||||||||||||
if (par4 != 'No season') { | |||||||||||||||||||||||||||||||||||||||||