Free Statistics

of Irreproducible Research!

Author's title

Author*Unverified author*
R Software Modulerwasp_autocorrelation.wasp
Title produced by software(Partial) Autocorrelation Function
Date of computationFri, 20 May 2011 04:15:38 +0000
Cite this page as followsStatistical Computations at FreeStatistics.org, Office for Research Development and Education, URL https://freestatistics.org/blog/index.php?v=date/2011/May/20/t1305864755jyeo4qj9nlm8wri.htm/, Retrieved Sun, 12 May 2024 21:53:41 +0000
Statistical Computations at FreeStatistics.org, Office for Research Development and Education, URL https://freestatistics.org/blog/index.php?pk=122400, Retrieved Sun, 12 May 2024 21:53:41 +0000
QR Codes:

Original text written by user:
IsPrivate?No (this computation is public)
User-defined keywordsKDGP2W12
Estimated Impact102
Family? (F = Feedback message, R = changed R code, M = changed R Module, P = changed Parameters, D = changed Data)
-     [(Partial) Autocorrelation Function] [Autocorrelation -...] [2010-01-25 18:02:00] [7723ae71f48a5adc5e785905b449f94f]
- R PD    [(Partial) Autocorrelation Function] [] [2011-05-20 04:15:38] [25018b84afebffe8bc31ee5ed84cfeb9] [Current]
Feedback Forum

Post a new message
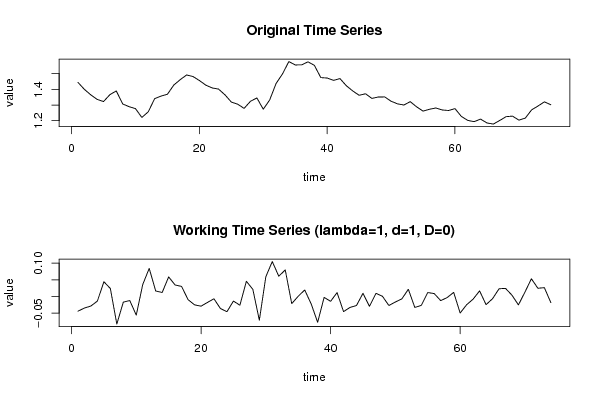
Dataseries X:
1.4442
1.3999
1.3649
1.336
1.322
1.3661
1.3898
1.3067
1.2894
1.277
1.2208
1.2565
1.3406
1.3569
1.3686
1.4272
1.4614
1.4914
1.4816
1.4562
1.4268
1.4088
1.4016
1.365
1.319
1.305
1.2785
1.3239
1.3449
1.2732
1.3322
1.4369
1.4975
1.577
1.5553
1.5557
1.575
1.5527
1.4748
1.4718
1.457
1.4684
1.4227
1.3896
1.3622
1.3716
1.3419
1.3511
1.3516
1.3242
1.3074
1.2999
1.3213
1.2881
1.2611
1.2727
1.2811
1.2684
1.265
1.277
1.2271
1.202
1.1938
1.2103
1.1856
1.1786
1.2015
1.2256
1.2292
1.2037
1.2165
1.2694
1.2938
1.3201
1.3014


Summary of computational transaction
Raw Inputview raw input (R code)
Raw Outputview raw output of R engine
Computing time3 seconds
R Server'Gwilym Jenkins' @ www.wessa.org

\begin{tabular}{lllllllll}
\hline
Summary of computational transaction \tabularnewline
Raw Input & view raw input (R code)  \tabularnewline
Raw Output & view raw output of R engine  \tabularnewline
Computing time & 3 seconds \tabularnewline
R Server & 'Gwilym Jenkins' @ www.wessa.org \tabularnewline
\hline
\end{tabular}
%Source: https://freestatistics.org/blog/index.php?pk=122400&T=0

[TABLE]
[ROW][C]Summary of computational transaction[/C][/ROW]
[ROW][C]Raw Input[/C][C]view raw input (R code) [/C][/ROW]
[ROW][C]Raw Output[/C][C]view raw output of R engine [/C][/ROW]
[ROW][C]Computing time[/C][C]3 seconds[/C][/ROW]
[ROW][C]R Server[/C][C]'Gwilym Jenkins' @ www.wessa.org[/C][/ROW]
[/TABLE]
Source: https://freestatistics.org/blog/index.php?pk=122400&T=0

Globally Unique Identifier (entire table): ba.freestatistics.org/blog/index.php?pk=122400&T=0

As an alternative you can also use a QR Code:  

The GUIDs for individual cells are displayed in the table below:

Summary of computational transaction
Raw Inputview raw input (R code)
Raw Outputview raw output of R engine
Computing time3 seconds
R Server'Gwilym Jenkins' @ www.wessa.org


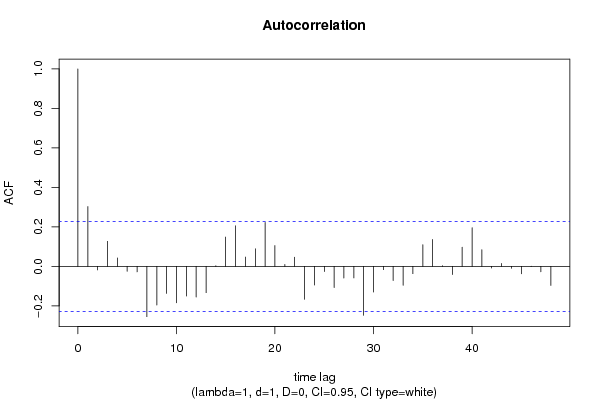
Autocorrelation Function
Time lag kACF(k)T-STATP-value
10.3027032.6040.005565
2-0.017937-0.15430.438898
30.1268441.09120.139373
40.0425120.36570.357815
5-0.024444-0.21030.417015
6-0.027772-0.23890.405921
7-0.254682-2.19090.015806
8-0.195484-1.68160.04843
9-0.136659-1.17560.121764
10-0.184658-1.58850.05822
11-0.150002-1.29040.100471
12-0.155609-1.33860.0924
13-0.133171-1.14560.12783
140.0035180.03030.487969
150.1481441.27440.103258
160.2050861.76420.040911
170.0469580.40390.343708
180.088830.76410.223605
190.2219161.9090.030071
200.1051880.90490.184237
210.0093980.08080.467893
220.0464250.39940.345389
23-0.166962-1.43630.077571
24-0.094323-0.81140.20987
25-0.026078-0.22430.41156
26-0.107088-0.92120.179968
27-0.059058-0.5080.306469
28-0.058383-0.50220.308498
29-0.247227-2.12670.018389
30-0.130203-1.120.133158
31-0.016557-0.14240.443564
32-0.071305-0.61340.270749
33-0.095633-0.82270.20667
34-0.036651-0.31530.376717
350.1094630.94160.174722
360.1362351.17190.122491
370.0035070.03020.488006
38-0.041408-0.35620.36135
390.0972420.83650.202782
400.1958591.68480.048116
410.0844260.72630.234986
42-0.008675-0.07460.470357
430.0148560.12780.449328
44-0.009659-0.08310.467002
45-0.037191-0.31990.374961
46-0.001192-0.01030.495924
47-0.027478-0.23640.406897
48-0.096442-0.82960.20471

\begin{tabular}{lllllllll}
\hline
Autocorrelation Function \tabularnewline
Time lag k & ACF(k) & T-STAT & P-value \tabularnewline
1 & 0.302703 & 2.604 & 0.005565 \tabularnewline
2 & -0.017937 & -0.1543 & 0.438898 \tabularnewline
3 & 0.126844 & 1.0912 & 0.139373 \tabularnewline
4 & 0.042512 & 0.3657 & 0.357815 \tabularnewline
5 & -0.024444 & -0.2103 & 0.417015 \tabularnewline
6 & -0.027772 & -0.2389 & 0.405921 \tabularnewline
7 & -0.254682 & -2.1909 & 0.015806 \tabularnewline
8 & -0.195484 & -1.6816 & 0.04843 \tabularnewline
9 & -0.136659 & -1.1756 & 0.121764 \tabularnewline
10 & -0.184658 & -1.5885 & 0.05822 \tabularnewline
11 & -0.150002 & -1.2904 & 0.100471 \tabularnewline
12 & -0.155609 & -1.3386 & 0.0924 \tabularnewline
13 & -0.133171 & -1.1456 & 0.12783 \tabularnewline
14 & 0.003518 & 0.0303 & 0.487969 \tabularnewline
15 & 0.148144 & 1.2744 & 0.103258 \tabularnewline
16 & 0.205086 & 1.7642 & 0.040911 \tabularnewline
17 & 0.046958 & 0.4039 & 0.343708 \tabularnewline
18 & 0.08883 & 0.7641 & 0.223605 \tabularnewline
19 & 0.221916 & 1.909 & 0.030071 \tabularnewline
20 & 0.105188 & 0.9049 & 0.184237 \tabularnewline
21 & 0.009398 & 0.0808 & 0.467893 \tabularnewline
22 & 0.046425 & 0.3994 & 0.345389 \tabularnewline
23 & -0.166962 & -1.4363 & 0.077571 \tabularnewline
24 & -0.094323 & -0.8114 & 0.20987 \tabularnewline
25 & -0.026078 & -0.2243 & 0.41156 \tabularnewline
26 & -0.107088 & -0.9212 & 0.179968 \tabularnewline
27 & -0.059058 & -0.508 & 0.306469 \tabularnewline
28 & -0.058383 & -0.5022 & 0.308498 \tabularnewline
29 & -0.247227 & -2.1267 & 0.018389 \tabularnewline
30 & -0.130203 & -1.12 & 0.133158 \tabularnewline
31 & -0.016557 & -0.1424 & 0.443564 \tabularnewline
32 & -0.071305 & -0.6134 & 0.270749 \tabularnewline
33 & -0.095633 & -0.8227 & 0.20667 \tabularnewline
34 & -0.036651 & -0.3153 & 0.376717 \tabularnewline
35 & 0.109463 & 0.9416 & 0.174722 \tabularnewline
36 & 0.136235 & 1.1719 & 0.122491 \tabularnewline
37 & 0.003507 & 0.0302 & 0.488006 \tabularnewline
38 & -0.041408 & -0.3562 & 0.36135 \tabularnewline
39 & 0.097242 & 0.8365 & 0.202782 \tabularnewline
40 & 0.195859 & 1.6848 & 0.048116 \tabularnewline
41 & 0.084426 & 0.7263 & 0.234986 \tabularnewline
42 & -0.008675 & -0.0746 & 0.470357 \tabularnewline
43 & 0.014856 & 0.1278 & 0.449328 \tabularnewline
44 & -0.009659 & -0.0831 & 0.467002 \tabularnewline
45 & -0.037191 & -0.3199 & 0.374961 \tabularnewline
46 & -0.001192 & -0.0103 & 0.495924 \tabularnewline
47 & -0.027478 & -0.2364 & 0.406897 \tabularnewline
48 & -0.096442 & -0.8296 & 0.20471 \tabularnewline
\hline
\end{tabular}
%Source: https://freestatistics.org/blog/index.php?pk=122400&T=1

[TABLE]
[ROW][C]Autocorrelation Function[/C][/ROW]
[ROW][C]Time lag k[/C][C]ACF(k)[/C][C]T-STAT[/C][C]P-value[/C][/ROW]
[ROW][C]1[/C][C]0.302703[/C][C]2.604[/C][C]0.005565[/C][/ROW]
[ROW][C]2[/C][C]-0.017937[/C][C]-0.1543[/C][C]0.438898[/C][/ROW]
[ROW][C]3[/C][C]0.126844[/C][C]1.0912[/C][C]0.139373[/C][/ROW]
[ROW][C]4[/C][C]0.042512[/C][C]0.3657[/C][C]0.357815[/C][/ROW]
[ROW][C]5[/C][C]-0.024444[/C][C]-0.2103[/C][C]0.417015[/C][/ROW]
[ROW][C]6[/C][C]-0.027772[/C][C]-0.2389[/C][C]0.405921[/C][/ROW]
[ROW][C]7[/C][C]-0.254682[/C][C]-2.1909[/C][C]0.015806[/C][/ROW]
[ROW][C]8[/C][C]-0.195484[/C][C]-1.6816[/C][C]0.04843[/C][/ROW]
[ROW][C]9[/C][C]-0.136659[/C][C]-1.1756[/C][C]0.121764[/C][/ROW]
[ROW][C]10[/C][C]-0.184658[/C][C]-1.5885[/C][C]0.05822[/C][/ROW]
[ROW][C]11[/C][C]-0.150002[/C][C]-1.2904[/C][C]0.100471[/C][/ROW]
[ROW][C]12[/C][C]-0.155609[/C][C]-1.3386[/C][C]0.0924[/C][/ROW]
[ROW][C]13[/C][C]-0.133171[/C][C]-1.1456[/C][C]0.12783[/C][/ROW]
[ROW][C]14[/C][C]0.003518[/C][C]0.0303[/C][C]0.487969[/C][/ROW]
[ROW][C]15[/C][C]0.148144[/C][C]1.2744[/C][C]0.103258[/C][/ROW]
[ROW][C]16[/C][C]0.205086[/C][C]1.7642[/C][C]0.040911[/C][/ROW]
[ROW][C]17[/C][C]0.046958[/C][C]0.4039[/C][C]0.343708[/C][/ROW]
[ROW][C]18[/C][C]0.08883[/C][C]0.7641[/C][C]0.223605[/C][/ROW]
[ROW][C]19[/C][C]0.221916[/C][C]1.909[/C][C]0.030071[/C][/ROW]
[ROW][C]20[/C][C]0.105188[/C][C]0.9049[/C][C]0.184237[/C][/ROW]
[ROW][C]21[/C][C]0.009398[/C][C]0.0808[/C][C]0.467893[/C][/ROW]
[ROW][C]22[/C][C]0.046425[/C][C]0.3994[/C][C]0.345389[/C][/ROW]
[ROW][C]23[/C][C]-0.166962[/C][C]-1.4363[/C][C]0.077571[/C][/ROW]
[ROW][C]24[/C][C]-0.094323[/C][C]-0.8114[/C][C]0.20987[/C][/ROW]
[ROW][C]25[/C][C]-0.026078[/C][C]-0.2243[/C][C]0.41156[/C][/ROW]
[ROW][C]26[/C][C]-0.107088[/C][C]-0.9212[/C][C]0.179968[/C][/ROW]
[ROW][C]27[/C][C]-0.059058[/C][C]-0.508[/C][C]0.306469[/C][/ROW]
[ROW][C]28[/C][C]-0.058383[/C][C]-0.5022[/C][C]0.308498[/C][/ROW]
[ROW][C]29[/C][C]-0.247227[/C][C]-2.1267[/C][C]0.018389[/C][/ROW]
[ROW][C]30[/C][C]-0.130203[/C][C]-1.12[/C][C]0.133158[/C][/ROW]
[ROW][C]31[/C][C]-0.016557[/C][C]-0.1424[/C][C]0.443564[/C][/ROW]
[ROW][C]32[/C][C]-0.071305[/C][C]-0.6134[/C][C]0.270749[/C][/ROW]
[ROW][C]33[/C][C]-0.095633[/C][C]-0.8227[/C][C]0.20667[/C][/ROW]
[ROW][C]34[/C][C]-0.036651[/C][C]-0.3153[/C][C]0.376717[/C][/ROW]
[ROW][C]35[/C][C]0.109463[/C][C]0.9416[/C][C]0.174722[/C][/ROW]
[ROW][C]36[/C][C]0.136235[/C][C]1.1719[/C][C]0.122491[/C][/ROW]
[ROW][C]37[/C][C]0.003507[/C][C]0.0302[/C][C]0.488006[/C][/ROW]
[ROW][C]38[/C][C]-0.041408[/C][C]-0.3562[/C][C]0.36135[/C][/ROW]
[ROW][C]39[/C][C]0.097242[/C][C]0.8365[/C][C]0.202782[/C][/ROW]
[ROW][C]40[/C][C]0.195859[/C][C]1.6848[/C][C]0.048116[/C][/ROW]
[ROW][C]41[/C][C]0.084426[/C][C]0.7263[/C][C]0.234986[/C][/ROW]
[ROW][C]42[/C][C]-0.008675[/C][C]-0.0746[/C][C]0.470357[/C][/ROW]
[ROW][C]43[/C][C]0.014856[/C][C]0.1278[/C][C]0.449328[/C][/ROW]
[ROW][C]44[/C][C]-0.009659[/C][C]-0.0831[/C][C]0.467002[/C][/ROW]
[ROW][C]45[/C][C]-0.037191[/C][C]-0.3199[/C][C]0.374961[/C][/ROW]
[ROW][C]46[/C][C]-0.001192[/C][C]-0.0103[/C][C]0.495924[/C][/ROW]
[ROW][C]47[/C][C]-0.027478[/C][C]-0.2364[/C][C]0.406897[/C][/ROW]
[ROW][C]48[/C][C]-0.096442[/C][C]-0.8296[/C][C]0.20471[/C][/ROW]
[/TABLE]
Source: https://freestatistics.org/blog/index.php?pk=122400&T=1

Globally Unique Identifier (entire table): ba.freestatistics.org/blog/index.php?pk=122400&T=1

As an alternative you can also use a QR Code:  

The GUIDs for individual cells are displayed in the table below:

Autocorrelation Function
Time lag kACF(k)T-STATP-value
10.3027032.6040.005565
2-0.017937-0.15430.438898
30.1268441.09120.139373
40.0425120.36570.357815
5-0.024444-0.21030.417015
6-0.027772-0.23890.405921
7-0.254682-2.19090.015806
8-0.195484-1.68160.04843
9-0.136659-1.17560.121764
10-0.184658-1.58850.05822
11-0.150002-1.29040.100471
12-0.155609-1.33860.0924
13-0.133171-1.14560.12783
140.0035180.03030.487969
150.1481441.27440.103258
160.2050861.76420.040911
170.0469580.40390.343708
180.088830.76410.223605
190.2219161.9090.030071
200.1051880.90490.184237
210.0093980.08080.467893
220.0464250.39940.345389
23-0.166962-1.43630.077571
24-0.094323-0.81140.20987
25-0.026078-0.22430.41156
26-0.107088-0.92120.179968
27-0.059058-0.5080.306469
28-0.058383-0.50220.308498
29-0.247227-2.12670.018389
30-0.130203-1.120.133158
31-0.016557-0.14240.443564
32-0.071305-0.61340.270749
33-0.095633-0.82270.20667
34-0.036651-0.31530.376717
350.1094630.94160.174722
360.1362351.17190.122491
370.0035070.03020.488006
38-0.041408-0.35620.36135
390.0972420.83650.202782
400.1958591.68480.048116
410.0844260.72630.234986
42-0.008675-0.07460.470357
430.0148560.12780.449328
44-0.009659-0.08310.467002
45-0.037191-0.31990.374961
46-0.001192-0.01030.495924
47-0.027478-0.23640.406897
48-0.096442-0.82960.20471


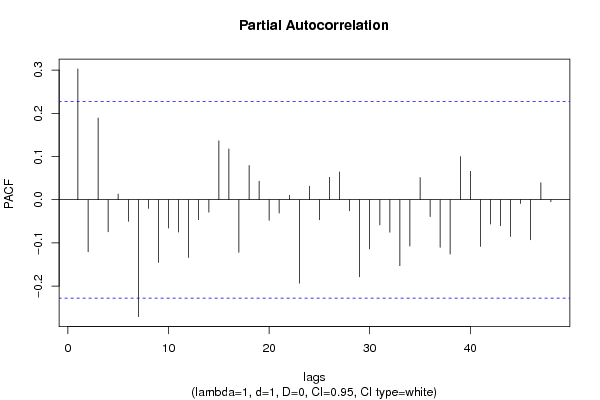
Partial Autocorrelation Function
Time lag kPACF(k)T-STATP-value
10.3027032.6040.005565
2-0.120618-1.03760.151419
30.1892851.62830.053857
4-0.07418-0.63810.262683
50.0129110.11110.455932
6-0.05018-0.43170.333621
7-0.270911-2.33050.011255
8-0.020285-0.17450.430974
9-0.145311-1.250.107616
10-0.065605-0.56440.287108
11-0.074947-0.64470.260551
12-0.133773-1.15080.126768
13-0.046331-0.39860.345684
14-0.028914-0.24870.40213
150.1362321.17190.122496
160.1171641.00790.158397
17-0.121931-1.04890.14882
180.0790430.680.249327
190.0424720.36540.357944
20-0.047687-0.41020.341414
21-0.030884-0.26570.395614
220.0104320.08970.464369
23-0.19329-1.66270.050297
240.0311140.26760.394857
25-0.046648-0.40130.344685
260.0521120.44830.327629
270.064140.55180.291389
28-0.025729-0.22130.412724
29-0.17852-1.53570.06444
30-0.114067-0.98120.164835
31-0.058452-0.50280.30829
32-0.075229-0.64710.259771
33-0.152835-1.31470.09633
34-0.107192-0.92210.179735
350.0510620.43920.330881
36-0.038887-0.33450.369468
37-0.110173-0.94770.173172
38-0.12587-1.08280.141213
390.0996710.85740.196996
400.0655950.56430.287138
41-0.108144-0.93030.177623
42-0.056354-0.48480.314634
43-0.060565-0.5210.30196
44-0.085318-0.73390.232653
45-0.008795-0.07570.469948
46-0.092799-0.79830.21363
470.0392790.33790.368202
48-0.004606-0.03960.484252

\begin{tabular}{lllllllll}
\hline
Partial Autocorrelation Function \tabularnewline
Time lag k & PACF(k) & T-STAT & P-value \tabularnewline
1 & 0.302703 & 2.604 & 0.005565 \tabularnewline
2 & -0.120618 & -1.0376 & 0.151419 \tabularnewline
3 & 0.189285 & 1.6283 & 0.053857 \tabularnewline
4 & -0.07418 & -0.6381 & 0.262683 \tabularnewline
5 & 0.012911 & 0.1111 & 0.455932 \tabularnewline
6 & -0.05018 & -0.4317 & 0.333621 \tabularnewline
7 & -0.270911 & -2.3305 & 0.011255 \tabularnewline
8 & -0.020285 & -0.1745 & 0.430974 \tabularnewline
9 & -0.145311 & -1.25 & 0.107616 \tabularnewline
10 & -0.065605 & -0.5644 & 0.287108 \tabularnewline
11 & -0.074947 & -0.6447 & 0.260551 \tabularnewline
12 & -0.133773 & -1.1508 & 0.126768 \tabularnewline
13 & -0.046331 & -0.3986 & 0.345684 \tabularnewline
14 & -0.028914 & -0.2487 & 0.40213 \tabularnewline
15 & 0.136232 & 1.1719 & 0.122496 \tabularnewline
16 & 0.117164 & 1.0079 & 0.158397 \tabularnewline
17 & -0.121931 & -1.0489 & 0.14882 \tabularnewline
18 & 0.079043 & 0.68 & 0.249327 \tabularnewline
19 & 0.042472 & 0.3654 & 0.357944 \tabularnewline
20 & -0.047687 & -0.4102 & 0.341414 \tabularnewline
21 & -0.030884 & -0.2657 & 0.395614 \tabularnewline
22 & 0.010432 & 0.0897 & 0.464369 \tabularnewline
23 & -0.19329 & -1.6627 & 0.050297 \tabularnewline
24 & 0.031114 & 0.2676 & 0.394857 \tabularnewline
25 & -0.046648 & -0.4013 & 0.344685 \tabularnewline
26 & 0.052112 & 0.4483 & 0.327629 \tabularnewline
27 & 0.06414 & 0.5518 & 0.291389 \tabularnewline
28 & -0.025729 & -0.2213 & 0.412724 \tabularnewline
29 & -0.17852 & -1.5357 & 0.06444 \tabularnewline
30 & -0.114067 & -0.9812 & 0.164835 \tabularnewline
31 & -0.058452 & -0.5028 & 0.30829 \tabularnewline
32 & -0.075229 & -0.6471 & 0.259771 \tabularnewline
33 & -0.152835 & -1.3147 & 0.09633 \tabularnewline
34 & -0.107192 & -0.9221 & 0.179735 \tabularnewline
35 & 0.051062 & 0.4392 & 0.330881 \tabularnewline
36 & -0.038887 & -0.3345 & 0.369468 \tabularnewline
37 & -0.110173 & -0.9477 & 0.173172 \tabularnewline
38 & -0.12587 & -1.0828 & 0.141213 \tabularnewline
39 & 0.099671 & 0.8574 & 0.196996 \tabularnewline
40 & 0.065595 & 0.5643 & 0.287138 \tabularnewline
41 & -0.108144 & -0.9303 & 0.177623 \tabularnewline
42 & -0.056354 & -0.4848 & 0.314634 \tabularnewline
43 & -0.060565 & -0.521 & 0.30196 \tabularnewline
44 & -0.085318 & -0.7339 & 0.232653 \tabularnewline
45 & -0.008795 & -0.0757 & 0.469948 \tabularnewline
46 & -0.092799 & -0.7983 & 0.21363 \tabularnewline
47 & 0.039279 & 0.3379 & 0.368202 \tabularnewline
48 & -0.004606 & -0.0396 & 0.484252 \tabularnewline
\hline
\end{tabular}
%Source: https://freestatistics.org/blog/index.php?pk=122400&T=2

[TABLE]
[ROW][C]Partial Autocorrelation Function[/C][/ROW]
[ROW][C]Time lag k[/C][C]PACF(k)[/C][C]T-STAT[/C][C]P-value[/C][/ROW]
[ROW][C]1[/C][C]0.302703[/C][C]2.604[/C][C]0.005565[/C][/ROW]
[ROW][C]2[/C][C]-0.120618[/C][C]-1.0376[/C][C]0.151419[/C][/ROW]
[ROW][C]3[/C][C]0.189285[/C][C]1.6283[/C][C]0.053857[/C][/ROW]
[ROW][C]4[/C][C]-0.07418[/C][C]-0.6381[/C][C]0.262683[/C][/ROW]
[ROW][C]5[/C][C]0.012911[/C][C]0.1111[/C][C]0.455932[/C][/ROW]
[ROW][C]6[/C][C]-0.05018[/C][C]-0.4317[/C][C]0.333621[/C][/ROW]
[ROW][C]7[/C][C]-0.270911[/C][C]-2.3305[/C][C]0.011255[/C][/ROW]
[ROW][C]8[/C][C]-0.020285[/C][C]-0.1745[/C][C]0.430974[/C][/ROW]
[ROW][C]9[/C][C]-0.145311[/C][C]-1.25[/C][C]0.107616[/C][/ROW]
[ROW][C]10[/C][C]-0.065605[/C][C]-0.5644[/C][C]0.287108[/C][/ROW]
[ROW][C]11[/C][C]-0.074947[/C][C]-0.6447[/C][C]0.260551[/C][/ROW]
[ROW][C]12[/C][C]-0.133773[/C][C]-1.1508[/C][C]0.126768[/C][/ROW]
[ROW][C]13[/C][C]-0.046331[/C][C]-0.3986[/C][C]0.345684[/C][/ROW]
[ROW][C]14[/C][C]-0.028914[/C][C]-0.2487[/C][C]0.40213[/C][/ROW]
[ROW][C]15[/C][C]0.136232[/C][C]1.1719[/C][C]0.122496[/C][/ROW]
[ROW][C]16[/C][C]0.117164[/C][C]1.0079[/C][C]0.158397[/C][/ROW]
[ROW][C]17[/C][C]-0.121931[/C][C]-1.0489[/C][C]0.14882[/C][/ROW]
[ROW][C]18[/C][C]0.079043[/C][C]0.68[/C][C]0.249327[/C][/ROW]
[ROW][C]19[/C][C]0.042472[/C][C]0.3654[/C][C]0.357944[/C][/ROW]
[ROW][C]20[/C][C]-0.047687[/C][C]-0.4102[/C][C]0.341414[/C][/ROW]
[ROW][C]21[/C][C]-0.030884[/C][C]-0.2657[/C][C]0.395614[/C][/ROW]
[ROW][C]22[/C][C]0.010432[/C][C]0.0897[/C][C]0.464369[/C][/ROW]
[ROW][C]23[/C][C]-0.19329[/C][C]-1.6627[/C][C]0.050297[/C][/ROW]
[ROW][C]24[/C][C]0.031114[/C][C]0.2676[/C][C]0.394857[/C][/ROW]
[ROW][C]25[/C][C]-0.046648[/C][C]-0.4013[/C][C]0.344685[/C][/ROW]
[ROW][C]26[/C][C]0.052112[/C][C]0.4483[/C][C]0.327629[/C][/ROW]
[ROW][C]27[/C][C]0.06414[/C][C]0.5518[/C][C]0.291389[/C][/ROW]
[ROW][C]28[/C][C]-0.025729[/C][C]-0.2213[/C][C]0.412724[/C][/ROW]
[ROW][C]29[/C][C]-0.17852[/C][C]-1.5357[/C][C]0.06444[/C][/ROW]
[ROW][C]30[/C][C]-0.114067[/C][C]-0.9812[/C][C]0.164835[/C][/ROW]
[ROW][C]31[/C][C]-0.058452[/C][C]-0.5028[/C][C]0.30829[/C][/ROW]
[ROW][C]32[/C][C]-0.075229[/C][C]-0.6471[/C][C]0.259771[/C][/ROW]
[ROW][C]33[/C][C]-0.152835[/C][C]-1.3147[/C][C]0.09633[/C][/ROW]
[ROW][C]34[/C][C]-0.107192[/C][C]-0.9221[/C][C]0.179735[/C][/ROW]
[ROW][C]35[/C][C]0.051062[/C][C]0.4392[/C][C]0.330881[/C][/ROW]
[ROW][C]36[/C][C]-0.038887[/C][C]-0.3345[/C][C]0.369468[/C][/ROW]
[ROW][C]37[/C][C]-0.110173[/C][C]-0.9477[/C][C]0.173172[/C][/ROW]
[ROW][C]38[/C][C]-0.12587[/C][C]-1.0828[/C][C]0.141213[/C][/ROW]
[ROW][C]39[/C][C]0.099671[/C][C]0.8574[/C][C]0.196996[/C][/ROW]
[ROW][C]40[/C][C]0.065595[/C][C]0.5643[/C][C]0.287138[/C][/ROW]
[ROW][C]41[/C][C]-0.108144[/C][C]-0.9303[/C][C]0.177623[/C][/ROW]
[ROW][C]42[/C][C]-0.056354[/C][C]-0.4848[/C][C]0.314634[/C][/ROW]
[ROW][C]43[/C][C]-0.060565[/C][C]-0.521[/C][C]0.30196[/C][/ROW]
[ROW][C]44[/C][C]-0.085318[/C][C]-0.7339[/C][C]0.232653[/C][/ROW]
[ROW][C]45[/C][C]-0.008795[/C][C]-0.0757[/C][C]0.469948[/C][/ROW]
[ROW][C]46[/C][C]-0.092799[/C][C]-0.7983[/C][C]0.21363[/C][/ROW]
[ROW][C]47[/C][C]0.039279[/C][C]0.3379[/C][C]0.368202[/C][/ROW]
[ROW][C]48[/C][C]-0.004606[/C][C]-0.0396[/C][C]0.484252[/C][/ROW]
[/TABLE]
Source: https://freestatistics.org/blog/index.php?pk=122400&T=2

Globally Unique Identifier (entire table): ba.freestatistics.org/blog/index.php?pk=122400&T=2

As an alternative you can also use a QR Code:  

The GUIDs for individual cells are displayed in the table below:

Partial Autocorrelation Function
Time lag kPACF(k)T-STATP-value
10.3027032.6040.005565
2-0.120618-1.03760.151419
30.1892851.62830.053857
4-0.07418-0.63810.262683
50.0129110.11110.455932
6-0.05018-0.43170.333621
7-0.270911-2.33050.011255
8-0.020285-0.17450.430974
9-0.145311-1.250.107616
10-0.065605-0.56440.287108
11-0.074947-0.64470.260551
12-0.133773-1.15080.126768
13-0.046331-0.39860.345684
14-0.028914-0.24870.40213
150.1362321.17190.122496
160.1171641.00790.158397
17-0.121931-1.04890.14882
180.0790430.680.249327
190.0424720.36540.357944
20-0.047687-0.41020.341414
21-0.030884-0.26570.395614
220.0104320.08970.464369
23-0.19329-1.66270.050297
240.0311140.26760.394857
25-0.046648-0.40130.344685
260.0521120.44830.327629
270.064140.55180.291389
28-0.025729-0.22130.412724
29-0.17852-1.53570.06444
30-0.114067-0.98120.164835
31-0.058452-0.50280.30829
32-0.075229-0.64710.259771
33-0.152835-1.31470.09633
34-0.107192-0.92210.179735
350.0510620.43920.330881
36-0.038887-0.33450.369468
37-0.110173-0.94770.173172
38-0.12587-1.08280.141213
390.0996710.85740.196996
400.0655950.56430.287138
41-0.108144-0.93030.177623
42-0.056354-0.48480.314634
43-0.060565-0.5210.30196
44-0.085318-0.73390.232653
45-0.008795-0.07570.469948
46-0.092799-0.79830.21363
470.0392790.33790.368202
48-0.004606-0.03960.484252


Parameters (Session):
par1 = 72 ;
Parameters (R input):
par1 = 48 ; par2 = 1 ; par3 = 1 ; par4 = 0 ; par5 = 12 ; par6 = White Noise ; par7 = 0.95 ; par8 = ;
R code (references can be found in the software module):
if (par1 == 'Default') {
par1 = 10*log10(length(x))
} else {
par1 <- as.numeric(par1)
}
par2 <- as.numeric(par2)
par3 <- as.numeric(par3)
par4 <- as.numeric(par4)
par5 <- as.numeric(par5)
if (par6 == 'White Noise') par6 <- 'white' else par6 <- 'ma'
par7 <- as.numeric(par7)
if (par8 != '') par8 <- as.numeric(par8)
ox <- x
if (par8 == '') {
if (par2 == 0) {
x <- log(x)
} else {
x <- (x ^ par2 - 1) / par2
}
} else {
x <- log(x,base=par8)
}
if (par3 > 0) x <- diff(x,lag=1,difference=par3)
if (par4 > 0) x <- diff(x,lag=par5,difference=par4)
bitmap(file='picts.png')
op <- par(mfrow=c(2,1))
plot(ox,type='l',main='Original Time Series',xlab='time',ylab='value')
if (par8=='') {
mytitle <- paste('Working Time Series (lambda=',par2,', d=',par3,', D=',par4,')',sep='')
mysub <- paste('(lambda=',par2,', d=',par3,', D=',par4,', CI=', par7, ', CI type=',par6,')',sep='')
} else {
mytitle <- paste('Working Time Series (base=',par8,', d=',par3,', D=',par4,')',sep='')
mysub <- paste('(base=',par8,', d=',par3,', D=',par4,', CI=', par7, ', CI type=',par6,')',sep='')
}
plot(x,type='l', main=mytitle,xlab='time',ylab='value')
par(op)
dev.off()
bitmap(file='pic1.png')
racf <- acf(x, par1, main='Autocorrelation', xlab='time lag', ylab='ACF', ci.type=par6, ci=par7, sub=mysub)
dev.off()
bitmap(file='pic2.png')
rpacf <- pacf(x,par1,main='Partial Autocorrelation',xlab='lags',ylab='PACF',sub=mysub)
dev.off()
(myacf <- c(racf$acf))
(mypacf <- c(rpacf$acf))
lengthx <- length(x)
sqrtn <- sqrt(lengthx)
load(file='createtable')
a<-table.start()
a<-table.row.start(a)
a<-table.element(a,'Autocorrelation Function',4,TRUE)
a<-table.row.end(a)
a<-table.row.start(a)
a<-table.element(a,'Time lag k',header=TRUE)
a<-table.element(a,hyperlink('basics.htm','ACF(k)','click here for more information about the Autocorrelation Function'),header=TRUE)
a<-table.element(a,'T-STAT',header=TRUE)
a<-table.element(a,'P-value',header=TRUE)
a<-table.row.end(a)
for (i in 2:(par1+1)) {
a<-table.row.start(a)
a<-table.element(a,i-1,header=TRUE)
a<-table.element(a,round(myacf[i],6))
mytstat <- myacf[i]*sqrtn
a<-table.element(a,round(mytstat,4))
a<-table.element(a,round(1-pt(abs(mytstat),lengthx),6))
a<-table.row.end(a)
}
a<-table.end(a)
table.save(a,file='mytable.tab')
a<-table.start()
a<-table.row.start(a)
a<-table.element(a,'Partial Autocorrelation Function',4,TRUE)
a<-table.row.end(a)
a<-table.row.start(a)
a<-table.element(a,'Time lag k',header=TRUE)
a<-table.element(a,hyperlink('basics.htm','PACF(k)','click here for more information about the Partial Autocorrelation Function'),header=TRUE)
a<-table.element(a,'T-STAT',header=TRUE)
a<-table.element(a,'P-value',header=TRUE)
a<-table.row.end(a)
for (i in 1:par1) {
a<-table.row.start(a)
a<-table.element(a,i,header=TRUE)
a<-table.element(a,round(mypacf[i],6))
mytstat <- mypacf[i]*sqrtn
a<-table.element(a,round(mytstat,4))
a<-table.element(a,round(1-pt(abs(mytstat),lengthx),6))
a<-table.row.end(a)
}
a<-table.end(a)
table.save(a,file='mytable1.tab')