Free Statistics

of Irreproducible Research!

Author's title

Author*Unverified author*
R Software Modulerwasp_autocorrelation.wasp
Title produced by software(Partial) Autocorrelation Function
Date of computationFri, 20 May 2011 04:13:08 +0000
Cite this page as followsStatistical Computations at FreeStatistics.org, Office for Research Development and Education, URL https://freestatistics.org/blog/index.php?v=date/2011/May/20/t1305864579fkt00weh5gr3wl9.htm/, Retrieved Mon, 13 May 2024 19:30:15 +0000
Statistical Computations at FreeStatistics.org, Office for Research Development and Education, URL https://freestatistics.org/blog/index.php?pk=122397, Retrieved Mon, 13 May 2024 19:30:15 +0000
QR Codes:

Original text written by user:
IsPrivate?No (this computation is public)
User-defined keywordsKDGP2W12
Estimated Impact92
Family? (F = Feedback message, R = changed R code, M = changed R Module, P = changed Parameters, D = changed Data)
-     [(Partial) Autocorrelation Function] [Autocorrelation -...] [2010-01-25 18:02:00] [7723ae71f48a5adc5e785905b449f94f]
- R PD    [(Partial) Autocorrelation Function] [] [2011-05-20 04:13:08] [25018b84afebffe8bc31ee5ed84cfeb9] [Current]
Feedback Forum

Post a new message
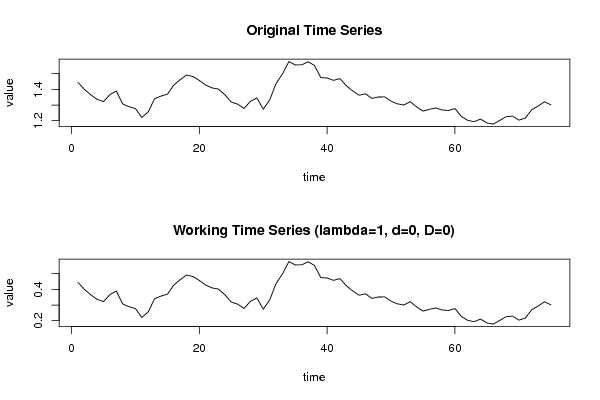
Dataseries X:
1,4442
1,3999
1,3649
1,336
1,322
1,3661
1,3898
1,3067
1,2894
1,277
1,2208
1,2565
1,3406
1,3569
1,3686
1,4272
1,4614
1,4914
1,4816
1,4562
1,4268
1,4088
1,4016
1,365
1,319
1,305
1,2785
1,3239
1,3449
1,2732
1,3322
1,4369
1,4975
1,577
1,5553
1,5557
1,575
1,5527
1,4748
1,4718
1,457
1,4684
1,4227
1,3896
1,3622
1,3716
1,3419
1,3511
1,3516
1,3242
1,3074
1,2999
1,3213
1,2881
1,2611
1,2727
1,2811
1,2684
1,265
1,277
1,2271
1,202
1,1938
1,2103
1,1856
1,1786
1,2015
1,2256
1,2292
1,2037
1,2165
1,2694
1,2938
1,3201
1,3014


Summary of computational transaction
Raw Inputview raw input (R code)
Raw Outputview raw output of R engine
Computing time2 seconds
R Server'Sir Ronald Aylmer Fisher' @ 193.190.124.24

\begin{tabular}{lllllllll}
\hline
Summary of computational transaction \tabularnewline
Raw Input & view raw input (R code)  \tabularnewline
Raw Output & view raw output of R engine  \tabularnewline
Computing time & 2 seconds \tabularnewline
R Server & 'Sir Ronald Aylmer Fisher' @ 193.190.124.24 \tabularnewline
\hline
\end{tabular}
%Source: https://freestatistics.org/blog/index.php?pk=122397&T=0

[TABLE]
[ROW][C]Summary of computational transaction[/C][/ROW]
[ROW][C]Raw Input[/C][C]view raw input (R code) [/C][/ROW]
[ROW][C]Raw Output[/C][C]view raw output of R engine [/C][/ROW]
[ROW][C]Computing time[/C][C]2 seconds[/C][/ROW]
[ROW][C]R Server[/C][C]'Sir Ronald Aylmer Fisher' @ 193.190.124.24[/C][/ROW]
[/TABLE]
Source: https://freestatistics.org/blog/index.php?pk=122397&T=0

Globally Unique Identifier (entire table): ba.freestatistics.org/blog/index.php?pk=122397&T=0

As an alternative you can also use a QR Code:  

The GUIDs for individual cells are displayed in the table below:

Summary of computational transaction
Raw Inputview raw input (R code)
Raw Outputview raw output of R engine
Computing time2 seconds
R Server'Sir Ronald Aylmer Fisher' @ 193.190.124.24


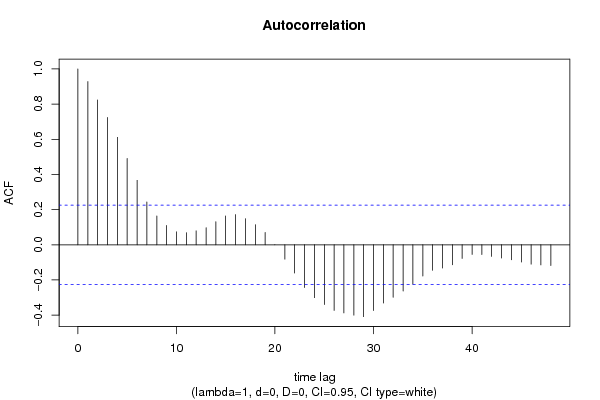
Autocorrelation Function
Time lag kACF(k)T-STATP-value
10.927948.03620
20.8236797.13330
30.7245066.27440
40.6111645.29281e-06
50.490744.24993e-05
60.3665263.17420.00109
70.2438782.1120.019006
80.1642561.42250.079514
90.1102740.9550.171322
100.0737840.6390.262388
110.0685730.59390.277195
120.0792820.68660.247226
130.0976280.84550.200264
140.1309821.13430.130134
150.1634281.41530.080556
160.1717631.48750.070536
170.1480351.2820.101892
180.1139310.98670.163487
190.0698520.60490.273525
20-0.000482-0.00420.498342
21-0.081714-0.70770.240672
22-0.160621-1.3910.084167
23-0.242888-2.10350.019389
24-0.300526-2.60260.005572
25-0.339784-2.94260.002164
26-0.372951-3.22980.00092
27-0.387239-3.35360.000627
28-0.399933-3.46350.000442
29-0.408554-3.53820.000348
30-0.374251-3.24110.000888
31-0.331526-2.87110.002657
32-0.298911-2.58860.005783
33-0.263389-2.2810.012694
34-0.22363-1.93670.028275
35-0.177447-1.53670.064283
36-0.144875-1.25470.106751
37-0.132551-1.14790.127323
38-0.113325-0.98140.16477
39-0.077271-0.66920.252716
40-0.054438-0.47140.319345
41-0.054796-0.47450.318245
42-0.066103-0.57250.284358
43-0.075116-0.65050.258672
44-0.08544-0.73990.230827
45-0.097498-0.84440.200578
46-0.109992-0.95260.171938
47-0.114424-0.99090.16245
48-0.118077-1.02260.154898

\begin{tabular}{lllllllll}
\hline
Autocorrelation Function \tabularnewline
Time lag k & ACF(k) & T-STAT & P-value \tabularnewline
1 & 0.92794 & 8.0362 & 0 \tabularnewline
2 & 0.823679 & 7.1333 & 0 \tabularnewline
3 & 0.724506 & 6.2744 & 0 \tabularnewline
4 & 0.611164 & 5.2928 & 1e-06 \tabularnewline
5 & 0.49074 & 4.2499 & 3e-05 \tabularnewline
6 & 0.366526 & 3.1742 & 0.00109 \tabularnewline
7 & 0.243878 & 2.112 & 0.019006 \tabularnewline
8 & 0.164256 & 1.4225 & 0.079514 \tabularnewline
9 & 0.110274 & 0.955 & 0.171322 \tabularnewline
10 & 0.073784 & 0.639 & 0.262388 \tabularnewline
11 & 0.068573 & 0.5939 & 0.277195 \tabularnewline
12 & 0.079282 & 0.6866 & 0.247226 \tabularnewline
13 & 0.097628 & 0.8455 & 0.200264 \tabularnewline
14 & 0.130982 & 1.1343 & 0.130134 \tabularnewline
15 & 0.163428 & 1.4153 & 0.080556 \tabularnewline
16 & 0.171763 & 1.4875 & 0.070536 \tabularnewline
17 & 0.148035 & 1.282 & 0.101892 \tabularnewline
18 & 0.113931 & 0.9867 & 0.163487 \tabularnewline
19 & 0.069852 & 0.6049 & 0.273525 \tabularnewline
20 & -0.000482 & -0.0042 & 0.498342 \tabularnewline
21 & -0.081714 & -0.7077 & 0.240672 \tabularnewline
22 & -0.160621 & -1.391 & 0.084167 \tabularnewline
23 & -0.242888 & -2.1035 & 0.019389 \tabularnewline
24 & -0.300526 & -2.6026 & 0.005572 \tabularnewline
25 & -0.339784 & -2.9426 & 0.002164 \tabularnewline
26 & -0.372951 & -3.2298 & 0.00092 \tabularnewline
27 & -0.387239 & -3.3536 & 0.000627 \tabularnewline
28 & -0.399933 & -3.4635 & 0.000442 \tabularnewline
29 & -0.408554 & -3.5382 & 0.000348 \tabularnewline
30 & -0.374251 & -3.2411 & 0.000888 \tabularnewline
31 & -0.331526 & -2.8711 & 0.002657 \tabularnewline
32 & -0.298911 & -2.5886 & 0.005783 \tabularnewline
33 & -0.263389 & -2.281 & 0.012694 \tabularnewline
34 & -0.22363 & -1.9367 & 0.028275 \tabularnewline
35 & -0.177447 & -1.5367 & 0.064283 \tabularnewline
36 & -0.144875 & -1.2547 & 0.106751 \tabularnewline
37 & -0.132551 & -1.1479 & 0.127323 \tabularnewline
38 & -0.113325 & -0.9814 & 0.16477 \tabularnewline
39 & -0.077271 & -0.6692 & 0.252716 \tabularnewline
40 & -0.054438 & -0.4714 & 0.319345 \tabularnewline
41 & -0.054796 & -0.4745 & 0.318245 \tabularnewline
42 & -0.066103 & -0.5725 & 0.284358 \tabularnewline
43 & -0.075116 & -0.6505 & 0.258672 \tabularnewline
44 & -0.08544 & -0.7399 & 0.230827 \tabularnewline
45 & -0.097498 & -0.8444 & 0.200578 \tabularnewline
46 & -0.109992 & -0.9526 & 0.171938 \tabularnewline
47 & -0.114424 & -0.9909 & 0.16245 \tabularnewline
48 & -0.118077 & -1.0226 & 0.154898 \tabularnewline
\hline
\end{tabular}
%Source: https://freestatistics.org/blog/index.php?pk=122397&T=1

[TABLE]
[ROW][C]Autocorrelation Function[/C][/ROW]
[ROW][C]Time lag k[/C][C]ACF(k)[/C][C]T-STAT[/C][C]P-value[/C][/ROW]
[ROW][C]1[/C][C]0.92794[/C][C]8.0362[/C][C]0[/C][/ROW]
[ROW][C]2[/C][C]0.823679[/C][C]7.1333[/C][C]0[/C][/ROW]
[ROW][C]3[/C][C]0.724506[/C][C]6.2744[/C][C]0[/C][/ROW]
[ROW][C]4[/C][C]0.611164[/C][C]5.2928[/C][C]1e-06[/C][/ROW]
[ROW][C]5[/C][C]0.49074[/C][C]4.2499[/C][C]3e-05[/C][/ROW]
[ROW][C]6[/C][C]0.366526[/C][C]3.1742[/C][C]0.00109[/C][/ROW]
[ROW][C]7[/C][C]0.243878[/C][C]2.112[/C][C]0.019006[/C][/ROW]
[ROW][C]8[/C][C]0.164256[/C][C]1.4225[/C][C]0.079514[/C][/ROW]
[ROW][C]9[/C][C]0.110274[/C][C]0.955[/C][C]0.171322[/C][/ROW]
[ROW][C]10[/C][C]0.073784[/C][C]0.639[/C][C]0.262388[/C][/ROW]
[ROW][C]11[/C][C]0.068573[/C][C]0.5939[/C][C]0.277195[/C][/ROW]
[ROW][C]12[/C][C]0.079282[/C][C]0.6866[/C][C]0.247226[/C][/ROW]
[ROW][C]13[/C][C]0.097628[/C][C]0.8455[/C][C]0.200264[/C][/ROW]
[ROW][C]14[/C][C]0.130982[/C][C]1.1343[/C][C]0.130134[/C][/ROW]
[ROW][C]15[/C][C]0.163428[/C][C]1.4153[/C][C]0.080556[/C][/ROW]
[ROW][C]16[/C][C]0.171763[/C][C]1.4875[/C][C]0.070536[/C][/ROW]
[ROW][C]17[/C][C]0.148035[/C][C]1.282[/C][C]0.101892[/C][/ROW]
[ROW][C]18[/C][C]0.113931[/C][C]0.9867[/C][C]0.163487[/C][/ROW]
[ROW][C]19[/C][C]0.069852[/C][C]0.6049[/C][C]0.273525[/C][/ROW]
[ROW][C]20[/C][C]-0.000482[/C][C]-0.0042[/C][C]0.498342[/C][/ROW]
[ROW][C]21[/C][C]-0.081714[/C][C]-0.7077[/C][C]0.240672[/C][/ROW]
[ROW][C]22[/C][C]-0.160621[/C][C]-1.391[/C][C]0.084167[/C][/ROW]
[ROW][C]23[/C][C]-0.242888[/C][C]-2.1035[/C][C]0.019389[/C][/ROW]
[ROW][C]24[/C][C]-0.300526[/C][C]-2.6026[/C][C]0.005572[/C][/ROW]
[ROW][C]25[/C][C]-0.339784[/C][C]-2.9426[/C][C]0.002164[/C][/ROW]
[ROW][C]26[/C][C]-0.372951[/C][C]-3.2298[/C][C]0.00092[/C][/ROW]
[ROW][C]27[/C][C]-0.387239[/C][C]-3.3536[/C][C]0.000627[/C][/ROW]
[ROW][C]28[/C][C]-0.399933[/C][C]-3.4635[/C][C]0.000442[/C][/ROW]
[ROW][C]29[/C][C]-0.408554[/C][C]-3.5382[/C][C]0.000348[/C][/ROW]
[ROW][C]30[/C][C]-0.374251[/C][C]-3.2411[/C][C]0.000888[/C][/ROW]
[ROW][C]31[/C][C]-0.331526[/C][C]-2.8711[/C][C]0.002657[/C][/ROW]
[ROW][C]32[/C][C]-0.298911[/C][C]-2.5886[/C][C]0.005783[/C][/ROW]
[ROW][C]33[/C][C]-0.263389[/C][C]-2.281[/C][C]0.012694[/C][/ROW]
[ROW][C]34[/C][C]-0.22363[/C][C]-1.9367[/C][C]0.028275[/C][/ROW]
[ROW][C]35[/C][C]-0.177447[/C][C]-1.5367[/C][C]0.064283[/C][/ROW]
[ROW][C]36[/C][C]-0.144875[/C][C]-1.2547[/C][C]0.106751[/C][/ROW]
[ROW][C]37[/C][C]-0.132551[/C][C]-1.1479[/C][C]0.127323[/C][/ROW]
[ROW][C]38[/C][C]-0.113325[/C][C]-0.9814[/C][C]0.16477[/C][/ROW]
[ROW][C]39[/C][C]-0.077271[/C][C]-0.6692[/C][C]0.252716[/C][/ROW]
[ROW][C]40[/C][C]-0.054438[/C][C]-0.4714[/C][C]0.319345[/C][/ROW]
[ROW][C]41[/C][C]-0.054796[/C][C]-0.4745[/C][C]0.318245[/C][/ROW]
[ROW][C]42[/C][C]-0.066103[/C][C]-0.5725[/C][C]0.284358[/C][/ROW]
[ROW][C]43[/C][C]-0.075116[/C][C]-0.6505[/C][C]0.258672[/C][/ROW]
[ROW][C]44[/C][C]-0.08544[/C][C]-0.7399[/C][C]0.230827[/C][/ROW]
[ROW][C]45[/C][C]-0.097498[/C][C]-0.8444[/C][C]0.200578[/C][/ROW]
[ROW][C]46[/C][C]-0.109992[/C][C]-0.9526[/C][C]0.171938[/C][/ROW]
[ROW][C]47[/C][C]-0.114424[/C][C]-0.9909[/C][C]0.16245[/C][/ROW]
[ROW][C]48[/C][C]-0.118077[/C][C]-1.0226[/C][C]0.154898[/C][/ROW]
[/TABLE]
Source: https://freestatistics.org/blog/index.php?pk=122397&T=1

Globally Unique Identifier (entire table): ba.freestatistics.org/blog/index.php?pk=122397&T=1

As an alternative you can also use a QR Code:  

The GUIDs for individual cells are displayed in the table below:

Autocorrelation Function
Time lag kACF(k)T-STATP-value
10.927948.03620
20.8236797.13330
30.7245066.27440
40.6111645.29281e-06
50.490744.24993e-05
60.3665263.17420.00109
70.2438782.1120.019006
80.1642561.42250.079514
90.1102740.9550.171322
100.0737840.6390.262388
110.0685730.59390.277195
120.0792820.68660.247226
130.0976280.84550.200264
140.1309821.13430.130134
150.1634281.41530.080556
160.1717631.48750.070536
170.1480351.2820.101892
180.1139310.98670.163487
190.0698520.60490.273525
20-0.000482-0.00420.498342
21-0.081714-0.70770.240672
22-0.160621-1.3910.084167
23-0.242888-2.10350.019389
24-0.300526-2.60260.005572
25-0.339784-2.94260.002164
26-0.372951-3.22980.00092
27-0.387239-3.35360.000627
28-0.399933-3.46350.000442
29-0.408554-3.53820.000348
30-0.374251-3.24110.000888
31-0.331526-2.87110.002657
32-0.298911-2.58860.005783
33-0.263389-2.2810.012694
34-0.22363-1.93670.028275
35-0.177447-1.53670.064283
36-0.144875-1.25470.106751
37-0.132551-1.14790.127323
38-0.113325-0.98140.16477
39-0.077271-0.66920.252716
40-0.054438-0.47140.319345
41-0.054796-0.47450.318245
42-0.066103-0.57250.284358
43-0.075116-0.65050.258672
44-0.08544-0.73990.230827
45-0.097498-0.84440.200578
46-0.109992-0.95260.171938
47-0.114424-0.99090.16245
48-0.118077-1.02260.154898


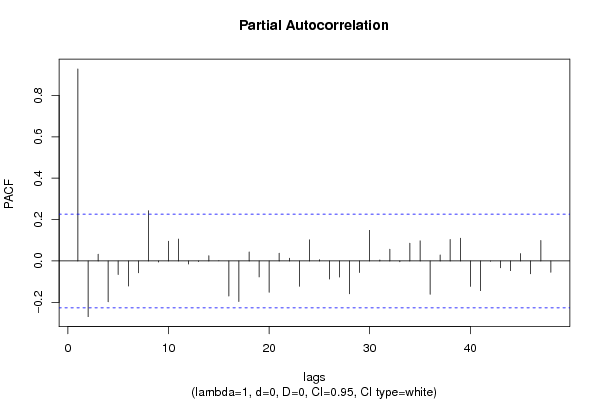
Partial Autocorrelation Function
Time lag kPACF(k)T-STATP-value
10.927948.03620
2-0.269161-2.3310.011221
30.0327490.28360.388745
4-0.197291-1.70860.045831
5-0.065825-0.57010.285171
6-0.121388-1.05130.148258
7-0.056882-0.49260.311862
80.2428622.10320.019399
9-0.005174-0.04480.482188
100.0957030.82880.204921
110.105550.91410.181799
12-0.014938-0.12940.448708
13-0.002353-0.02040.4919
140.025260.21880.413717
15-0.000239-0.00210.499178
16-0.169061-1.46410.073671
17-0.195756-1.69530.047083
180.0434660.37640.353831
19-0.076931-0.66620.253649
20-0.151184-1.30930.097216
210.0375330.3250.373027
220.0134530.11650.453781
23-0.121996-1.05650.147061
240.1019050.88250.190158
250.0055990.04850.480728
26-0.087164-0.75490.226348
27-0.077698-0.67290.251545
28-0.158758-1.37490.08663
29-0.055724-0.48260.315398
300.1479941.28170.101955
310.004410.03820.484818
320.0570410.4940.311378
33-0.003587-0.03110.487651
340.0858750.74370.22969
350.0970530.84050.201648
36-0.16102-1.39450.083646
370.0286980.24850.402202
380.103540.89670.186379
390.1102020.95440.171479
40-0.123037-1.06550.145027
41-0.143596-1.24360.108764
42-0.001485-0.01290.494886
43-0.032555-0.28190.389385
44-0.047009-0.40710.342544
450.0354910.30740.379712
46-0.062272-0.53930.295643
470.0986590.85440.197799
48-0.054347-0.47070.319626

\begin{tabular}{lllllllll}
\hline
Partial Autocorrelation Function \tabularnewline
Time lag k & PACF(k) & T-STAT & P-value \tabularnewline
1 & 0.92794 & 8.0362 & 0 \tabularnewline
2 & -0.269161 & -2.331 & 0.011221 \tabularnewline
3 & 0.032749 & 0.2836 & 0.388745 \tabularnewline
4 & -0.197291 & -1.7086 & 0.045831 \tabularnewline
5 & -0.065825 & -0.5701 & 0.285171 \tabularnewline
6 & -0.121388 & -1.0513 & 0.148258 \tabularnewline
7 & -0.056882 & -0.4926 & 0.311862 \tabularnewline
8 & 0.242862 & 2.1032 & 0.019399 \tabularnewline
9 & -0.005174 & -0.0448 & 0.482188 \tabularnewline
10 & 0.095703 & 0.8288 & 0.204921 \tabularnewline
11 & 0.10555 & 0.9141 & 0.181799 \tabularnewline
12 & -0.014938 & -0.1294 & 0.448708 \tabularnewline
13 & -0.002353 & -0.0204 & 0.4919 \tabularnewline
14 & 0.02526 & 0.2188 & 0.413717 \tabularnewline
15 & -0.000239 & -0.0021 & 0.499178 \tabularnewline
16 & -0.169061 & -1.4641 & 0.073671 \tabularnewline
17 & -0.195756 & -1.6953 & 0.047083 \tabularnewline
18 & 0.043466 & 0.3764 & 0.353831 \tabularnewline
19 & -0.076931 & -0.6662 & 0.253649 \tabularnewline
20 & -0.151184 & -1.3093 & 0.097216 \tabularnewline
21 & 0.037533 & 0.325 & 0.373027 \tabularnewline
22 & 0.013453 & 0.1165 & 0.453781 \tabularnewline
23 & -0.121996 & -1.0565 & 0.147061 \tabularnewline
24 & 0.101905 & 0.8825 & 0.190158 \tabularnewline
25 & 0.005599 & 0.0485 & 0.480728 \tabularnewline
26 & -0.087164 & -0.7549 & 0.226348 \tabularnewline
27 & -0.077698 & -0.6729 & 0.251545 \tabularnewline
28 & -0.158758 & -1.3749 & 0.08663 \tabularnewline
29 & -0.055724 & -0.4826 & 0.315398 \tabularnewline
30 & 0.147994 & 1.2817 & 0.101955 \tabularnewline
31 & 0.00441 & 0.0382 & 0.484818 \tabularnewline
32 & 0.057041 & 0.494 & 0.311378 \tabularnewline
33 & -0.003587 & -0.0311 & 0.487651 \tabularnewline
34 & 0.085875 & 0.7437 & 0.22969 \tabularnewline
35 & 0.097053 & 0.8405 & 0.201648 \tabularnewline
36 & -0.16102 & -1.3945 & 0.083646 \tabularnewline
37 & 0.028698 & 0.2485 & 0.402202 \tabularnewline
38 & 0.10354 & 0.8967 & 0.186379 \tabularnewline
39 & 0.110202 & 0.9544 & 0.171479 \tabularnewline
40 & -0.123037 & -1.0655 & 0.145027 \tabularnewline
41 & -0.143596 & -1.2436 & 0.108764 \tabularnewline
42 & -0.001485 & -0.0129 & 0.494886 \tabularnewline
43 & -0.032555 & -0.2819 & 0.389385 \tabularnewline
44 & -0.047009 & -0.4071 & 0.342544 \tabularnewline
45 & 0.035491 & 0.3074 & 0.379712 \tabularnewline
46 & -0.062272 & -0.5393 & 0.295643 \tabularnewline
47 & 0.098659 & 0.8544 & 0.197799 \tabularnewline
48 & -0.054347 & -0.4707 & 0.319626 \tabularnewline
\hline
\end{tabular}
%Source: https://freestatistics.org/blog/index.php?pk=122397&T=2

[TABLE]
[ROW][C]Partial Autocorrelation Function[/C][/ROW]
[ROW][C]Time lag k[/C][C]PACF(k)[/C][C]T-STAT[/C][C]P-value[/C][/ROW]
[ROW][C]1[/C][C]0.92794[/C][C]8.0362[/C][C]0[/C][/ROW]
[ROW][C]2[/C][C]-0.269161[/C][C]-2.331[/C][C]0.011221[/C][/ROW]
[ROW][C]3[/C][C]0.032749[/C][C]0.2836[/C][C]0.388745[/C][/ROW]
[ROW][C]4[/C][C]-0.197291[/C][C]-1.7086[/C][C]0.045831[/C][/ROW]
[ROW][C]5[/C][C]-0.065825[/C][C]-0.5701[/C][C]0.285171[/C][/ROW]
[ROW][C]6[/C][C]-0.121388[/C][C]-1.0513[/C][C]0.148258[/C][/ROW]
[ROW][C]7[/C][C]-0.056882[/C][C]-0.4926[/C][C]0.311862[/C][/ROW]
[ROW][C]8[/C][C]0.242862[/C][C]2.1032[/C][C]0.019399[/C][/ROW]
[ROW][C]9[/C][C]-0.005174[/C][C]-0.0448[/C][C]0.482188[/C][/ROW]
[ROW][C]10[/C][C]0.095703[/C][C]0.8288[/C][C]0.204921[/C][/ROW]
[ROW][C]11[/C][C]0.10555[/C][C]0.9141[/C][C]0.181799[/C][/ROW]
[ROW][C]12[/C][C]-0.014938[/C][C]-0.1294[/C][C]0.448708[/C][/ROW]
[ROW][C]13[/C][C]-0.002353[/C][C]-0.0204[/C][C]0.4919[/C][/ROW]
[ROW][C]14[/C][C]0.02526[/C][C]0.2188[/C][C]0.413717[/C][/ROW]
[ROW][C]15[/C][C]-0.000239[/C][C]-0.0021[/C][C]0.499178[/C][/ROW]
[ROW][C]16[/C][C]-0.169061[/C][C]-1.4641[/C][C]0.073671[/C][/ROW]
[ROW][C]17[/C][C]-0.195756[/C][C]-1.6953[/C][C]0.047083[/C][/ROW]
[ROW][C]18[/C][C]0.043466[/C][C]0.3764[/C][C]0.353831[/C][/ROW]
[ROW][C]19[/C][C]-0.076931[/C][C]-0.6662[/C][C]0.253649[/C][/ROW]
[ROW][C]20[/C][C]-0.151184[/C][C]-1.3093[/C][C]0.097216[/C][/ROW]
[ROW][C]21[/C][C]0.037533[/C][C]0.325[/C][C]0.373027[/C][/ROW]
[ROW][C]22[/C][C]0.013453[/C][C]0.1165[/C][C]0.453781[/C][/ROW]
[ROW][C]23[/C][C]-0.121996[/C][C]-1.0565[/C][C]0.147061[/C][/ROW]
[ROW][C]24[/C][C]0.101905[/C][C]0.8825[/C][C]0.190158[/C][/ROW]
[ROW][C]25[/C][C]0.005599[/C][C]0.0485[/C][C]0.480728[/C][/ROW]
[ROW][C]26[/C][C]-0.087164[/C][C]-0.7549[/C][C]0.226348[/C][/ROW]
[ROW][C]27[/C][C]-0.077698[/C][C]-0.6729[/C][C]0.251545[/C][/ROW]
[ROW][C]28[/C][C]-0.158758[/C][C]-1.3749[/C][C]0.08663[/C][/ROW]
[ROW][C]29[/C][C]-0.055724[/C][C]-0.4826[/C][C]0.315398[/C][/ROW]
[ROW][C]30[/C][C]0.147994[/C][C]1.2817[/C][C]0.101955[/C][/ROW]
[ROW][C]31[/C][C]0.00441[/C][C]0.0382[/C][C]0.484818[/C][/ROW]
[ROW][C]32[/C][C]0.057041[/C][C]0.494[/C][C]0.311378[/C][/ROW]
[ROW][C]33[/C][C]-0.003587[/C][C]-0.0311[/C][C]0.487651[/C][/ROW]
[ROW][C]34[/C][C]0.085875[/C][C]0.7437[/C][C]0.22969[/C][/ROW]
[ROW][C]35[/C][C]0.097053[/C][C]0.8405[/C][C]0.201648[/C][/ROW]
[ROW][C]36[/C][C]-0.16102[/C][C]-1.3945[/C][C]0.083646[/C][/ROW]
[ROW][C]37[/C][C]0.028698[/C][C]0.2485[/C][C]0.402202[/C][/ROW]
[ROW][C]38[/C][C]0.10354[/C][C]0.8967[/C][C]0.186379[/C][/ROW]
[ROW][C]39[/C][C]0.110202[/C][C]0.9544[/C][C]0.171479[/C][/ROW]
[ROW][C]40[/C][C]-0.123037[/C][C]-1.0655[/C][C]0.145027[/C][/ROW]
[ROW][C]41[/C][C]-0.143596[/C][C]-1.2436[/C][C]0.108764[/C][/ROW]
[ROW][C]42[/C][C]-0.001485[/C][C]-0.0129[/C][C]0.494886[/C][/ROW]
[ROW][C]43[/C][C]-0.032555[/C][C]-0.2819[/C][C]0.389385[/C][/ROW]
[ROW][C]44[/C][C]-0.047009[/C][C]-0.4071[/C][C]0.342544[/C][/ROW]
[ROW][C]45[/C][C]0.035491[/C][C]0.3074[/C][C]0.379712[/C][/ROW]
[ROW][C]46[/C][C]-0.062272[/C][C]-0.5393[/C][C]0.295643[/C][/ROW]
[ROW][C]47[/C][C]0.098659[/C][C]0.8544[/C][C]0.197799[/C][/ROW]
[ROW][C]48[/C][C]-0.054347[/C][C]-0.4707[/C][C]0.319626[/C][/ROW]
[/TABLE]
Source: https://freestatistics.org/blog/index.php?pk=122397&T=2

Globally Unique Identifier (entire table): ba.freestatistics.org/blog/index.php?pk=122397&T=2

As an alternative you can also use a QR Code:  

The GUIDs for individual cells are displayed in the table below:

Partial Autocorrelation Function
Time lag kPACF(k)T-STATP-value
10.927948.03620
2-0.269161-2.3310.011221
30.0327490.28360.388745
4-0.197291-1.70860.045831
5-0.065825-0.57010.285171
6-0.121388-1.05130.148258
7-0.056882-0.49260.311862
80.2428622.10320.019399
9-0.005174-0.04480.482188
100.0957030.82880.204921
110.105550.91410.181799
12-0.014938-0.12940.448708
13-0.002353-0.02040.4919
140.025260.21880.413717
15-0.000239-0.00210.499178
16-0.169061-1.46410.073671
17-0.195756-1.69530.047083
180.0434660.37640.353831
19-0.076931-0.66620.253649
20-0.151184-1.30930.097216
210.0375330.3250.373027
220.0134530.11650.453781
23-0.121996-1.05650.147061
240.1019050.88250.190158
250.0055990.04850.480728
26-0.087164-0.75490.226348
27-0.077698-0.67290.251545
28-0.158758-1.37490.08663
29-0.055724-0.48260.315398
300.1479941.28170.101955
310.004410.03820.484818
320.0570410.4940.311378
33-0.003587-0.03110.487651
340.0858750.74370.22969
350.0970530.84050.201648
36-0.16102-1.39450.083646
370.0286980.24850.402202
380.103540.89670.186379
390.1102020.95440.171479
40-0.123037-1.06550.145027
41-0.143596-1.24360.108764
42-0.001485-0.01290.494886
43-0.032555-0.28190.389385
44-0.047009-0.40710.342544
450.0354910.30740.379712
46-0.062272-0.53930.295643
470.0986590.85440.197799
48-0.054347-0.47070.319626


Parameters (Session):
par1 = 72 ;
Parameters (R input):
par1 = 48 ; par2 = 1 ; par3 = 0 ; par4 = 0 ; par5 = 12 ; par6 = White Noise ; par7 = 0.95 ; par8 = ;
R code (references can be found in the software module):
if (par1 == 'Default') {
par1 = 10*log10(length(x))
} else {
par1 <- as.numeric(par1)
}
par2 <- as.numeric(par2)
par3 <- as.numeric(par3)
par4 <- as.numeric(par4)
par5 <- as.numeric(par5)
if (par6 == 'White Noise') par6 <- 'white' else par6 <- 'ma'
par7 <- as.numeric(par7)
if (par8 != '') par8 <- as.numeric(par8)
ox <- x
if (par8 == '') {
if (par2 == 0) {
x <- log(x)
} else {
x <- (x ^ par2 - 1) / par2
}
} else {
x <- log(x,base=par8)
}
if (par3 > 0) x <- diff(x,lag=1,difference=par3)
if (par4 > 0) x <- diff(x,lag=par5,difference=par4)
bitmap(file='picts.png')
op <- par(mfrow=c(2,1))
plot(ox,type='l',main='Original Time Series',xlab='time',ylab='value')
if (par8=='') {
mytitle <- paste('Working Time Series (lambda=',par2,', d=',par3,', D=',par4,')',sep='')
mysub <- paste('(lambda=',par2,', d=',par3,', D=',par4,', CI=', par7, ', CI type=',par6,')',sep='')
} else {
mytitle <- paste('Working Time Series (base=',par8,', d=',par3,', D=',par4,')',sep='')
mysub <- paste('(base=',par8,', d=',par3,', D=',par4,', CI=', par7, ', CI type=',par6,')',sep='')
}
plot(x,type='l', main=mytitle,xlab='time',ylab='value')
par(op)
dev.off()
bitmap(file='pic1.png')
racf <- acf(x, par1, main='Autocorrelation', xlab='time lag', ylab='ACF', ci.type=par6, ci=par7, sub=mysub)
dev.off()
bitmap(file='pic2.png')
rpacf <- pacf(x,par1,main='Partial Autocorrelation',xlab='lags',ylab='PACF',sub=mysub)
dev.off()
(myacf <- c(racf$acf))
(mypacf <- c(rpacf$acf))
lengthx <- length(x)
sqrtn <- sqrt(lengthx)
load(file='createtable')
a<-table.start()
a<-table.row.start(a)
a<-table.element(a,'Autocorrelation Function',4,TRUE)
a<-table.row.end(a)
a<-table.row.start(a)
a<-table.element(a,'Time lag k',header=TRUE)
a<-table.element(a,hyperlink('basics.htm','ACF(k)','click here for more information about the Autocorrelation Function'),header=TRUE)
a<-table.element(a,'T-STAT',header=TRUE)
a<-table.element(a,'P-value',header=TRUE)
a<-table.row.end(a)
for (i in 2:(par1+1)) {
a<-table.row.start(a)
a<-table.element(a,i-1,header=TRUE)
a<-table.element(a,round(myacf[i],6))
mytstat <- myacf[i]*sqrtn
a<-table.element(a,round(mytstat,4))
a<-table.element(a,round(1-pt(abs(mytstat),lengthx),6))
a<-table.row.end(a)
}
a<-table.end(a)
table.save(a,file='mytable.tab')
a<-table.start()
a<-table.row.start(a)
a<-table.element(a,'Partial Autocorrelation Function',4,TRUE)
a<-table.row.end(a)
a<-table.row.start(a)
a<-table.element(a,'Time lag k',header=TRUE)
a<-table.element(a,hyperlink('basics.htm','PACF(k)','click here for more information about the Partial Autocorrelation Function'),header=TRUE)
a<-table.element(a,'T-STAT',header=TRUE)
a<-table.element(a,'P-value',header=TRUE)
a<-table.row.end(a)
for (i in 1:par1) {
a<-table.row.start(a)
a<-table.element(a,i,header=TRUE)
a<-table.element(a,round(mypacf[i],6))
mytstat <- mypacf[i]*sqrtn
a<-table.element(a,round(mytstat,4))
a<-table.element(a,round(1-pt(abs(mytstat),lengthx),6))
a<-table.row.end(a)
}
a<-table.end(a)
table.save(a,file='mytable1.tab')