Free Statistics

of Irreproducible Research!

Author's title

Author*Unverified author*
R Software Modulerwasp_smp.wasp
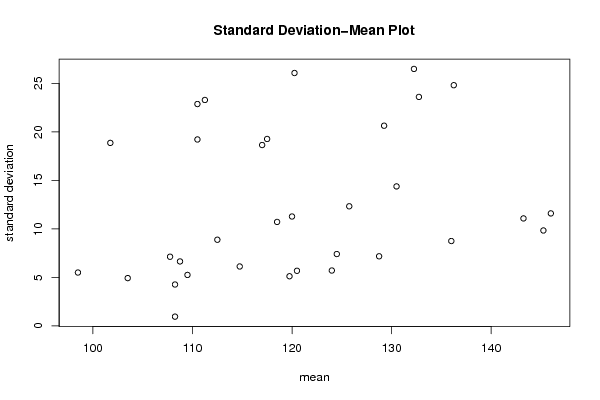
Title produced by softwareStandard Deviation-Mean Plot
Date of computationFri, 20 May 2011 03:51:24 +0000
Cite this page as followsStatistical Computations at FreeStatistics.org, Office for Research Development and Education, URL https://freestatistics.org/blog/index.php?v=date/2011/May/20/t1305863254vqgdxfxtdvstipc.htm/, Retrieved Mon, 13 May 2024 10:44:53 +0000
Statistical Computations at FreeStatistics.org, Office for Research Development and Education, URL https://freestatistics.org/blog/index.php?pk=122388, Retrieved Mon, 13 May 2024 10:44:53 +0000
QR Codes:

Original text written by user:
IsPrivate?No (this computation is public)
User-defined keywordsKDGP2W83
Estimated Impact101
Family? (F = Feedback message, R = changed R code, M = changed R Module, P = changed Parameters, D = changed Data)
-       [Standard Deviation-Mean Plot] [] [2011-05-20 03:51:24] [e142b37b6acbb6a3ec873415888faca6] [Current]
Feedback Forum

Post a new message
Dataseries X:
116
111
104
100
93
91
119
139
134
124
113
109
109
106
101
98
93
91
122
139
140
132
117
114
113
110
107
103
98
98
137
148
147
139
130
128
127
123
118
114
108
111
151
159
158
148
138
137
136
133
126
120
114
116
153
162
161
149
139
135
130
127
122
117
112
113
149
157
157
147
137
132
125
123
117
114
111
112
144
150
149
134
123
116
117
111
105
102
95
93
124
130
124
115
106
105
105
101
95
93
84
87
116
120
117
109
105
107
109
109
108
107
99
103
131
137
135
124
118
121
121
118
113
107
100
102
130
136
133
120
112
109
110


Summary of computational transaction
Raw Inputview raw input (R code)
Raw Outputview raw output of R engine
Computing time1 seconds
R Server'Herman Ole Andreas Wold' @ www.yougetit.org

\begin{tabular}{lllllllll}
\hline
Summary of computational transaction \tabularnewline
Raw Input & view raw input (R code)  \tabularnewline
Raw Output & view raw output of R engine  \tabularnewline
Computing time & 1 seconds \tabularnewline
R Server & 'Herman Ole Andreas Wold' @ www.yougetit.org \tabularnewline
\hline
\end{tabular}
%Source: https://freestatistics.org/blog/index.php?pk=122388&T=0

[TABLE]
[ROW][C]Summary of computational transaction[/C][/ROW]
[ROW][C]Raw Input[/C][C]view raw input (R code) [/C][/ROW]
[ROW][C]Raw Output[/C][C]view raw output of R engine [/C][/ROW]
[ROW][C]Computing time[/C][C]1 seconds[/C][/ROW]
[ROW][C]R Server[/C][C]'Herman Ole Andreas Wold' @ www.yougetit.org[/C][/ROW]
[/TABLE]
Source: https://freestatistics.org/blog/index.php?pk=122388&T=0

Globally Unique Identifier (entire table): ba.freestatistics.org/blog/index.php?pk=122388&T=0

As an alternative you can also use a QR Code:  

The GUIDs for individual cells are displayed in the table below:

Summary of computational transaction
Raw Inputview raw input (R code)
Raw Outputview raw output of R engine
Computing time1 seconds
R Server'Herman Ole Andreas Wold' @ www.yougetit.org


Standard Deviation-Mean Plot
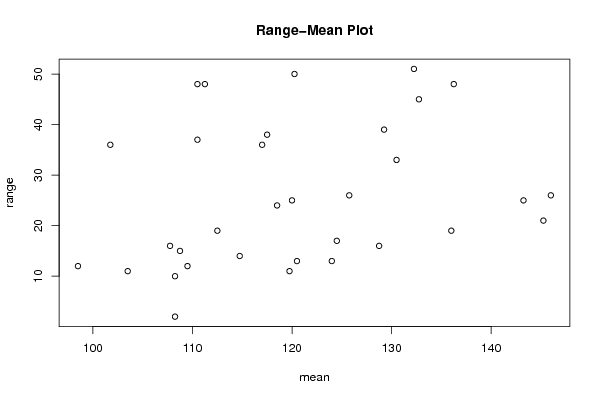
SectionMeanStandard DeviationRange
1107.757.1355915428692216
2110.522.883764259113248
312011.284207253207225
4103.54.9328828623162511
5111.2523.300572239038848
6125.7512.338962679253126
7108.254.2720018726587710
8120.2526.0816027114950
91368.7559503577091319
10120.55.6862407030773313
11132.2526.551
12145.259.8446262837482421
13128.757.1821538088050816
14136.2524.824383174612848
1514611.604596790352826
161245.7154760664940813
17132.7523.613202521753245
18143.2511.086778913041725
19119.755.123475382979811
20129.2520.645822822062639
21130.514.387494569938233
22108.756.6520673478250415
23110.519.22671752189337
24112.58.8881944173155919
2598.55.507570547286112
26101.7518.874586088176936
27109.55.2599112793531712
28108.250.9574271077563382
29117.519.278658321228338
30124.57.4161984870956617
31114.756.1305247192498414
3211718.654758106177636
33118.510.723805294763624

\begin{tabular}{lllllllll}
\hline
Standard Deviation-Mean Plot \tabularnewline
Section & Mean & Standard Deviation & Range \tabularnewline
1 & 107.75 & 7.13559154286922 & 16 \tabularnewline
2 & 110.5 & 22.8837642591132 & 48 \tabularnewline
3 & 120 & 11.2842072532072 & 25 \tabularnewline
4 & 103.5 & 4.93288286231625 & 11 \tabularnewline
5 & 111.25 & 23.3005722390388 & 48 \tabularnewline
6 & 125.75 & 12.3389626792531 & 26 \tabularnewline
7 & 108.25 & 4.27200187265877 & 10 \tabularnewline
8 & 120.25 & 26.08160271149 & 50 \tabularnewline
9 & 136 & 8.75595035770913 & 19 \tabularnewline
10 & 120.5 & 5.68624070307733 & 13 \tabularnewline
11 & 132.25 & 26.5 & 51 \tabularnewline
12 & 145.25 & 9.84462628374824 & 21 \tabularnewline
13 & 128.75 & 7.18215380880508 & 16 \tabularnewline
14 & 136.25 & 24.8243831746128 & 48 \tabularnewline
15 & 146 & 11.6045967903528 & 26 \tabularnewline
16 & 124 & 5.71547606649408 & 13 \tabularnewline
17 & 132.75 & 23.6132025217532 & 45 \tabularnewline
18 & 143.25 & 11.0867789130417 & 25 \tabularnewline
19 & 119.75 & 5.1234753829798 & 11 \tabularnewline
20 & 129.25 & 20.6458228220626 & 39 \tabularnewline
21 & 130.5 & 14.3874945699382 & 33 \tabularnewline
22 & 108.75 & 6.65206734782504 & 15 \tabularnewline
23 & 110.5 & 19.226717521893 & 37 \tabularnewline
24 & 112.5 & 8.88819441731559 & 19 \tabularnewline
25 & 98.5 & 5.5075705472861 & 12 \tabularnewline
26 & 101.75 & 18.8745860881769 & 36 \tabularnewline
27 & 109.5 & 5.25991127935317 & 12 \tabularnewline
28 & 108.25 & 0.957427107756338 & 2 \tabularnewline
29 & 117.5 & 19.2786583212283 & 38 \tabularnewline
30 & 124.5 & 7.41619848709566 & 17 \tabularnewline
31 & 114.75 & 6.13052471924984 & 14 \tabularnewline
32 & 117 & 18.6547581061776 & 36 \tabularnewline
33 & 118.5 & 10.7238052947636 & 24 \tabularnewline
\hline
\end{tabular}
%Source: https://freestatistics.org/blog/index.php?pk=122388&T=1

[TABLE]
[ROW][C]Standard Deviation-Mean Plot[/C][/ROW]
[ROW][C]Section[/C][C]Mean[/C][C]Standard Deviation[/C][C]Range[/C][/ROW]
[ROW][C]1[/C][C]107.75[/C][C]7.13559154286922[/C][C]16[/C][/ROW]
[ROW][C]2[/C][C]110.5[/C][C]22.8837642591132[/C][C]48[/C][/ROW]
[ROW][C]3[/C][C]120[/C][C]11.2842072532072[/C][C]25[/C][/ROW]
[ROW][C]4[/C][C]103.5[/C][C]4.93288286231625[/C][C]11[/C][/ROW]
[ROW][C]5[/C][C]111.25[/C][C]23.3005722390388[/C][C]48[/C][/ROW]
[ROW][C]6[/C][C]125.75[/C][C]12.3389626792531[/C][C]26[/C][/ROW]
[ROW][C]7[/C][C]108.25[/C][C]4.27200187265877[/C][C]10[/C][/ROW]
[ROW][C]8[/C][C]120.25[/C][C]26.08160271149[/C][C]50[/C][/ROW]
[ROW][C]9[/C][C]136[/C][C]8.75595035770913[/C][C]19[/C][/ROW]
[ROW][C]10[/C][C]120.5[/C][C]5.68624070307733[/C][C]13[/C][/ROW]
[ROW][C]11[/C][C]132.25[/C][C]26.5[/C][C]51[/C][/ROW]
[ROW][C]12[/C][C]145.25[/C][C]9.84462628374824[/C][C]21[/C][/ROW]
[ROW][C]13[/C][C]128.75[/C][C]7.18215380880508[/C][C]16[/C][/ROW]
[ROW][C]14[/C][C]136.25[/C][C]24.8243831746128[/C][C]48[/C][/ROW]
[ROW][C]15[/C][C]146[/C][C]11.6045967903528[/C][C]26[/C][/ROW]
[ROW][C]16[/C][C]124[/C][C]5.71547606649408[/C][C]13[/C][/ROW]
[ROW][C]17[/C][C]132.75[/C][C]23.6132025217532[/C][C]45[/C][/ROW]
[ROW][C]18[/C][C]143.25[/C][C]11.0867789130417[/C][C]25[/C][/ROW]
[ROW][C]19[/C][C]119.75[/C][C]5.1234753829798[/C][C]11[/C][/ROW]
[ROW][C]20[/C][C]129.25[/C][C]20.6458228220626[/C][C]39[/C][/ROW]
[ROW][C]21[/C][C]130.5[/C][C]14.3874945699382[/C][C]33[/C][/ROW]
[ROW][C]22[/C][C]108.75[/C][C]6.65206734782504[/C][C]15[/C][/ROW]
[ROW][C]23[/C][C]110.5[/C][C]19.226717521893[/C][C]37[/C][/ROW]
[ROW][C]24[/C][C]112.5[/C][C]8.88819441731559[/C][C]19[/C][/ROW]
[ROW][C]25[/C][C]98.5[/C][C]5.5075705472861[/C][C]12[/C][/ROW]
[ROW][C]26[/C][C]101.75[/C][C]18.8745860881769[/C][C]36[/C][/ROW]
[ROW][C]27[/C][C]109.5[/C][C]5.25991127935317[/C][C]12[/C][/ROW]
[ROW][C]28[/C][C]108.25[/C][C]0.957427107756338[/C][C]2[/C][/ROW]
[ROW][C]29[/C][C]117.5[/C][C]19.2786583212283[/C][C]38[/C][/ROW]
[ROW][C]30[/C][C]124.5[/C][C]7.41619848709566[/C][C]17[/C][/ROW]
[ROW][C]31[/C][C]114.75[/C][C]6.13052471924984[/C][C]14[/C][/ROW]
[ROW][C]32[/C][C]117[/C][C]18.6547581061776[/C][C]36[/C][/ROW]
[ROW][C]33[/C][C]118.5[/C][C]10.7238052947636[/C][C]24[/C][/ROW]
[/TABLE]
Source: https://freestatistics.org/blog/index.php?pk=122388&T=1

Globally Unique Identifier (entire table): ba.freestatistics.org/blog/index.php?pk=122388&T=1

As an alternative you can also use a QR Code:  

The GUIDs for individual cells are displayed in the table below:

Standard Deviation-Mean Plot
SectionMeanStandard DeviationRange
1107.757.1355915428692216
2110.522.883764259113248
312011.284207253207225
4103.54.9328828623162511
5111.2523.300572239038848
6125.7512.338962679253126
7108.254.2720018726587710
8120.2526.0816027114950
91368.7559503577091319
10120.55.6862407030773313
11132.2526.551
12145.259.8446262837482421
13128.757.1821538088050816
14136.2524.824383174612848
1514611.604596790352826
161245.7154760664940813
17132.7523.613202521753245
18143.2511.086778913041725
19119.755.123475382979811
20129.2520.645822822062639
21130.514.387494569938233
22108.756.6520673478250415
23110.519.22671752189337
24112.58.8881944173155919
2598.55.507570547286112
26101.7518.874586088176936
27109.55.2599112793531712
28108.250.9574271077563382
29117.519.278658321228338
30124.57.4161984870956617
31114.756.1305247192498414
3211718.654758106177636
33118.510.723805294763624


Regression: S.E.(k) = alpha + beta * Mean(k)
alpha-3.88151274821615
beta0.136611544949676
S.D.0.104482927546556
T-STAT1.30750112154738
p-value0.200657171676416

\begin{tabular}{lllllllll}
\hline
Regression: S.E.(k) = alpha + beta * Mean(k) \tabularnewline
alpha & -3.88151274821615 \tabularnewline
beta & 0.136611544949676 \tabularnewline
S.D. & 0.104482927546556 \tabularnewline
T-STAT & 1.30750112154738 \tabularnewline
p-value & 0.200657171676416 \tabularnewline
\hline
\end{tabular}
%Source: https://freestatistics.org/blog/index.php?pk=122388&T=2

[TABLE]
[ROW][C]Regression: S.E.(k) = alpha + beta * Mean(k)[/C][/ROW]
[ROW][C]alpha[/C][C]-3.88151274821615[/C][/ROW]
[ROW][C]beta[/C][C]0.136611544949676[/C][/ROW]
[ROW][C]S.D.[/C][C]0.104482927546556[/C][/ROW]
[ROW][C]T-STAT[/C][C]1.30750112154738[/C][/ROW]
[ROW][C]p-value[/C][C]0.200657171676416[/C][/ROW]
[/TABLE]
Source: https://freestatistics.org/blog/index.php?pk=122388&T=2

Globally Unique Identifier (entire table): ba.freestatistics.org/blog/index.php?pk=122388&T=2

As an alternative you can also use a QR Code:  

The GUIDs for individual cells are displayed in the table below:

Regression: S.E.(k) = alpha + beta * Mean(k)
alpha-3.88151274821615
beta0.136611544949676
S.D.0.104482927546556
T-STAT1.30750112154738
p-value0.200657171676416


Regression: ln S.E.(k) = alpha + beta * ln Mean(k)
alpha-8.25366395018125
beta2.20972105662358
S.D.1.1780833519399
T-STAT1.87569160788575
p-value0.0701428816206355
Lambda-1.20972105662358

\begin{tabular}{lllllllll}
\hline
Regression: ln S.E.(k) = alpha + beta * ln Mean(k) \tabularnewline
alpha & -8.25366395018125 \tabularnewline
beta & 2.20972105662358 \tabularnewline
S.D. & 1.1780833519399 \tabularnewline
T-STAT & 1.87569160788575 \tabularnewline
p-value & 0.0701428816206355 \tabularnewline
Lambda & -1.20972105662358 \tabularnewline
\hline
\end{tabular}
%Source: https://freestatistics.org/blog/index.php?pk=122388&T=3

[TABLE]
[ROW][C]Regression: ln S.E.(k) = alpha + beta * ln Mean(k)[/C][/ROW]
[ROW][C]alpha[/C][C]-8.25366395018125[/C][/ROW]
[ROW][C]beta[/C][C]2.20972105662358[/C][/ROW]
[ROW][C]S.D.[/C][C]1.1780833519399[/C][/ROW]
[ROW][C]T-STAT[/C][C]1.87569160788575[/C][/ROW]
[ROW][C]p-value[/C][C]0.0701428816206355[/C][/ROW]
[ROW][C]Lambda[/C][C]-1.20972105662358[/C][/ROW]
[/TABLE]
Source: https://freestatistics.org/blog/index.php?pk=122388&T=3

Globally Unique Identifier (entire table): ba.freestatistics.org/blog/index.php?pk=122388&T=3

As an alternative you can also use a QR Code:  

The GUIDs for individual cells are displayed in the table below:

Regression: ln S.E.(k) = alpha + beta * ln Mean(k)
alpha-8.25366395018125
beta2.20972105662358
S.D.1.1780833519399
T-STAT1.87569160788575
p-value0.0701428816206355
Lambda-1.20972105662358


Parameters (Session):
par1 = 4 ;
Parameters (R input):
par1 = 4 ;
R code (references can be found in the software module):
par1 <- as.numeric(par1)
(n <- length(x))
(np <- floor(n / par1))
arr <- array(NA,dim=c(par1,np))
j <- 0
k <- 1
for (i in 1:(np*par1))
{
j = j + 1
arr[j,k] <- x[i]
if (j == par1) {
j = 0
k=k+1
}
}
arr
arr.mean <- array(NA,dim=np)
arr.sd <- array(NA,dim=np)
arr.range <- array(NA,dim=np)
for (j in 1:np)
{
arr.mean[j] <- mean(arr[,j],na.rm=TRUE)
arr.sd[j] <- sd(arr[,j],na.rm=TRUE)
arr.range[j] <- max(arr[,j],na.rm=TRUE) - min(arr[,j],na.rm=TRUE)
}
arr.mean
arr.sd
arr.range
(lm1 <- lm(arr.sd~arr.mean))
(lnlm1 <- lm(log(arr.sd)~log(arr.mean)))
(lm2 <- lm(arr.range~arr.mean))
bitmap(file='test1.png')
plot(arr.mean,arr.sd,main='Standard Deviation-Mean Plot',xlab='mean',ylab='standard deviation')
dev.off()
bitmap(file='test2.png')
plot(arr.mean,arr.range,main='Range-Mean Plot',xlab='mean',ylab='range')
dev.off()
load(file='createtable')
a<-table.start()
a<-table.row.start(a)
a<-table.element(a,'Standard Deviation-Mean Plot',4,TRUE)
a<-table.row.end(a)
a<-table.row.start(a)
a<-table.element(a,'Section',header=TRUE)
a<-table.element(a,'Mean',header=TRUE)
a<-table.element(a,'Standard Deviation',header=TRUE)
a<-table.element(a,'Range',header=TRUE)
a<-table.row.end(a)
for (j in 1:np) {
a<-table.row.start(a)
a<-table.element(a,j,header=TRUE)
a<-table.element(a,arr.mean[j])
a<-table.element(a,arr.sd[j] )
a<-table.element(a,arr.range[j] )
a<-table.row.end(a)
}
a<-table.end(a)
table.save(a,file='mytable.tab')
a<-table.start()
a<-table.row.start(a)
a<-table.element(a,'Regression: S.E.(k) = alpha + beta * Mean(k)',2,TRUE)
a<-table.row.end(a)
a<-table.row.start(a)
a<-table.element(a,'alpha',header=TRUE)
a<-table.element(a,lm1$coefficients[[1]])
a<-table.row.end(a)
a<-table.row.start(a)
a<-table.element(a,'beta',header=TRUE)
a<-table.element(a,lm1$coefficients[[2]])
a<-table.row.end(a)
a<-table.row.start(a)
a<-table.element(a,'S.D.',header=TRUE)
a<-table.element(a,summary(lm1)$coefficients[2,2])
a<-table.row.end(a)
a<-table.row.start(a)
a<-table.element(a,'T-STAT',header=TRUE)
a<-table.element(a,summary(lm1)$coefficients[2,3])
a<-table.row.end(a)
a<-table.row.start(a)
a<-table.element(a,'p-value',header=TRUE)
a<-table.element(a,summary(lm1)$coefficients[2,4])
a<-table.row.end(a)
a<-table.end(a)
table.save(a,file='mytable1.tab')
a<-table.start()
a<-table.row.start(a)
a<-table.element(a,'Regression: ln S.E.(k) = alpha + beta * ln Mean(k)',2,TRUE)
a<-table.row.end(a)
a<-table.row.start(a)
a<-table.element(a,'alpha',header=TRUE)
a<-table.element(a,lnlm1$coefficients[[1]])
a<-table.row.end(a)
a<-table.row.start(a)
a<-table.element(a,'beta',header=TRUE)
a<-table.element(a,lnlm1$coefficients[[2]])
a<-table.row.end(a)
a<-table.row.start(a)
a<-table.element(a,'S.D.',header=TRUE)
a<-table.element(a,summary(lnlm1)$coefficients[2,2])
a<-table.row.end(a)
a<-table.row.start(a)
a<-table.element(a,'T-STAT',header=TRUE)
a<-table.element(a,summary(lnlm1)$coefficients[2,3])
a<-table.row.end(a)
a<-table.row.start(a)
a<-table.element(a,'p-value',header=TRUE)
a<-table.element(a,summary(lnlm1)$coefficients[2,4])
a<-table.row.end(a)
a<-table.row.start(a)
a<-table.element(a,'Lambda',header=TRUE)
a<-table.element(a,1-lnlm1$coefficients[[2]])
a<-table.row.end(a)
a<-table.end(a)
table.save(a,file='mytable2.tab')