Free Statistics

of Irreproducible Research!

Author's title

Author*Unverified author*
R Software Modulerwasp_smp.wasp
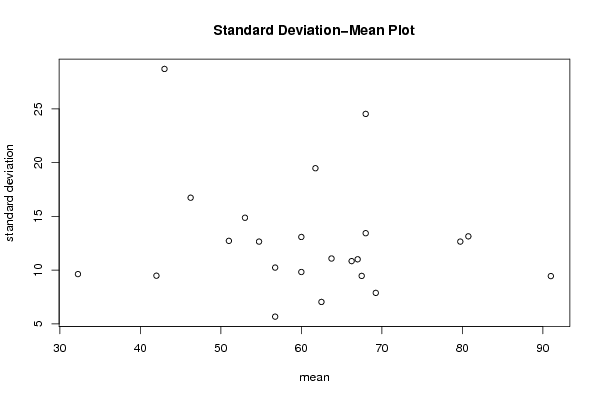
Title produced by softwareStandard Deviation-Mean Plot
Date of computationFri, 20 May 2011 01:16:40 +0000
Cite this page as followsStatistical Computations at FreeStatistics.org, Office for Research Development and Education, URL https://freestatistics.org/blog/index.php?v=date/2011/May/20/t130585395267rxunztvzfnco3.htm/, Retrieved Mon, 13 May 2024 06:22:27 +0000
Statistical Computations at FreeStatistics.org, Office for Research Development and Education, URL https://freestatistics.org/blog/index.php?pk=122338, Retrieved Mon, 13 May 2024 06:22:27 +0000
QR Codes:

Original text written by user:
IsPrivate?No (this computation is public)
User-defined keywordsKDGP2W83
Estimated Impact97
Family? (F = Feedback message, R = changed R code, M = changed R Module, P = changed Parameters, D = changed Data)
-       [Standard Deviation-Mean Plot] [] [2011-05-20 01:16:40] [7ec7c2b78d31d17737f91280a6e28d4a] [Current]
Feedback Forum

Post a new message
Dataseries X:
90
51
47
59
54
79
59
80
46
62
55
77
72
72
71
50
66
78
59
52
71
98
70
84
90
98
98
78
59
0
58
55
62
80
91
86
61
49
61
56
73
85
82
32
39
30
51
48
57
59
32
56
54
74
62
78
72
48
59
61
80
69
58
63
27
23
34
45
51
51
73
37
35
66
54
30
66
61
37
55
64
53
63
70
72
52
53
50
60
73
66
78


Summary of computational transaction
Raw Inputview raw input (R code)
Raw Outputview raw output of R engine
Computing time1 seconds
R Server'Sir Ronald Aylmer Fisher' @ 193.190.124.24

\begin{tabular}{lllllllll}
\hline
Summary of computational transaction \tabularnewline
Raw Input & view raw input (R code)  \tabularnewline
Raw Output & view raw output of R engine  \tabularnewline
Computing time & 1 seconds \tabularnewline
R Server & 'Sir Ronald Aylmer Fisher' @ 193.190.124.24 \tabularnewline
\hline
\end{tabular}
%Source: https://freestatistics.org/blog/index.php?pk=122338&T=0

[TABLE]
[ROW][C]Summary of computational transaction[/C][/ROW]
[ROW][C]Raw Input[/C][C]view raw input (R code) [/C][/ROW]
[ROW][C]Raw Output[/C][C]view raw output of R engine [/C][/ROW]
[ROW][C]Computing time[/C][C]1 seconds[/C][/ROW]
[ROW][C]R Server[/C][C]'Sir Ronald Aylmer Fisher' @ 193.190.124.24[/C][/ROW]
[/TABLE]
Source: https://freestatistics.org/blog/index.php?pk=122338&T=0

Globally Unique Identifier (entire table): ba.freestatistics.org/blog/index.php?pk=122338&T=0

As an alternative you can also use a QR Code:  

The GUIDs for individual cells are displayed in the table below:

Summary of computational transaction
Raw Inputview raw input (R code)
Raw Outputview raw output of R engine
Computing time1 seconds
R Server'Sir Ronald Aylmer Fisher' @ 193.190.124.24


Standard Deviation-Mean Plot
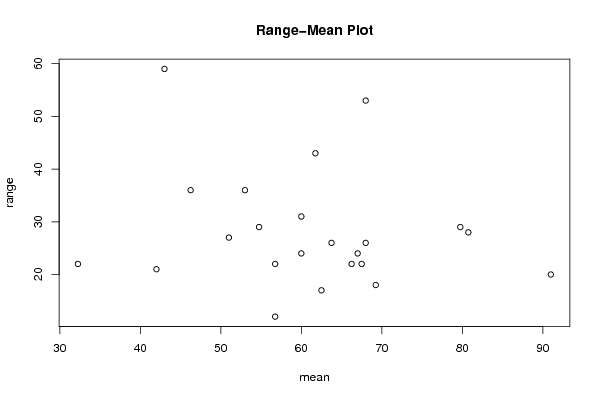
SectionMeanStandard DeviationRange
161.7519.482898483884143
26813.441230102437326
36013.089435944047931
466.2510.843584893075422
563.7511.086778913041726
680.7513.149778198382928
7919.4516312525052220
84328.717010057919859
979.7512.658988901172229
1056.755.6789083458002712
116824.535688292770653
12429.4868329805051421
135112.727922061357927
146711.015141094572224
15609.8319208025017524
1667.59.4692484742278622
1732.259.6393291606141722
185314.877275736280936
1946.2516.740669042783236
2054.7512.658988901172229
2162.57.0474581706219917
2256.7510.242883708539622
2369.257.8898669190297518

\begin{tabular}{lllllllll}
\hline
Standard Deviation-Mean Plot \tabularnewline
Section & Mean & Standard Deviation & Range \tabularnewline
1 & 61.75 & 19.4828984838841 & 43 \tabularnewline
2 & 68 & 13.4412301024373 & 26 \tabularnewline
3 & 60 & 13.0894359440479 & 31 \tabularnewline
4 & 66.25 & 10.8435848930754 & 22 \tabularnewline
5 & 63.75 & 11.0867789130417 & 26 \tabularnewline
6 & 80.75 & 13.1497781983829 & 28 \tabularnewline
7 & 91 & 9.45163125250522 & 20 \tabularnewline
8 & 43 & 28.7170100579198 & 59 \tabularnewline
9 & 79.75 & 12.6589889011722 & 29 \tabularnewline
10 & 56.75 & 5.67890834580027 & 12 \tabularnewline
11 & 68 & 24.5356882927706 & 53 \tabularnewline
12 & 42 & 9.48683298050514 & 21 \tabularnewline
13 & 51 & 12.7279220613579 & 27 \tabularnewline
14 & 67 & 11.0151410945722 & 24 \tabularnewline
15 & 60 & 9.83192080250175 & 24 \tabularnewline
16 & 67.5 & 9.46924847422786 & 22 \tabularnewline
17 & 32.25 & 9.63932916061417 & 22 \tabularnewline
18 & 53 & 14.8772757362809 & 36 \tabularnewline
19 & 46.25 & 16.7406690427832 & 36 \tabularnewline
20 & 54.75 & 12.6589889011722 & 29 \tabularnewline
21 & 62.5 & 7.04745817062199 & 17 \tabularnewline
22 & 56.75 & 10.2428837085396 & 22 \tabularnewline
23 & 69.25 & 7.88986691902975 & 18 \tabularnewline
\hline
\end{tabular}
%Source: https://freestatistics.org/blog/index.php?pk=122338&T=1

[TABLE]
[ROW][C]Standard Deviation-Mean Plot[/C][/ROW]
[ROW][C]Section[/C][C]Mean[/C][C]Standard Deviation[/C][C]Range[/C][/ROW]
[ROW][C]1[/C][C]61.75[/C][C]19.4828984838841[/C][C]43[/C][/ROW]
[ROW][C]2[/C][C]68[/C][C]13.4412301024373[/C][C]26[/C][/ROW]
[ROW][C]3[/C][C]60[/C][C]13.0894359440479[/C][C]31[/C][/ROW]
[ROW][C]4[/C][C]66.25[/C][C]10.8435848930754[/C][C]22[/C][/ROW]
[ROW][C]5[/C][C]63.75[/C][C]11.0867789130417[/C][C]26[/C][/ROW]
[ROW][C]6[/C][C]80.75[/C][C]13.1497781983829[/C][C]28[/C][/ROW]
[ROW][C]7[/C][C]91[/C][C]9.45163125250522[/C][C]20[/C][/ROW]
[ROW][C]8[/C][C]43[/C][C]28.7170100579198[/C][C]59[/C][/ROW]
[ROW][C]9[/C][C]79.75[/C][C]12.6589889011722[/C][C]29[/C][/ROW]
[ROW][C]10[/C][C]56.75[/C][C]5.67890834580027[/C][C]12[/C][/ROW]
[ROW][C]11[/C][C]68[/C][C]24.5356882927706[/C][C]53[/C][/ROW]
[ROW][C]12[/C][C]42[/C][C]9.48683298050514[/C][C]21[/C][/ROW]
[ROW][C]13[/C][C]51[/C][C]12.7279220613579[/C][C]27[/C][/ROW]
[ROW][C]14[/C][C]67[/C][C]11.0151410945722[/C][C]24[/C][/ROW]
[ROW][C]15[/C][C]60[/C][C]9.83192080250175[/C][C]24[/C][/ROW]
[ROW][C]16[/C][C]67.5[/C][C]9.46924847422786[/C][C]22[/C][/ROW]
[ROW][C]17[/C][C]32.25[/C][C]9.63932916061417[/C][C]22[/C][/ROW]
[ROW][C]18[/C][C]53[/C][C]14.8772757362809[/C][C]36[/C][/ROW]
[ROW][C]19[/C][C]46.25[/C][C]16.7406690427832[/C][C]36[/C][/ROW]
[ROW][C]20[/C][C]54.75[/C][C]12.6589889011722[/C][C]29[/C][/ROW]
[ROW][C]21[/C][C]62.5[/C][C]7.04745817062199[/C][C]17[/C][/ROW]
[ROW][C]22[/C][C]56.75[/C][C]10.2428837085396[/C][C]22[/C][/ROW]
[ROW][C]23[/C][C]69.25[/C][C]7.88986691902975[/C][C]18[/C][/ROW]
[/TABLE]
Source: https://freestatistics.org/blog/index.php?pk=122338&T=1

Globally Unique Identifier (entire table): ba.freestatistics.org/blog/index.php?pk=122338&T=1

As an alternative you can also use a QR Code:  

The GUIDs for individual cells are displayed in the table below:

Standard Deviation-Mean Plot
SectionMeanStandard DeviationRange
161.7519.482898483884143
26813.441230102437326
36013.089435944047931
466.2510.843584893075422
563.7511.086778913041726
680.7513.149778198382928
7919.4516312525052220
84328.717010057919859
979.7512.658988901172229
1056.755.6789083458002712
116824.535688292770653
12429.4868329805051421
135112.727922061357927
146711.015141094572224
15609.8319208025017524
1667.59.4692484742278622
1732.259.6393291606141722
185314.877275736280936
1946.2516.740669042783236
2054.7512.658988901172229
2162.57.0474581706219917
2256.7510.242883708539622
2369.257.8898669190297518


Regression: S.E.(k) = alpha + beta * Mean(k)
alpha16.8883142367622
beta-0.0675595054474844
S.D.0.0867168686871296
T-STAT-0.779081469041923
p-value0.444623088036804

\begin{tabular}{lllllllll}
\hline
Regression: S.E.(k) = alpha + beta * Mean(k) \tabularnewline
alpha & 16.8883142367622 \tabularnewline
beta & -0.0675595054474844 \tabularnewline
S.D. & 0.0867168686871296 \tabularnewline
T-STAT & -0.779081469041923 \tabularnewline
p-value & 0.444623088036804 \tabularnewline
\hline
\end{tabular}
%Source: https://freestatistics.org/blog/index.php?pk=122338&T=2

[TABLE]
[ROW][C]Regression: S.E.(k) = alpha + beta * Mean(k)[/C][/ROW]
[ROW][C]alpha[/C][C]16.8883142367622[/C][/ROW]
[ROW][C]beta[/C][C]-0.0675595054474844[/C][/ROW]
[ROW][C]S.D.[/C][C]0.0867168686871296[/C][/ROW]
[ROW][C]T-STAT[/C][C]-0.779081469041923[/C][/ROW]
[ROW][C]p-value[/C][C]0.444623088036804[/C][/ROW]
[/TABLE]
Source: https://freestatistics.org/blog/index.php?pk=122338&T=2

Globally Unique Identifier (entire table): ba.freestatistics.org/blog/index.php?pk=122338&T=2

As an alternative you can also use a QR Code:  

The GUIDs for individual cells are displayed in the table below:

Regression: S.E.(k) = alpha + beta * Mean(k)
alpha16.8883142367622
beta-0.0675595054474844
S.D.0.0867168686871296
T-STAT-0.779081469041923
p-value0.444623088036804


Regression: ln S.E.(k) = alpha + beta * ln Mean(k)
alpha3.24851775734887
beta-0.188787158374898
S.D.0.346609277924387
T-STAT-0.544668508314085
p-value0.591719164224765
Lambda1.1887871583749

\begin{tabular}{lllllllll}
\hline
Regression: ln S.E.(k) = alpha + beta * ln Mean(k) \tabularnewline
alpha & 3.24851775734887 \tabularnewline
beta & -0.188787158374898 \tabularnewline
S.D. & 0.346609277924387 \tabularnewline
T-STAT & -0.544668508314085 \tabularnewline
p-value & 0.591719164224765 \tabularnewline
Lambda & 1.1887871583749 \tabularnewline
\hline
\end{tabular}
%Source: https://freestatistics.org/blog/index.php?pk=122338&T=3

[TABLE]
[ROW][C]Regression: ln S.E.(k) = alpha + beta * ln Mean(k)[/C][/ROW]
[ROW][C]alpha[/C][C]3.24851775734887[/C][/ROW]
[ROW][C]beta[/C][C]-0.188787158374898[/C][/ROW]
[ROW][C]S.D.[/C][C]0.346609277924387[/C][/ROW]
[ROW][C]T-STAT[/C][C]-0.544668508314085[/C][/ROW]
[ROW][C]p-value[/C][C]0.591719164224765[/C][/ROW]
[ROW][C]Lambda[/C][C]1.1887871583749[/C][/ROW]
[/TABLE]
Source: https://freestatistics.org/blog/index.php?pk=122338&T=3

Globally Unique Identifier (entire table): ba.freestatistics.org/blog/index.php?pk=122338&T=3

As an alternative you can also use a QR Code:  

The GUIDs for individual cells are displayed in the table below:

Regression: ln S.E.(k) = alpha + beta * ln Mean(k)
alpha3.24851775734887
beta-0.188787158374898
S.D.0.346609277924387
T-STAT-0.544668508314085
p-value0.591719164224765
Lambda1.1887871583749


Parameters (Session):
par1 = 60 ; par2 = 1 ; par3 = 0 ; par4 = 0 ; par5 = 12 ; par6 = White Noise ; par7 = 0.95 ;
Parameters (R input):
par1 = 4 ;
R code (references can be found in the software module):
par1 <- as.numeric(par1)
(n <- length(x))
(np <- floor(n / par1))
arr <- array(NA,dim=c(par1,np))
j <- 0
k <- 1
for (i in 1:(np*par1))
{
j = j + 1
arr[j,k] <- x[i]
if (j == par1) {
j = 0
k=k+1
}
}
arr
arr.mean <- array(NA,dim=np)
arr.sd <- array(NA,dim=np)
arr.range <- array(NA,dim=np)
for (j in 1:np)
{
arr.mean[j] <- mean(arr[,j],na.rm=TRUE)
arr.sd[j] <- sd(arr[,j],na.rm=TRUE)
arr.range[j] <- max(arr[,j],na.rm=TRUE) - min(arr[,j],na.rm=TRUE)
}
arr.mean
arr.sd
arr.range
(lm1 <- lm(arr.sd~arr.mean))
(lnlm1 <- lm(log(arr.sd)~log(arr.mean)))
(lm2 <- lm(arr.range~arr.mean))
bitmap(file='test1.png')
plot(arr.mean,arr.sd,main='Standard Deviation-Mean Plot',xlab='mean',ylab='standard deviation')
dev.off()
bitmap(file='test2.png')
plot(arr.mean,arr.range,main='Range-Mean Plot',xlab='mean',ylab='range')
dev.off()
load(file='createtable')
a<-table.start()
a<-table.row.start(a)
a<-table.element(a,'Standard Deviation-Mean Plot',4,TRUE)
a<-table.row.end(a)
a<-table.row.start(a)
a<-table.element(a,'Section',header=TRUE)
a<-table.element(a,'Mean',header=TRUE)
a<-table.element(a,'Standard Deviation',header=TRUE)
a<-table.element(a,'Range',header=TRUE)
a<-table.row.end(a)
for (j in 1:np) {
a<-table.row.start(a)
a<-table.element(a,j,header=TRUE)
a<-table.element(a,arr.mean[j])
a<-table.element(a,arr.sd[j] )
a<-table.element(a,arr.range[j] )
a<-table.row.end(a)
}
a<-table.end(a)
table.save(a,file='mytable.tab')
a<-table.start()
a<-table.row.start(a)
a<-table.element(a,'Regression: S.E.(k) = alpha + beta * Mean(k)',2,TRUE)
a<-table.row.end(a)
a<-table.row.start(a)
a<-table.element(a,'alpha',header=TRUE)
a<-table.element(a,lm1$coefficients[[1]])
a<-table.row.end(a)
a<-table.row.start(a)
a<-table.element(a,'beta',header=TRUE)
a<-table.element(a,lm1$coefficients[[2]])
a<-table.row.end(a)
a<-table.row.start(a)
a<-table.element(a,'S.D.',header=TRUE)
a<-table.element(a,summary(lm1)$coefficients[2,2])
a<-table.row.end(a)
a<-table.row.start(a)
a<-table.element(a,'T-STAT',header=TRUE)
a<-table.element(a,summary(lm1)$coefficients[2,3])
a<-table.row.end(a)
a<-table.row.start(a)
a<-table.element(a,'p-value',header=TRUE)
a<-table.element(a,summary(lm1)$coefficients[2,4])
a<-table.row.end(a)
a<-table.end(a)
table.save(a,file='mytable1.tab')
a<-table.start()
a<-table.row.start(a)
a<-table.element(a,'Regression: ln S.E.(k) = alpha + beta * ln Mean(k)',2,TRUE)
a<-table.row.end(a)
a<-table.row.start(a)
a<-table.element(a,'alpha',header=TRUE)
a<-table.element(a,lnlm1$coefficients[[1]])
a<-table.row.end(a)
a<-table.row.start(a)
a<-table.element(a,'beta',header=TRUE)
a<-table.element(a,lnlm1$coefficients[[2]])
a<-table.row.end(a)
a<-table.row.start(a)
a<-table.element(a,'S.D.',header=TRUE)
a<-table.element(a,summary(lnlm1)$coefficients[2,2])
a<-table.row.end(a)
a<-table.row.start(a)
a<-table.element(a,'T-STAT',header=TRUE)
a<-table.element(a,summary(lnlm1)$coefficients[2,3])
a<-table.row.end(a)
a<-table.row.start(a)
a<-table.element(a,'p-value',header=TRUE)
a<-table.element(a,summary(lnlm1)$coefficients[2,4])
a<-table.row.end(a)
a<-table.row.start(a)
a<-table.element(a,'Lambda',header=TRUE)
a<-table.element(a,1-lnlm1$coefficients[[2]])
a<-table.row.end(a)
a<-table.end(a)
table.save(a,file='mytable2.tab')