Free Statistics

of Irreproducible Research!

Author's title

Author*Unverified author*
R Software Modulerwasp_autocorrelation.wasp
Title produced by software(Partial) Autocorrelation Function
Date of computationThu, 19 May 2011 20:43:06 +0000
Cite this page as followsStatistical Computations at FreeStatistics.org, Office for Research Development and Education, URL https://freestatistics.org/blog/index.php?v=date/2011/May/19/t1305837581l5m76amjz2erfyj.htm/, Retrieved Sat, 11 May 2024 07:30:01 +0000
Statistical Computations at FreeStatistics.org, Office for Research Development and Education, URL https://freestatistics.org/blog/index.php?pk=122227, Retrieved Sat, 11 May 2024 07:30:01 +0000
QR Codes:

Original text written by user:
IsPrivate?No (this computation is public)
User-defined keywordsKDGP2W12
Estimated Impact128
Family? (F = Feedback message, R = changed R code, M = changed R Module, P = changed Parameters, D = changed Data)
-     [(Partial) Autocorrelation Function] [Autocorrelatie me...] [2009-12-16 11:02:51] [702b109ff2d8b1c8a15cc31390408a4f]
- R PD    [(Partial) Autocorrelation Function] [Inschrijvingen ni...] [2011-05-19 20:43:06] [0b99204a0dc37104849df68eb9128a1a] [Current]
- R P       [(Partial) Autocorrelation Function] [Sarah Geerts - Au...] [2011-05-20 03:08:19] [38950998a23e7419c15b25db858fbdfd]
Feedback Forum

Post a new message
Dataseries X:
31.514
27.071
29.462
26.105
22.397
23.843
21.705
18.089
20.764
25.316
17.704
15.548
28.029
29.383
36.438
32.034
22.679
24.319
18.004
17.537
20.366
22.782
19.169
13.807
29.743
25.591
29.096
26.482
22.405
27.044
17.970
18.730
19.684
19.785
18.479
10.698
31.956
29.506
34.506
27.165
26.736
23.691
18.157
17.328
18.205
20.995
17.382
9.367
31.124
26.551
30.651
25.859
25.100
25.778
20.418
18.688
20.424
24.776
19.814
12.738
31.566
30.111
30.019
31.934
25.826
26.835
20.205
17.789
20.520
22.518
15.572
11.509
25.447
24.090
27.786
26.195
20.516
22.759
19.028
16.971
20.036
22.485
18.730
14.538
27.561
25.985
34.670
32.066
27.186
29.586
21.359
21.553
19.573
24.256
22.380
16.167
27.297
28.287


Summary of computational transaction
Raw Inputview raw input (R code)
Raw Outputview raw output of R engine
Computing time2 seconds
R Server'RServer@AstonUniversity' @ vre.aston.ac.uk

\begin{tabular}{lllllllll}
\hline
Summary of computational transaction \tabularnewline
Raw Input & view raw input (R code)  \tabularnewline
Raw Output & view raw output of R engine  \tabularnewline
Computing time & 2 seconds \tabularnewline
R Server & 'RServer@AstonUniversity' @ vre.aston.ac.uk \tabularnewline
\hline
\end{tabular}
%Source: https://freestatistics.org/blog/index.php?pk=122227&T=0

[TABLE]
[ROW][C]Summary of computational transaction[/C][/ROW]
[ROW][C]Raw Input[/C][C]view raw input (R code) [/C][/ROW]
[ROW][C]Raw Output[/C][C]view raw output of R engine [/C][/ROW]
[ROW][C]Computing time[/C][C]2 seconds[/C][/ROW]
[ROW][C]R Server[/C][C]'RServer@AstonUniversity' @ vre.aston.ac.uk[/C][/ROW]
[/TABLE]
Source: https://freestatistics.org/blog/index.php?pk=122227&T=0

Globally Unique Identifier (entire table): ba.freestatistics.org/blog/index.php?pk=122227&T=0

As an alternative you can also use a QR Code:  

The GUIDs for individual cells are displayed in the table below:

Summary of computational transaction
Raw Inputview raw input (R code)
Raw Outputview raw output of R engine
Computing time2 seconds
R Server'RServer@AstonUniversity' @ vre.aston.ac.uk


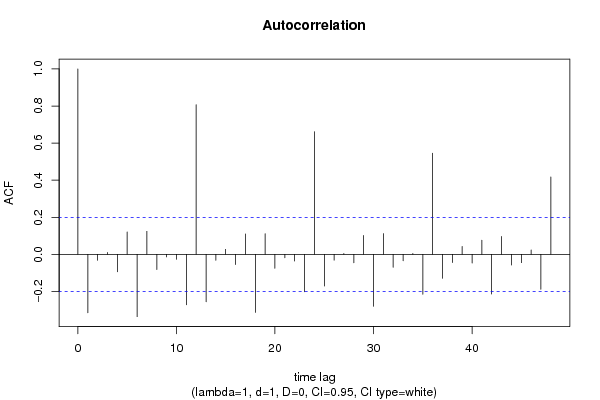
Autocorrelation Function
Time lag kACF(k)T-STATP-value
1-0.314607-3.09850.001272
2-0.031604-0.31130.378133
30.0100450.09890.460699
4-0.094033-0.92610.178341
50.1209311.1910.118273
6-0.335881-3.3080.000659
70.1243431.22460.111839
8-0.082252-0.81010.209936
9-0.013798-0.13590.446093
10-0.02659-0.26190.396984
11-0.271391-2.67290.004412
120.8069087.94710
13-0.255444-2.51580.006759
14-0.032345-0.31860.37537
150.0270510.26640.39524
16-0.054346-0.53520.296853
170.1104631.08790.139659
18-0.312867-3.08140.001341
190.1115731.09890.137273
20-0.074541-0.73410.232317
21-0.018416-0.18140.428226
22-0.035882-0.35340.362281
23-0.201346-1.9830.025096
240.6613456.51350
25-0.170457-1.67880.048205
26-0.03122-0.30750.379568
270.0044520.04390.482556
28-0.045819-0.45130.326403
290.101751.00210.159389
30-0.280347-2.76110.003445
310.1121431.10450.136058
32-0.069535-0.68480.247537
33-0.034992-0.34460.365558
340.0046230.04550.481889
35-0.215182-2.11930.01831
360.5458025.37550
37-0.128887-1.26940.10367
38-0.044432-0.43760.331322
390.0425250.41880.338136
40-0.046978-0.46270.322314
410.0762330.75080.227291
42-0.213382-2.10160.019091
430.0960750.94620.173192
44-0.057453-0.56580.286402
45-0.044546-0.43870.330916
460.0240570.23690.406604
47-0.188231-1.85390.033399
480.4178484.11534.1e-05

\begin{tabular}{lllllllll}
\hline
Autocorrelation Function \tabularnewline
Time lag k & ACF(k) & T-STAT & P-value \tabularnewline
1 & -0.314607 & -3.0985 & 0.001272 \tabularnewline
2 & -0.031604 & -0.3113 & 0.378133 \tabularnewline
3 & 0.010045 & 0.0989 & 0.460699 \tabularnewline
4 & -0.094033 & -0.9261 & 0.178341 \tabularnewline
5 & 0.120931 & 1.191 & 0.118273 \tabularnewline
6 & -0.335881 & -3.308 & 0.000659 \tabularnewline
7 & 0.124343 & 1.2246 & 0.111839 \tabularnewline
8 & -0.082252 & -0.8101 & 0.209936 \tabularnewline
9 & -0.013798 & -0.1359 & 0.446093 \tabularnewline
10 & -0.02659 & -0.2619 & 0.396984 \tabularnewline
11 & -0.271391 & -2.6729 & 0.004412 \tabularnewline
12 & 0.806908 & 7.9471 & 0 \tabularnewline
13 & -0.255444 & -2.5158 & 0.006759 \tabularnewline
14 & -0.032345 & -0.3186 & 0.37537 \tabularnewline
15 & 0.027051 & 0.2664 & 0.39524 \tabularnewline
16 & -0.054346 & -0.5352 & 0.296853 \tabularnewline
17 & 0.110463 & 1.0879 & 0.139659 \tabularnewline
18 & -0.312867 & -3.0814 & 0.001341 \tabularnewline
19 & 0.111573 & 1.0989 & 0.137273 \tabularnewline
20 & -0.074541 & -0.7341 & 0.232317 \tabularnewline
21 & -0.018416 & -0.1814 & 0.428226 \tabularnewline
22 & -0.035882 & -0.3534 & 0.362281 \tabularnewline
23 & -0.201346 & -1.983 & 0.025096 \tabularnewline
24 & 0.661345 & 6.5135 & 0 \tabularnewline
25 & -0.170457 & -1.6788 & 0.048205 \tabularnewline
26 & -0.03122 & -0.3075 & 0.379568 \tabularnewline
27 & 0.004452 & 0.0439 & 0.482556 \tabularnewline
28 & -0.045819 & -0.4513 & 0.326403 \tabularnewline
29 & 0.10175 & 1.0021 & 0.159389 \tabularnewline
30 & -0.280347 & -2.7611 & 0.003445 \tabularnewline
31 & 0.112143 & 1.1045 & 0.136058 \tabularnewline
32 & -0.069535 & -0.6848 & 0.247537 \tabularnewline
33 & -0.034992 & -0.3446 & 0.365558 \tabularnewline
34 & 0.004623 & 0.0455 & 0.481889 \tabularnewline
35 & -0.215182 & -2.1193 & 0.01831 \tabularnewline
36 & 0.545802 & 5.3755 & 0 \tabularnewline
37 & -0.128887 & -1.2694 & 0.10367 \tabularnewline
38 & -0.044432 & -0.4376 & 0.331322 \tabularnewline
39 & 0.042525 & 0.4188 & 0.338136 \tabularnewline
40 & -0.046978 & -0.4627 & 0.322314 \tabularnewline
41 & 0.076233 & 0.7508 & 0.227291 \tabularnewline
42 & -0.213382 & -2.1016 & 0.019091 \tabularnewline
43 & 0.096075 & 0.9462 & 0.173192 \tabularnewline
44 & -0.057453 & -0.5658 & 0.286402 \tabularnewline
45 & -0.044546 & -0.4387 & 0.330916 \tabularnewline
46 & 0.024057 & 0.2369 & 0.406604 \tabularnewline
47 & -0.188231 & -1.8539 & 0.033399 \tabularnewline
48 & 0.417848 & 4.1153 & 4.1e-05 \tabularnewline
\hline
\end{tabular}
%Source: https://freestatistics.org/blog/index.php?pk=122227&T=1

[TABLE]
[ROW][C]Autocorrelation Function[/C][/ROW]
[ROW][C]Time lag k[/C][C]ACF(k)[/C][C]T-STAT[/C][C]P-value[/C][/ROW]
[ROW][C]1[/C][C]-0.314607[/C][C]-3.0985[/C][C]0.001272[/C][/ROW]
[ROW][C]2[/C][C]-0.031604[/C][C]-0.3113[/C][C]0.378133[/C][/ROW]
[ROW][C]3[/C][C]0.010045[/C][C]0.0989[/C][C]0.460699[/C][/ROW]
[ROW][C]4[/C][C]-0.094033[/C][C]-0.9261[/C][C]0.178341[/C][/ROW]
[ROW][C]5[/C][C]0.120931[/C][C]1.191[/C][C]0.118273[/C][/ROW]
[ROW][C]6[/C][C]-0.335881[/C][C]-3.308[/C][C]0.000659[/C][/ROW]
[ROW][C]7[/C][C]0.124343[/C][C]1.2246[/C][C]0.111839[/C][/ROW]
[ROW][C]8[/C][C]-0.082252[/C][C]-0.8101[/C][C]0.209936[/C][/ROW]
[ROW][C]9[/C][C]-0.013798[/C][C]-0.1359[/C][C]0.446093[/C][/ROW]
[ROW][C]10[/C][C]-0.02659[/C][C]-0.2619[/C][C]0.396984[/C][/ROW]
[ROW][C]11[/C][C]-0.271391[/C][C]-2.6729[/C][C]0.004412[/C][/ROW]
[ROW][C]12[/C][C]0.806908[/C][C]7.9471[/C][C]0[/C][/ROW]
[ROW][C]13[/C][C]-0.255444[/C][C]-2.5158[/C][C]0.006759[/C][/ROW]
[ROW][C]14[/C][C]-0.032345[/C][C]-0.3186[/C][C]0.37537[/C][/ROW]
[ROW][C]15[/C][C]0.027051[/C][C]0.2664[/C][C]0.39524[/C][/ROW]
[ROW][C]16[/C][C]-0.054346[/C][C]-0.5352[/C][C]0.296853[/C][/ROW]
[ROW][C]17[/C][C]0.110463[/C][C]1.0879[/C][C]0.139659[/C][/ROW]
[ROW][C]18[/C][C]-0.312867[/C][C]-3.0814[/C][C]0.001341[/C][/ROW]
[ROW][C]19[/C][C]0.111573[/C][C]1.0989[/C][C]0.137273[/C][/ROW]
[ROW][C]20[/C][C]-0.074541[/C][C]-0.7341[/C][C]0.232317[/C][/ROW]
[ROW][C]21[/C][C]-0.018416[/C][C]-0.1814[/C][C]0.428226[/C][/ROW]
[ROW][C]22[/C][C]-0.035882[/C][C]-0.3534[/C][C]0.362281[/C][/ROW]
[ROW][C]23[/C][C]-0.201346[/C][C]-1.983[/C][C]0.025096[/C][/ROW]
[ROW][C]24[/C][C]0.661345[/C][C]6.5135[/C][C]0[/C][/ROW]
[ROW][C]25[/C][C]-0.170457[/C][C]-1.6788[/C][C]0.048205[/C][/ROW]
[ROW][C]26[/C][C]-0.03122[/C][C]-0.3075[/C][C]0.379568[/C][/ROW]
[ROW][C]27[/C][C]0.004452[/C][C]0.0439[/C][C]0.482556[/C][/ROW]
[ROW][C]28[/C][C]-0.045819[/C][C]-0.4513[/C][C]0.326403[/C][/ROW]
[ROW][C]29[/C][C]0.10175[/C][C]1.0021[/C][C]0.159389[/C][/ROW]
[ROW][C]30[/C][C]-0.280347[/C][C]-2.7611[/C][C]0.003445[/C][/ROW]
[ROW][C]31[/C][C]0.112143[/C][C]1.1045[/C][C]0.136058[/C][/ROW]
[ROW][C]32[/C][C]-0.069535[/C][C]-0.6848[/C][C]0.247537[/C][/ROW]
[ROW][C]33[/C][C]-0.034992[/C][C]-0.3446[/C][C]0.365558[/C][/ROW]
[ROW][C]34[/C][C]0.004623[/C][C]0.0455[/C][C]0.481889[/C][/ROW]
[ROW][C]35[/C][C]-0.215182[/C][C]-2.1193[/C][C]0.01831[/C][/ROW]
[ROW][C]36[/C][C]0.545802[/C][C]5.3755[/C][C]0[/C][/ROW]
[ROW][C]37[/C][C]-0.128887[/C][C]-1.2694[/C][C]0.10367[/C][/ROW]
[ROW][C]38[/C][C]-0.044432[/C][C]-0.4376[/C][C]0.331322[/C][/ROW]
[ROW][C]39[/C][C]0.042525[/C][C]0.4188[/C][C]0.338136[/C][/ROW]
[ROW][C]40[/C][C]-0.046978[/C][C]-0.4627[/C][C]0.322314[/C][/ROW]
[ROW][C]41[/C][C]0.076233[/C][C]0.7508[/C][C]0.227291[/C][/ROW]
[ROW][C]42[/C][C]-0.213382[/C][C]-2.1016[/C][C]0.019091[/C][/ROW]
[ROW][C]43[/C][C]0.096075[/C][C]0.9462[/C][C]0.173192[/C][/ROW]
[ROW][C]44[/C][C]-0.057453[/C][C]-0.5658[/C][C]0.286402[/C][/ROW]
[ROW][C]45[/C][C]-0.044546[/C][C]-0.4387[/C][C]0.330916[/C][/ROW]
[ROW][C]46[/C][C]0.024057[/C][C]0.2369[/C][C]0.406604[/C][/ROW]
[ROW][C]47[/C][C]-0.188231[/C][C]-1.8539[/C][C]0.033399[/C][/ROW]
[ROW][C]48[/C][C]0.417848[/C][C]4.1153[/C][C]4.1e-05[/C][/ROW]
[/TABLE]
Source: https://freestatistics.org/blog/index.php?pk=122227&T=1

Globally Unique Identifier (entire table): ba.freestatistics.org/blog/index.php?pk=122227&T=1

As an alternative you can also use a QR Code:  

The GUIDs for individual cells are displayed in the table below:

Autocorrelation Function
Time lag kACF(k)T-STATP-value
1-0.314607-3.09850.001272
2-0.031604-0.31130.378133
30.0100450.09890.460699
4-0.094033-0.92610.178341
50.1209311.1910.118273
6-0.335881-3.3080.000659
70.1243431.22460.111839
8-0.082252-0.81010.209936
9-0.013798-0.13590.446093
10-0.02659-0.26190.396984
11-0.271391-2.67290.004412
120.8069087.94710
13-0.255444-2.51580.006759
14-0.032345-0.31860.37537
150.0270510.26640.39524
16-0.054346-0.53520.296853
170.1104631.08790.139659
18-0.312867-3.08140.001341
190.1115731.09890.137273
20-0.074541-0.73410.232317
21-0.018416-0.18140.428226
22-0.035882-0.35340.362281
23-0.201346-1.9830.025096
240.6613456.51350
25-0.170457-1.67880.048205
26-0.03122-0.30750.379568
270.0044520.04390.482556
28-0.045819-0.45130.326403
290.101751.00210.159389
30-0.280347-2.76110.003445
310.1121431.10450.136058
32-0.069535-0.68480.247537
33-0.034992-0.34460.365558
340.0046230.04550.481889
35-0.215182-2.11930.01831
360.5458025.37550
37-0.128887-1.26940.10367
38-0.044432-0.43760.331322
390.0425250.41880.338136
40-0.046978-0.46270.322314
410.0762330.75080.227291
42-0.213382-2.10160.019091
430.0960750.94620.173192
44-0.057453-0.56580.286402
45-0.044546-0.43870.330916
460.0240570.23690.406604
47-0.188231-1.85390.033399
480.4178484.11534.1e-05


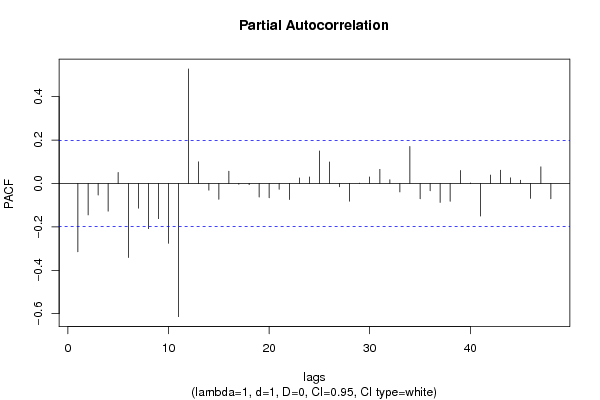
Partial Autocorrelation Function
Time lag kPACF(k)T-STATP-value
1-0.314607-3.09850.001272
2-0.144927-1.42740.078343
3-0.053207-0.5240.300726
4-0.127629-1.2570.105885
50.0511240.50350.307872
6-0.341488-3.36330.000552
7-0.113788-1.12070.132596
8-0.208126-2.04980.021541
9-0.16221-1.59760.056695
10-0.275861-2.71690.003902
11-0.613782-6.04510
120.5277995.19821e-06
130.0996080.9810.164511
14-0.030798-0.30330.381144
15-0.073139-0.72030.236525
160.0561850.55340.290644
17-0.004119-0.04060.483861
18-0.005431-0.05350.478728
19-0.062787-0.61840.268888
20-0.066099-0.6510.258294
21-0.026747-0.26340.396388
22-0.073975-0.72860.234011
230.0253230.24940.401787
240.0301120.29660.383717
250.1502041.47930.071146
260.0990980.9760.165746
27-0.015369-0.15140.440001
28-0.081615-0.80380.211735
290.0006250.00620.497549
300.0295640.29120.385771
310.0651450.64160.261321
320.0170340.16780.433558
33-0.038766-0.38180.351721
340.1708051.68220.04787
35-0.070418-0.69350.244816
36-0.033373-0.32870.371553
37-0.087318-0.860.195961
38-0.082384-0.81140.209564
390.0602690.59360.277086
400.0024950.02460.490222
41-0.150401-1.48130.070886
420.0385660.37980.352451
430.0612230.6030.273966
440.0259650.25570.399353
450.0152540.15020.440447
46-0.068861-0.67820.249628
470.0767380.75580.225806
48-0.070892-0.69820.243358

\begin{tabular}{lllllllll}
\hline
Partial Autocorrelation Function \tabularnewline
Time lag k & PACF(k) & T-STAT & P-value \tabularnewline
1 & -0.314607 & -3.0985 & 0.001272 \tabularnewline
2 & -0.144927 & -1.4274 & 0.078343 \tabularnewline
3 & -0.053207 & -0.524 & 0.300726 \tabularnewline
4 & -0.127629 & -1.257 & 0.105885 \tabularnewline
5 & 0.051124 & 0.5035 & 0.307872 \tabularnewline
6 & -0.341488 & -3.3633 & 0.000552 \tabularnewline
7 & -0.113788 & -1.1207 & 0.132596 \tabularnewline
8 & -0.208126 & -2.0498 & 0.021541 \tabularnewline
9 & -0.16221 & -1.5976 & 0.056695 \tabularnewline
10 & -0.275861 & -2.7169 & 0.003902 \tabularnewline
11 & -0.613782 & -6.0451 & 0 \tabularnewline
12 & 0.527799 & 5.1982 & 1e-06 \tabularnewline
13 & 0.099608 & 0.981 & 0.164511 \tabularnewline
14 & -0.030798 & -0.3033 & 0.381144 \tabularnewline
15 & -0.073139 & -0.7203 & 0.236525 \tabularnewline
16 & 0.056185 & 0.5534 & 0.290644 \tabularnewline
17 & -0.004119 & -0.0406 & 0.483861 \tabularnewline
18 & -0.005431 & -0.0535 & 0.478728 \tabularnewline
19 & -0.062787 & -0.6184 & 0.268888 \tabularnewline
20 & -0.066099 & -0.651 & 0.258294 \tabularnewline
21 & -0.026747 & -0.2634 & 0.396388 \tabularnewline
22 & -0.073975 & -0.7286 & 0.234011 \tabularnewline
23 & 0.025323 & 0.2494 & 0.401787 \tabularnewline
24 & 0.030112 & 0.2966 & 0.383717 \tabularnewline
25 & 0.150204 & 1.4793 & 0.071146 \tabularnewline
26 & 0.099098 & 0.976 & 0.165746 \tabularnewline
27 & -0.015369 & -0.1514 & 0.440001 \tabularnewline
28 & -0.081615 & -0.8038 & 0.211735 \tabularnewline
29 & 0.000625 & 0.0062 & 0.497549 \tabularnewline
30 & 0.029564 & 0.2912 & 0.385771 \tabularnewline
31 & 0.065145 & 0.6416 & 0.261321 \tabularnewline
32 & 0.017034 & 0.1678 & 0.433558 \tabularnewline
33 & -0.038766 & -0.3818 & 0.351721 \tabularnewline
34 & 0.170805 & 1.6822 & 0.04787 \tabularnewline
35 & -0.070418 & -0.6935 & 0.244816 \tabularnewline
36 & -0.033373 & -0.3287 & 0.371553 \tabularnewline
37 & -0.087318 & -0.86 & 0.195961 \tabularnewline
38 & -0.082384 & -0.8114 & 0.209564 \tabularnewline
39 & 0.060269 & 0.5936 & 0.277086 \tabularnewline
40 & 0.002495 & 0.0246 & 0.490222 \tabularnewline
41 & -0.150401 & -1.4813 & 0.070886 \tabularnewline
42 & 0.038566 & 0.3798 & 0.352451 \tabularnewline
43 & 0.061223 & 0.603 & 0.273966 \tabularnewline
44 & 0.025965 & 0.2557 & 0.399353 \tabularnewline
45 & 0.015254 & 0.1502 & 0.440447 \tabularnewline
46 & -0.068861 & -0.6782 & 0.249628 \tabularnewline
47 & 0.076738 & 0.7558 & 0.225806 \tabularnewline
48 & -0.070892 & -0.6982 & 0.243358 \tabularnewline
\hline
\end{tabular}
%Source: https://freestatistics.org/blog/index.php?pk=122227&T=2

[TABLE]
[ROW][C]Partial Autocorrelation Function[/C][/ROW]
[ROW][C]Time lag k[/C][C]PACF(k)[/C][C]T-STAT[/C][C]P-value[/C][/ROW]
[ROW][C]1[/C][C]-0.314607[/C][C]-3.0985[/C][C]0.001272[/C][/ROW]
[ROW][C]2[/C][C]-0.144927[/C][C]-1.4274[/C][C]0.078343[/C][/ROW]
[ROW][C]3[/C][C]-0.053207[/C][C]-0.524[/C][C]0.300726[/C][/ROW]
[ROW][C]4[/C][C]-0.127629[/C][C]-1.257[/C][C]0.105885[/C][/ROW]
[ROW][C]5[/C][C]0.051124[/C][C]0.5035[/C][C]0.307872[/C][/ROW]
[ROW][C]6[/C][C]-0.341488[/C][C]-3.3633[/C][C]0.000552[/C][/ROW]
[ROW][C]7[/C][C]-0.113788[/C][C]-1.1207[/C][C]0.132596[/C][/ROW]
[ROW][C]8[/C][C]-0.208126[/C][C]-2.0498[/C][C]0.021541[/C][/ROW]
[ROW][C]9[/C][C]-0.16221[/C][C]-1.5976[/C][C]0.056695[/C][/ROW]
[ROW][C]10[/C][C]-0.275861[/C][C]-2.7169[/C][C]0.003902[/C][/ROW]
[ROW][C]11[/C][C]-0.613782[/C][C]-6.0451[/C][C]0[/C][/ROW]
[ROW][C]12[/C][C]0.527799[/C][C]5.1982[/C][C]1e-06[/C][/ROW]
[ROW][C]13[/C][C]0.099608[/C][C]0.981[/C][C]0.164511[/C][/ROW]
[ROW][C]14[/C][C]-0.030798[/C][C]-0.3033[/C][C]0.381144[/C][/ROW]
[ROW][C]15[/C][C]-0.073139[/C][C]-0.7203[/C][C]0.236525[/C][/ROW]
[ROW][C]16[/C][C]0.056185[/C][C]0.5534[/C][C]0.290644[/C][/ROW]
[ROW][C]17[/C][C]-0.004119[/C][C]-0.0406[/C][C]0.483861[/C][/ROW]
[ROW][C]18[/C][C]-0.005431[/C][C]-0.0535[/C][C]0.478728[/C][/ROW]
[ROW][C]19[/C][C]-0.062787[/C][C]-0.6184[/C][C]0.268888[/C][/ROW]
[ROW][C]20[/C][C]-0.066099[/C][C]-0.651[/C][C]0.258294[/C][/ROW]
[ROW][C]21[/C][C]-0.026747[/C][C]-0.2634[/C][C]0.396388[/C][/ROW]
[ROW][C]22[/C][C]-0.073975[/C][C]-0.7286[/C][C]0.234011[/C][/ROW]
[ROW][C]23[/C][C]0.025323[/C][C]0.2494[/C][C]0.401787[/C][/ROW]
[ROW][C]24[/C][C]0.030112[/C][C]0.2966[/C][C]0.383717[/C][/ROW]
[ROW][C]25[/C][C]0.150204[/C][C]1.4793[/C][C]0.071146[/C][/ROW]
[ROW][C]26[/C][C]0.099098[/C][C]0.976[/C][C]0.165746[/C][/ROW]
[ROW][C]27[/C][C]-0.015369[/C][C]-0.1514[/C][C]0.440001[/C][/ROW]
[ROW][C]28[/C][C]-0.081615[/C][C]-0.8038[/C][C]0.211735[/C][/ROW]
[ROW][C]29[/C][C]0.000625[/C][C]0.0062[/C][C]0.497549[/C][/ROW]
[ROW][C]30[/C][C]0.029564[/C][C]0.2912[/C][C]0.385771[/C][/ROW]
[ROW][C]31[/C][C]0.065145[/C][C]0.6416[/C][C]0.261321[/C][/ROW]
[ROW][C]32[/C][C]0.017034[/C][C]0.1678[/C][C]0.433558[/C][/ROW]
[ROW][C]33[/C][C]-0.038766[/C][C]-0.3818[/C][C]0.351721[/C][/ROW]
[ROW][C]34[/C][C]0.170805[/C][C]1.6822[/C][C]0.04787[/C][/ROW]
[ROW][C]35[/C][C]-0.070418[/C][C]-0.6935[/C][C]0.244816[/C][/ROW]
[ROW][C]36[/C][C]-0.033373[/C][C]-0.3287[/C][C]0.371553[/C][/ROW]
[ROW][C]37[/C][C]-0.087318[/C][C]-0.86[/C][C]0.195961[/C][/ROW]
[ROW][C]38[/C][C]-0.082384[/C][C]-0.8114[/C][C]0.209564[/C][/ROW]
[ROW][C]39[/C][C]0.060269[/C][C]0.5936[/C][C]0.277086[/C][/ROW]
[ROW][C]40[/C][C]0.002495[/C][C]0.0246[/C][C]0.490222[/C][/ROW]
[ROW][C]41[/C][C]-0.150401[/C][C]-1.4813[/C][C]0.070886[/C][/ROW]
[ROW][C]42[/C][C]0.038566[/C][C]0.3798[/C][C]0.352451[/C][/ROW]
[ROW][C]43[/C][C]0.061223[/C][C]0.603[/C][C]0.273966[/C][/ROW]
[ROW][C]44[/C][C]0.025965[/C][C]0.2557[/C][C]0.399353[/C][/ROW]
[ROW][C]45[/C][C]0.015254[/C][C]0.1502[/C][C]0.440447[/C][/ROW]
[ROW][C]46[/C][C]-0.068861[/C][C]-0.6782[/C][C]0.249628[/C][/ROW]
[ROW][C]47[/C][C]0.076738[/C][C]0.7558[/C][C]0.225806[/C][/ROW]
[ROW][C]48[/C][C]-0.070892[/C][C]-0.6982[/C][C]0.243358[/C][/ROW]
[/TABLE]
Source: https://freestatistics.org/blog/index.php?pk=122227&T=2

Globally Unique Identifier (entire table): ba.freestatistics.org/blog/index.php?pk=122227&T=2

As an alternative you can also use a QR Code:  

The GUIDs for individual cells are displayed in the table below:

Partial Autocorrelation Function
Time lag kPACF(k)T-STATP-value
1-0.314607-3.09850.001272
2-0.144927-1.42740.078343
3-0.053207-0.5240.300726
4-0.127629-1.2570.105885
50.0511240.50350.307872
6-0.341488-3.36330.000552
7-0.113788-1.12070.132596
8-0.208126-2.04980.021541
9-0.16221-1.59760.056695
10-0.275861-2.71690.003902
11-0.613782-6.04510
120.5277995.19821e-06
130.0996080.9810.164511
14-0.030798-0.30330.381144
15-0.073139-0.72030.236525
160.0561850.55340.290644
17-0.004119-0.04060.483861
18-0.005431-0.05350.478728
19-0.062787-0.61840.268888
20-0.066099-0.6510.258294
21-0.026747-0.26340.396388
22-0.073975-0.72860.234011
230.0253230.24940.401787
240.0301120.29660.383717
250.1502041.47930.071146
260.0990980.9760.165746
27-0.015369-0.15140.440001
28-0.081615-0.80380.211735
290.0006250.00620.497549
300.0295640.29120.385771
310.0651450.64160.261321
320.0170340.16780.433558
33-0.038766-0.38180.351721
340.1708051.68220.04787
35-0.070418-0.69350.244816
36-0.033373-0.32870.371553
37-0.087318-0.860.195961
38-0.082384-0.81140.209564
390.0602690.59360.277086
400.0024950.02460.490222
41-0.150401-1.48130.070886
420.0385660.37980.352451
430.0612230.6030.273966
440.0259650.25570.399353
450.0152540.15020.440447
46-0.068861-0.67820.249628
470.0767380.75580.225806
48-0.070892-0.69820.243358


Parameters (Session):
par1 = grey ;
Parameters (R input):
par1 = 48 ; par2 = 1 ; par3 = 1 ; par4 = 0 ; par5 = 12 ; par6 = White Noise ; par7 = 0.95 ; par8 = ;
R code (references can be found in the software module):
if (par1 == 'Default') {
par1 = 10*log10(length(x))
} else {
par1 <- as.numeric(par1)
}
par2 <- as.numeric(par2)
par3 <- as.numeric(par3)
par4 <- as.numeric(par4)
par5 <- as.numeric(par5)
if (par6 == 'White Noise') par6 <- 'white' else par6 <- 'ma'
par7 <- as.numeric(par7)
if (par8 != '') par8 <- as.numeric(par8)
ox <- x
if (par8 == '') {
if (par2 == 0) {
x <- log(x)
} else {
x <- (x ^ par2 - 1) / par2
}
} else {
x <- log(x,base=par8)
}
if (par3 > 0) x <- diff(x,lag=1,difference=par3)
if (par4 > 0) x <- diff(x,lag=par5,difference=par4)
bitmap(file='picts.png')
op <- par(mfrow=c(2,1))
plot(ox,type='l',main='Original Time Series',xlab='time',ylab='value')
if (par8=='') {
mytitle <- paste('Working Time Series (lambda=',par2,', d=',par3,', D=',par4,')',sep='')
mysub <- paste('(lambda=',par2,', d=',par3,', D=',par4,', CI=', par7, ', CI type=',par6,')',sep='')
} else {
mytitle <- paste('Working Time Series (base=',par8,', d=',par3,', D=',par4,')',sep='')
mysub <- paste('(base=',par8,', d=',par3,', D=',par4,', CI=', par7, ', CI type=',par6,')',sep='')
}
plot(x,type='l', main=mytitle,xlab='time',ylab='value')
par(op)
dev.off()
bitmap(file='pic1.png')
racf <- acf(x, par1, main='Autocorrelation', xlab='time lag', ylab='ACF', ci.type=par6, ci=par7, sub=mysub)
dev.off()
bitmap(file='pic2.png')
rpacf <- pacf(x,par1,main='Partial Autocorrelation',xlab='lags',ylab='PACF',sub=mysub)
dev.off()
(myacf <- c(racf$acf))
(mypacf <- c(rpacf$acf))
lengthx <- length(x)
sqrtn <- sqrt(lengthx)
load(file='createtable')
a<-table.start()
a<-table.row.start(a)
a<-table.element(a,'Autocorrelation Function',4,TRUE)
a<-table.row.end(a)
a<-table.row.start(a)
a<-table.element(a,'Time lag k',header=TRUE)
a<-table.element(a,hyperlink('basics.htm','ACF(k)','click here for more information about the Autocorrelation Function'),header=TRUE)
a<-table.element(a,'T-STAT',header=TRUE)
a<-table.element(a,'P-value',header=TRUE)
a<-table.row.end(a)
for (i in 2:(par1+1)) {
a<-table.row.start(a)
a<-table.element(a,i-1,header=TRUE)
a<-table.element(a,round(myacf[i],6))
mytstat <- myacf[i]*sqrtn
a<-table.element(a,round(mytstat,4))
a<-table.element(a,round(1-pt(abs(mytstat),lengthx),6))
a<-table.row.end(a)
}
a<-table.end(a)
table.save(a,file='mytable.tab')
a<-table.start()
a<-table.row.start(a)
a<-table.element(a,'Partial Autocorrelation Function',4,TRUE)
a<-table.row.end(a)
a<-table.row.start(a)
a<-table.element(a,'Time lag k',header=TRUE)
a<-table.element(a,hyperlink('basics.htm','PACF(k)','click here for more information about the Partial Autocorrelation Function'),header=TRUE)
a<-table.element(a,'T-STAT',header=TRUE)
a<-table.element(a,'P-value',header=TRUE)
a<-table.row.end(a)
for (i in 1:par1) {
a<-table.row.start(a)
a<-table.element(a,i,header=TRUE)
a<-table.element(a,round(mypacf[i],6))
mytstat <- mypacf[i]*sqrtn
a<-table.element(a,round(mytstat,4))
a<-table.element(a,round(1-pt(abs(mytstat),lengthx),6))
a<-table.row.end(a)
}
a<-table.end(a)
table.save(a,file='mytable1.tab')