Free Statistics

of Irreproducible Research!

Author's title

Author*Unverified author*
R Software Modulerwasp_autocorrelation.wasp
Title produced by software(Partial) Autocorrelation Function
Date of computationThu, 19 May 2011 17:47:08 +0000
Cite this page as followsStatistical Computations at FreeStatistics.org, Office for Research Development and Education, URL https://freestatistics.org/blog/index.php?v=date/2011/May/19/t1305827123sx501uasafitypk.htm/, Retrieved Sat, 11 May 2024 17:21:27 +0000
Statistical Computations at FreeStatistics.org, Office for Research Development and Education, URL https://freestatistics.org/blog/index.php?pk=122160, Retrieved Sat, 11 May 2024 17:21:27 +0000
QR Codes:

Original text written by user:
IsPrivate?No (this computation is public)
User-defined keywordsKDGP2W12
Estimated Impact73
Family? (F = Feedback message, R = changed R code, M = changed R Module, P = changed Parameters, D = changed Data)
-       [(Partial) Autocorrelation Function] [] [2011-05-19 17:47:08] [31b126aa1b32aa85c8fd6bf40153b92b] [Current]
Feedback Forum

Post a new message
Dataseries X:
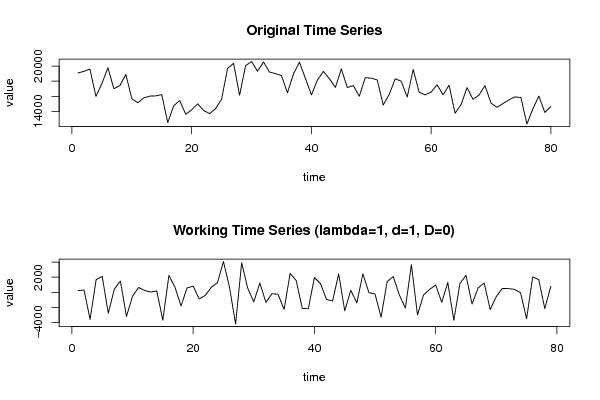
19097.1
19304.6
19601.7
16006.9
17681.2
19790.4
17014.2
17424.5
18908.9
15692.1
15160
15794.3
16032.1
16065
16236.8
12521
14762.1
15446.9
13635
14212.6
15021.7
14134.3
13721.4
14384.5
15638.6
19711.6
20359.8
16141.4
20056.9
20605.5
19325.8
20547.7
19211.2
19009.5
18746.8
16471.5
18957.2
20515.2
18374.4
16192.9
18147.5
19301.4
18344.7
17183.6
19630
17167.2
17428.5
16016.5
18466.5
18406.6
18174.1
14851.9
16260.7
18329.6
18003.8
15903.8
19554.2
16554.2
16198.9
16571.8
17535.2
16198.1
17487.5
13768
14915.8
17160.9
15607.4
16181.5
17413.2
15116.3
14544.5
15050.6
15535.4
15919.3
15853.1
12336.4
14355.5
16040.8
13867.7
14656.6


Summary of computational transaction
Raw Inputview raw input (R code)
Raw Outputview raw output of R engine
Computing time2 seconds
R Server'George Udny Yule' @ 216.218.223.82

\begin{tabular}{lllllllll}
\hline
Summary of computational transaction \tabularnewline
Raw Input & view raw input (R code)  \tabularnewline
Raw Output & view raw output of R engine  \tabularnewline
Computing time & 2 seconds \tabularnewline
R Server & 'George Udny Yule' @ 216.218.223.82 \tabularnewline
\hline
\end{tabular}
%Source: https://freestatistics.org/blog/index.php?pk=122160&T=0

[TABLE]
[ROW][C]Summary of computational transaction[/C][/ROW]
[ROW][C]Raw Input[/C][C]view raw input (R code) [/C][/ROW]
[ROW][C]Raw Output[/C][C]view raw output of R engine [/C][/ROW]
[ROW][C]Computing time[/C][C]2 seconds[/C][/ROW]
[ROW][C]R Server[/C][C]'George Udny Yule' @ 216.218.223.82[/C][/ROW]
[/TABLE]
Source: https://freestatistics.org/blog/index.php?pk=122160&T=0

Globally Unique Identifier (entire table): ba.freestatistics.org/blog/index.php?pk=122160&T=0

As an alternative you can also use a QR Code:  

The GUIDs for individual cells are displayed in the table below:

Summary of computational transaction
Raw Inputview raw input (R code)
Raw Outputview raw output of R engine
Computing time2 seconds
R Server'George Udny Yule' @ 216.218.223.82


Autocorrelation Function
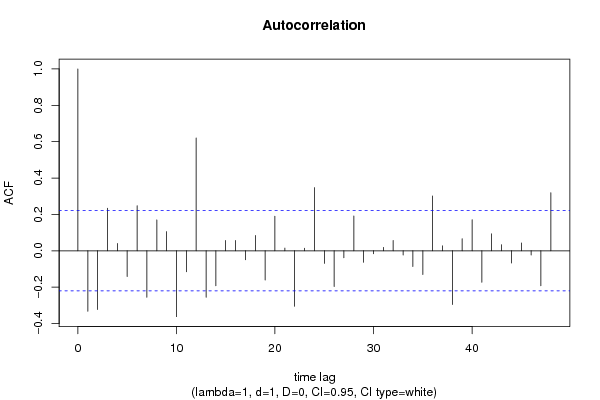
Time lag kACF(k)T-STATP-value
1-0.332431-2.95470.002061
2-0.323114-2.87190.002618
30.2335332.07570.020588
40.0400390.35590.361443
5-0.141719-1.25960.105756
60.247232.19740.01546
7-0.255625-2.2720.012902
80.1697751.5090.067645
90.1051260.93440.176476
10-0.362382-3.22090.000928
11-0.115078-1.02280.154754
120.6200475.51110
13-0.25595-2.27490.012811
14-0.192926-1.71480.045155
150.0560770.49840.309785
160.0562630.50010.309205
17-0.049016-0.43570.332135
180.0837820.74470.229341
19-0.160904-1.43010.078309
200.1896951.6860.047866
210.0146650.13030.448314
22-0.305379-2.71430.004076
230.0142740.12690.449683
240.347163.08560.0014
25-0.069219-0.61520.270085
26-0.196667-1.7480.042173
27-0.038398-0.34130.366896
280.1912331.69970.04656
29-0.063352-0.56310.287487
30-0.016795-0.14930.440859
310.0185110.16450.434869
320.0567780.50470.307605
33-0.02332-0.20730.418165
34-0.086191-0.76610.222956
35-0.130729-1.16190.124379
360.3011932.67710.004515
370.0267970.23820.406182
38-0.295264-2.62440.005209
390.0664530.59070.27822
400.1703631.51420.06698
41-0.172817-1.5360.064263
420.0928460.82520.205862
430.0327170.29080.385986
44-0.067536-0.60030.27502
450.0425970.37860.352997
46-0.023532-0.20920.417431
47-0.192262-1.70890.045702
480.3190212.83550.002904

\begin{tabular}{lllllllll}
\hline
Autocorrelation Function \tabularnewline
Time lag k & ACF(k) & T-STAT & P-value \tabularnewline
1 & -0.332431 & -2.9547 & 0.002061 \tabularnewline
2 & -0.323114 & -2.8719 & 0.002618 \tabularnewline
3 & 0.233533 & 2.0757 & 0.020588 \tabularnewline
4 & 0.040039 & 0.3559 & 0.361443 \tabularnewline
5 & -0.141719 & -1.2596 & 0.105756 \tabularnewline
6 & 0.24723 & 2.1974 & 0.01546 \tabularnewline
7 & -0.255625 & -2.272 & 0.012902 \tabularnewline
8 & 0.169775 & 1.509 & 0.067645 \tabularnewline
9 & 0.105126 & 0.9344 & 0.176476 \tabularnewline
10 & -0.362382 & -3.2209 & 0.000928 \tabularnewline
11 & -0.115078 & -1.0228 & 0.154754 \tabularnewline
12 & 0.620047 & 5.5111 & 0 \tabularnewline
13 & -0.25595 & -2.2749 & 0.012811 \tabularnewline
14 & -0.192926 & -1.7148 & 0.045155 \tabularnewline
15 & 0.056077 & 0.4984 & 0.309785 \tabularnewline
16 & 0.056263 & 0.5001 & 0.309205 \tabularnewline
17 & -0.049016 & -0.4357 & 0.332135 \tabularnewline
18 & 0.083782 & 0.7447 & 0.229341 \tabularnewline
19 & -0.160904 & -1.4301 & 0.078309 \tabularnewline
20 & 0.189695 & 1.686 & 0.047866 \tabularnewline
21 & 0.014665 & 0.1303 & 0.448314 \tabularnewline
22 & -0.305379 & -2.7143 & 0.004076 \tabularnewline
23 & 0.014274 & 0.1269 & 0.449683 \tabularnewline
24 & 0.34716 & 3.0856 & 0.0014 \tabularnewline
25 & -0.069219 & -0.6152 & 0.270085 \tabularnewline
26 & -0.196667 & -1.748 & 0.042173 \tabularnewline
27 & -0.038398 & -0.3413 & 0.366896 \tabularnewline
28 & 0.191233 & 1.6997 & 0.04656 \tabularnewline
29 & -0.063352 & -0.5631 & 0.287487 \tabularnewline
30 & -0.016795 & -0.1493 & 0.440859 \tabularnewline
31 & 0.018511 & 0.1645 & 0.434869 \tabularnewline
32 & 0.056778 & 0.5047 & 0.307605 \tabularnewline
33 & -0.02332 & -0.2073 & 0.418165 \tabularnewline
34 & -0.086191 & -0.7661 & 0.222956 \tabularnewline
35 & -0.130729 & -1.1619 & 0.124379 \tabularnewline
36 & 0.301193 & 2.6771 & 0.004515 \tabularnewline
37 & 0.026797 & 0.2382 & 0.406182 \tabularnewline
38 & -0.295264 & -2.6244 & 0.005209 \tabularnewline
39 & 0.066453 & 0.5907 & 0.27822 \tabularnewline
40 & 0.170363 & 1.5142 & 0.06698 \tabularnewline
41 & -0.172817 & -1.536 & 0.064263 \tabularnewline
42 & 0.092846 & 0.8252 & 0.205862 \tabularnewline
43 & 0.032717 & 0.2908 & 0.385986 \tabularnewline
44 & -0.067536 & -0.6003 & 0.27502 \tabularnewline
45 & 0.042597 & 0.3786 & 0.352997 \tabularnewline
46 & -0.023532 & -0.2092 & 0.417431 \tabularnewline
47 & -0.192262 & -1.7089 & 0.045702 \tabularnewline
48 & 0.319021 & 2.8355 & 0.002904 \tabularnewline
\hline
\end{tabular}
%Source: https://freestatistics.org/blog/index.php?pk=122160&T=1

[TABLE]
[ROW][C]Autocorrelation Function[/C][/ROW]
[ROW][C]Time lag k[/C][C]ACF(k)[/C][C]T-STAT[/C][C]P-value[/C][/ROW]
[ROW][C]1[/C][C]-0.332431[/C][C]-2.9547[/C][C]0.002061[/C][/ROW]
[ROW][C]2[/C][C]-0.323114[/C][C]-2.8719[/C][C]0.002618[/C][/ROW]
[ROW][C]3[/C][C]0.233533[/C][C]2.0757[/C][C]0.020588[/C][/ROW]
[ROW][C]4[/C][C]0.040039[/C][C]0.3559[/C][C]0.361443[/C][/ROW]
[ROW][C]5[/C][C]-0.141719[/C][C]-1.2596[/C][C]0.105756[/C][/ROW]
[ROW][C]6[/C][C]0.24723[/C][C]2.1974[/C][C]0.01546[/C][/ROW]
[ROW][C]7[/C][C]-0.255625[/C][C]-2.272[/C][C]0.012902[/C][/ROW]
[ROW][C]8[/C][C]0.169775[/C][C]1.509[/C][C]0.067645[/C][/ROW]
[ROW][C]9[/C][C]0.105126[/C][C]0.9344[/C][C]0.176476[/C][/ROW]
[ROW][C]10[/C][C]-0.362382[/C][C]-3.2209[/C][C]0.000928[/C][/ROW]
[ROW][C]11[/C][C]-0.115078[/C][C]-1.0228[/C][C]0.154754[/C][/ROW]
[ROW][C]12[/C][C]0.620047[/C][C]5.5111[/C][C]0[/C][/ROW]
[ROW][C]13[/C][C]-0.25595[/C][C]-2.2749[/C][C]0.012811[/C][/ROW]
[ROW][C]14[/C][C]-0.192926[/C][C]-1.7148[/C][C]0.045155[/C][/ROW]
[ROW][C]15[/C][C]0.056077[/C][C]0.4984[/C][C]0.309785[/C][/ROW]
[ROW][C]16[/C][C]0.056263[/C][C]0.5001[/C][C]0.309205[/C][/ROW]
[ROW][C]17[/C][C]-0.049016[/C][C]-0.4357[/C][C]0.332135[/C][/ROW]
[ROW][C]18[/C][C]0.083782[/C][C]0.7447[/C][C]0.229341[/C][/ROW]
[ROW][C]19[/C][C]-0.160904[/C][C]-1.4301[/C][C]0.078309[/C][/ROW]
[ROW][C]20[/C][C]0.189695[/C][C]1.686[/C][C]0.047866[/C][/ROW]
[ROW][C]21[/C][C]0.014665[/C][C]0.1303[/C][C]0.448314[/C][/ROW]
[ROW][C]22[/C][C]-0.305379[/C][C]-2.7143[/C][C]0.004076[/C][/ROW]
[ROW][C]23[/C][C]0.014274[/C][C]0.1269[/C][C]0.449683[/C][/ROW]
[ROW][C]24[/C][C]0.34716[/C][C]3.0856[/C][C]0.0014[/C][/ROW]
[ROW][C]25[/C][C]-0.069219[/C][C]-0.6152[/C][C]0.270085[/C][/ROW]
[ROW][C]26[/C][C]-0.196667[/C][C]-1.748[/C][C]0.042173[/C][/ROW]
[ROW][C]27[/C][C]-0.038398[/C][C]-0.3413[/C][C]0.366896[/C][/ROW]
[ROW][C]28[/C][C]0.191233[/C][C]1.6997[/C][C]0.04656[/C][/ROW]
[ROW][C]29[/C][C]-0.063352[/C][C]-0.5631[/C][C]0.287487[/C][/ROW]
[ROW][C]30[/C][C]-0.016795[/C][C]-0.1493[/C][C]0.440859[/C][/ROW]
[ROW][C]31[/C][C]0.018511[/C][C]0.1645[/C][C]0.434869[/C][/ROW]
[ROW][C]32[/C][C]0.056778[/C][C]0.5047[/C][C]0.307605[/C][/ROW]
[ROW][C]33[/C][C]-0.02332[/C][C]-0.2073[/C][C]0.418165[/C][/ROW]
[ROW][C]34[/C][C]-0.086191[/C][C]-0.7661[/C][C]0.222956[/C][/ROW]
[ROW][C]35[/C][C]-0.130729[/C][C]-1.1619[/C][C]0.124379[/C][/ROW]
[ROW][C]36[/C][C]0.301193[/C][C]2.6771[/C][C]0.004515[/C][/ROW]
[ROW][C]37[/C][C]0.026797[/C][C]0.2382[/C][C]0.406182[/C][/ROW]
[ROW][C]38[/C][C]-0.295264[/C][C]-2.6244[/C][C]0.005209[/C][/ROW]
[ROW][C]39[/C][C]0.066453[/C][C]0.5907[/C][C]0.27822[/C][/ROW]
[ROW][C]40[/C][C]0.170363[/C][C]1.5142[/C][C]0.06698[/C][/ROW]
[ROW][C]41[/C][C]-0.172817[/C][C]-1.536[/C][C]0.064263[/C][/ROW]
[ROW][C]42[/C][C]0.092846[/C][C]0.8252[/C][C]0.205862[/C][/ROW]
[ROW][C]43[/C][C]0.032717[/C][C]0.2908[/C][C]0.385986[/C][/ROW]
[ROW][C]44[/C][C]-0.067536[/C][C]-0.6003[/C][C]0.27502[/C][/ROW]
[ROW][C]45[/C][C]0.042597[/C][C]0.3786[/C][C]0.352997[/C][/ROW]
[ROW][C]46[/C][C]-0.023532[/C][C]-0.2092[/C][C]0.417431[/C][/ROW]
[ROW][C]47[/C][C]-0.192262[/C][C]-1.7089[/C][C]0.045702[/C][/ROW]
[ROW][C]48[/C][C]0.319021[/C][C]2.8355[/C][C]0.002904[/C][/ROW]
[/TABLE]
Source: https://freestatistics.org/blog/index.php?pk=122160&T=1

Globally Unique Identifier (entire table): ba.freestatistics.org/blog/index.php?pk=122160&T=1

As an alternative you can also use a QR Code:  

The GUIDs for individual cells are displayed in the table below:

Autocorrelation Function
Time lag kACF(k)T-STATP-value
1-0.332431-2.95470.002061
2-0.323114-2.87190.002618
30.2335332.07570.020588
40.0400390.35590.361443
5-0.141719-1.25960.105756
60.247232.19740.01546
7-0.255625-2.2720.012902
80.1697751.5090.067645
90.1051260.93440.176476
10-0.362382-3.22090.000928
11-0.115078-1.02280.154754
120.6200475.51110
13-0.25595-2.27490.012811
14-0.192926-1.71480.045155
150.0560770.49840.309785
160.0562630.50010.309205
17-0.049016-0.43570.332135
180.0837820.74470.229341
19-0.160904-1.43010.078309
200.1896951.6860.047866
210.0146650.13030.448314
22-0.305379-2.71430.004076
230.0142740.12690.449683
240.347163.08560.0014
25-0.069219-0.61520.270085
26-0.196667-1.7480.042173
27-0.038398-0.34130.366896
280.1912331.69970.04656
29-0.063352-0.56310.287487
30-0.016795-0.14930.440859
310.0185110.16450.434869
320.0567780.50470.307605
33-0.02332-0.20730.418165
34-0.086191-0.76610.222956
35-0.130729-1.16190.124379
360.3011932.67710.004515
370.0267970.23820.406182
38-0.295264-2.62440.005209
390.0664530.59070.27822
400.1703631.51420.06698
41-0.172817-1.5360.064263
420.0928460.82520.205862
430.0327170.29080.385986
44-0.067536-0.60030.27502
450.0425970.37860.352997
46-0.023532-0.20920.417431
47-0.192262-1.70890.045702
480.3190212.83550.002904


Partial Autocorrelation Function
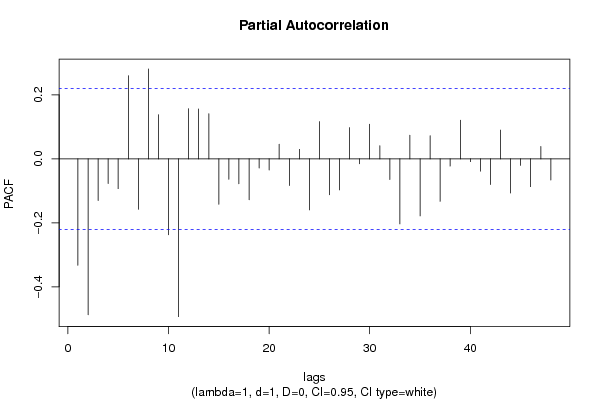
Time lag kPACF(k)T-STATP-value
1-0.332431-2.95470.002061
2-0.487499-4.3332.1e-05
3-0.130223-1.15740.125288
4-0.076914-0.68360.248106
5-0.093098-0.82750.205231
60.2597472.30870.011788
7-0.157617-1.40090.082575
80.2811272.49870.00727
90.1378421.22520.112076
10-0.237104-2.10740.019126
11-0.493206-4.38371.8e-05
120.1569331.39490.083485
130.1558821.38550.084898
140.1412761.25570.106464
15-0.141997-1.26210.105313
16-0.063544-0.56480.286907
17-0.077595-0.68970.246208
18-0.127795-1.13590.129723
19-0.02858-0.2540.400068
20-0.034611-0.30760.379588
210.0459410.40830.342067
22-0.083175-0.73930.230965
230.0298090.2650.395868
24-0.159549-1.41810.080047
250.116591.03630.151619
26-0.112086-0.99620.161088
27-0.096929-0.86150.195778
280.0976740.86810.193972
29-0.015243-0.13550.446287
300.1084180.96360.169083
310.0413110.36720.357234
32-0.064714-0.57520.283399
33-0.20333-1.80720.037266
340.073890.65670.256625
35-0.178193-1.58380.058616
360.0722170.64190.261404
37-0.132759-1.180.120774
38-0.02258-0.20070.420726
390.1208011.07370.143113
40-0.008534-0.07580.469865
41-0.038386-0.34120.366934
42-0.079943-0.71060.239727
430.0899880.79980.213103
44-0.106673-0.94810.172977
45-0.020411-0.18140.428253
46-0.086815-0.77160.221317
470.0386950.34390.365906
48-0.066024-0.58680.279495

\begin{tabular}{lllllllll}
\hline
Partial Autocorrelation Function \tabularnewline
Time lag k & PACF(k) & T-STAT & P-value \tabularnewline
1 & -0.332431 & -2.9547 & 0.002061 \tabularnewline
2 & -0.487499 & -4.333 & 2.1e-05 \tabularnewline
3 & -0.130223 & -1.1574 & 0.125288 \tabularnewline
4 & -0.076914 & -0.6836 & 0.248106 \tabularnewline
5 & -0.093098 & -0.8275 & 0.205231 \tabularnewline
6 & 0.259747 & 2.3087 & 0.011788 \tabularnewline
7 & -0.157617 & -1.4009 & 0.082575 \tabularnewline
8 & 0.281127 & 2.4987 & 0.00727 \tabularnewline
9 & 0.137842 & 1.2252 & 0.112076 \tabularnewline
10 & -0.237104 & -2.1074 & 0.019126 \tabularnewline
11 & -0.493206 & -4.3837 & 1.8e-05 \tabularnewline
12 & 0.156933 & 1.3949 & 0.083485 \tabularnewline
13 & 0.155882 & 1.3855 & 0.084898 \tabularnewline
14 & 0.141276 & 1.2557 & 0.106464 \tabularnewline
15 & -0.141997 & -1.2621 & 0.105313 \tabularnewline
16 & -0.063544 & -0.5648 & 0.286907 \tabularnewline
17 & -0.077595 & -0.6897 & 0.246208 \tabularnewline
18 & -0.127795 & -1.1359 & 0.129723 \tabularnewline
19 & -0.02858 & -0.254 & 0.400068 \tabularnewline
20 & -0.034611 & -0.3076 & 0.379588 \tabularnewline
21 & 0.045941 & 0.4083 & 0.342067 \tabularnewline
22 & -0.083175 & -0.7393 & 0.230965 \tabularnewline
23 & 0.029809 & 0.265 & 0.395868 \tabularnewline
24 & -0.159549 & -1.4181 & 0.080047 \tabularnewline
25 & 0.11659 & 1.0363 & 0.151619 \tabularnewline
26 & -0.112086 & -0.9962 & 0.161088 \tabularnewline
27 & -0.096929 & -0.8615 & 0.195778 \tabularnewline
28 & 0.097674 & 0.8681 & 0.193972 \tabularnewline
29 & -0.015243 & -0.1355 & 0.446287 \tabularnewline
30 & 0.108418 & 0.9636 & 0.169083 \tabularnewline
31 & 0.041311 & 0.3672 & 0.357234 \tabularnewline
32 & -0.064714 & -0.5752 & 0.283399 \tabularnewline
33 & -0.20333 & -1.8072 & 0.037266 \tabularnewline
34 & 0.07389 & 0.6567 & 0.256625 \tabularnewline
35 & -0.178193 & -1.5838 & 0.058616 \tabularnewline
36 & 0.072217 & 0.6419 & 0.261404 \tabularnewline
37 & -0.132759 & -1.18 & 0.120774 \tabularnewline
38 & -0.02258 & -0.2007 & 0.420726 \tabularnewline
39 & 0.120801 & 1.0737 & 0.143113 \tabularnewline
40 & -0.008534 & -0.0758 & 0.469865 \tabularnewline
41 & -0.038386 & -0.3412 & 0.366934 \tabularnewline
42 & -0.079943 & -0.7106 & 0.239727 \tabularnewline
43 & 0.089988 & 0.7998 & 0.213103 \tabularnewline
44 & -0.106673 & -0.9481 & 0.172977 \tabularnewline
45 & -0.020411 & -0.1814 & 0.428253 \tabularnewline
46 & -0.086815 & -0.7716 & 0.221317 \tabularnewline
47 & 0.038695 & 0.3439 & 0.365906 \tabularnewline
48 & -0.066024 & -0.5868 & 0.279495 \tabularnewline
\hline
\end{tabular}
%Source: https://freestatistics.org/blog/index.php?pk=122160&T=2

[TABLE]
[ROW][C]Partial Autocorrelation Function[/C][/ROW]
[ROW][C]Time lag k[/C][C]PACF(k)[/C][C]T-STAT[/C][C]P-value[/C][/ROW]
[ROW][C]1[/C][C]-0.332431[/C][C]-2.9547[/C][C]0.002061[/C][/ROW]
[ROW][C]2[/C][C]-0.487499[/C][C]-4.333[/C][C]2.1e-05[/C][/ROW]
[ROW][C]3[/C][C]-0.130223[/C][C]-1.1574[/C][C]0.125288[/C][/ROW]
[ROW][C]4[/C][C]-0.076914[/C][C]-0.6836[/C][C]0.248106[/C][/ROW]
[ROW][C]5[/C][C]-0.093098[/C][C]-0.8275[/C][C]0.205231[/C][/ROW]
[ROW][C]6[/C][C]0.259747[/C][C]2.3087[/C][C]0.011788[/C][/ROW]
[ROW][C]7[/C][C]-0.157617[/C][C]-1.4009[/C][C]0.082575[/C][/ROW]
[ROW][C]8[/C][C]0.281127[/C][C]2.4987[/C][C]0.00727[/C][/ROW]
[ROW][C]9[/C][C]0.137842[/C][C]1.2252[/C][C]0.112076[/C][/ROW]
[ROW][C]10[/C][C]-0.237104[/C][C]-2.1074[/C][C]0.019126[/C][/ROW]
[ROW][C]11[/C][C]-0.493206[/C][C]-4.3837[/C][C]1.8e-05[/C][/ROW]
[ROW][C]12[/C][C]0.156933[/C][C]1.3949[/C][C]0.083485[/C][/ROW]
[ROW][C]13[/C][C]0.155882[/C][C]1.3855[/C][C]0.084898[/C][/ROW]
[ROW][C]14[/C][C]0.141276[/C][C]1.2557[/C][C]0.106464[/C][/ROW]
[ROW][C]15[/C][C]-0.141997[/C][C]-1.2621[/C][C]0.105313[/C][/ROW]
[ROW][C]16[/C][C]-0.063544[/C][C]-0.5648[/C][C]0.286907[/C][/ROW]
[ROW][C]17[/C][C]-0.077595[/C][C]-0.6897[/C][C]0.246208[/C][/ROW]
[ROW][C]18[/C][C]-0.127795[/C][C]-1.1359[/C][C]0.129723[/C][/ROW]
[ROW][C]19[/C][C]-0.02858[/C][C]-0.254[/C][C]0.400068[/C][/ROW]
[ROW][C]20[/C][C]-0.034611[/C][C]-0.3076[/C][C]0.379588[/C][/ROW]
[ROW][C]21[/C][C]0.045941[/C][C]0.4083[/C][C]0.342067[/C][/ROW]
[ROW][C]22[/C][C]-0.083175[/C][C]-0.7393[/C][C]0.230965[/C][/ROW]
[ROW][C]23[/C][C]0.029809[/C][C]0.265[/C][C]0.395868[/C][/ROW]
[ROW][C]24[/C][C]-0.159549[/C][C]-1.4181[/C][C]0.080047[/C][/ROW]
[ROW][C]25[/C][C]0.11659[/C][C]1.0363[/C][C]0.151619[/C][/ROW]
[ROW][C]26[/C][C]-0.112086[/C][C]-0.9962[/C][C]0.161088[/C][/ROW]
[ROW][C]27[/C][C]-0.096929[/C][C]-0.8615[/C][C]0.195778[/C][/ROW]
[ROW][C]28[/C][C]0.097674[/C][C]0.8681[/C][C]0.193972[/C][/ROW]
[ROW][C]29[/C][C]-0.015243[/C][C]-0.1355[/C][C]0.446287[/C][/ROW]
[ROW][C]30[/C][C]0.108418[/C][C]0.9636[/C][C]0.169083[/C][/ROW]
[ROW][C]31[/C][C]0.041311[/C][C]0.3672[/C][C]0.357234[/C][/ROW]
[ROW][C]32[/C][C]-0.064714[/C][C]-0.5752[/C][C]0.283399[/C][/ROW]
[ROW][C]33[/C][C]-0.20333[/C][C]-1.8072[/C][C]0.037266[/C][/ROW]
[ROW][C]34[/C][C]0.07389[/C][C]0.6567[/C][C]0.256625[/C][/ROW]
[ROW][C]35[/C][C]-0.178193[/C][C]-1.5838[/C][C]0.058616[/C][/ROW]
[ROW][C]36[/C][C]0.072217[/C][C]0.6419[/C][C]0.261404[/C][/ROW]
[ROW][C]37[/C][C]-0.132759[/C][C]-1.18[/C][C]0.120774[/C][/ROW]
[ROW][C]38[/C][C]-0.02258[/C][C]-0.2007[/C][C]0.420726[/C][/ROW]
[ROW][C]39[/C][C]0.120801[/C][C]1.0737[/C][C]0.143113[/C][/ROW]
[ROW][C]40[/C][C]-0.008534[/C][C]-0.0758[/C][C]0.469865[/C][/ROW]
[ROW][C]41[/C][C]-0.038386[/C][C]-0.3412[/C][C]0.366934[/C][/ROW]
[ROW][C]42[/C][C]-0.079943[/C][C]-0.7106[/C][C]0.239727[/C][/ROW]
[ROW][C]43[/C][C]0.089988[/C][C]0.7998[/C][C]0.213103[/C][/ROW]
[ROW][C]44[/C][C]-0.106673[/C][C]-0.9481[/C][C]0.172977[/C][/ROW]
[ROW][C]45[/C][C]-0.020411[/C][C]-0.1814[/C][C]0.428253[/C][/ROW]
[ROW][C]46[/C][C]-0.086815[/C][C]-0.7716[/C][C]0.221317[/C][/ROW]
[ROW][C]47[/C][C]0.038695[/C][C]0.3439[/C][C]0.365906[/C][/ROW]
[ROW][C]48[/C][C]-0.066024[/C][C]-0.5868[/C][C]0.279495[/C][/ROW]
[/TABLE]
Source: https://freestatistics.org/blog/index.php?pk=122160&T=2

Globally Unique Identifier (entire table): ba.freestatistics.org/blog/index.php?pk=122160&T=2

As an alternative you can also use a QR Code:  

The GUIDs for individual cells are displayed in the table below:

Partial Autocorrelation Function
Time lag kPACF(k)T-STATP-value
1-0.332431-2.95470.002061
2-0.487499-4.3332.1e-05
3-0.130223-1.15740.125288
4-0.076914-0.68360.248106
5-0.093098-0.82750.205231
60.2597472.30870.011788
7-0.157617-1.40090.082575
80.2811272.49870.00727
90.1378421.22520.112076
10-0.237104-2.10740.019126
11-0.493206-4.38371.8e-05
120.1569331.39490.083485
130.1558821.38550.084898
140.1412761.25570.106464
15-0.141997-1.26210.105313
16-0.063544-0.56480.286907
17-0.077595-0.68970.246208
18-0.127795-1.13590.129723
19-0.02858-0.2540.400068
20-0.034611-0.30760.379588
210.0459410.40830.342067
22-0.083175-0.73930.230965
230.0298090.2650.395868
24-0.159549-1.41810.080047
250.116591.03630.151619
26-0.112086-0.99620.161088
27-0.096929-0.86150.195778
280.0976740.86810.193972
29-0.015243-0.13550.446287
300.1084180.96360.169083
310.0413110.36720.357234
32-0.064714-0.57520.283399
33-0.20333-1.80720.037266
340.073890.65670.256625
35-0.178193-1.58380.058616
360.0722170.64190.261404
37-0.132759-1.180.120774
38-0.02258-0.20070.420726
390.1208011.07370.143113
40-0.008534-0.07580.469865
41-0.038386-0.34120.366934
42-0.079943-0.71060.239727
430.0899880.79980.213103
44-0.106673-0.94810.172977
45-0.020411-0.18140.428253
46-0.086815-0.77160.221317
470.0386950.34390.365906
48-0.066024-0.58680.279495


Parameters (Session):
par1 = 48 ; par2 = 1 ; par3 = 1 ; par4 = 0 ; par5 = 12 ; par6 = White Noise ; par7 = 0.95 ;
Parameters (R input):
par1 = 48 ; par2 = 1 ; par3 = 1 ; par4 = 0 ; par5 = 12 ; par6 = White Noise ; par7 = 0.95 ; par8 = ;
R code (references can be found in the software module):
if (par1 == 'Default') {
par1 = 10*log10(length(x))
} else {
par1 <- as.numeric(par1)
}
par2 <- as.numeric(par2)
par3 <- as.numeric(par3)
par4 <- as.numeric(par4)
par5 <- as.numeric(par5)
if (par6 == 'White Noise') par6 <- 'white' else par6 <- 'ma'
par7 <- as.numeric(par7)
if (par8 != '') par8 <- as.numeric(par8)
ox <- x
if (par8 == '') {
if (par2 == 0) {
x <- log(x)
} else {
x <- (x ^ par2 - 1) / par2
}
} else {
x <- log(x,base=par8)
}
if (par3 > 0) x <- diff(x,lag=1,difference=par3)
if (par4 > 0) x <- diff(x,lag=par5,difference=par4)
bitmap(file='picts.png')
op <- par(mfrow=c(2,1))
plot(ox,type='l',main='Original Time Series',xlab='time',ylab='value')
if (par8=='') {
mytitle <- paste('Working Time Series (lambda=',par2,', d=',par3,', D=',par4,')',sep='')
mysub <- paste('(lambda=',par2,', d=',par3,', D=',par4,', CI=', par7, ', CI type=',par6,')',sep='')
} else {
mytitle <- paste('Working Time Series (base=',par8,', d=',par3,', D=',par4,')',sep='')
mysub <- paste('(base=',par8,', d=',par3,', D=',par4,', CI=', par7, ', CI type=',par6,')',sep='')
}
plot(x,type='l', main=mytitle,xlab='time',ylab='value')
par(op)
dev.off()
bitmap(file='pic1.png')
racf <- acf(x, par1, main='Autocorrelation', xlab='time lag', ylab='ACF', ci.type=par6, ci=par7, sub=mysub)
dev.off()
bitmap(file='pic2.png')
rpacf <- pacf(x,par1,main='Partial Autocorrelation',xlab='lags',ylab='PACF',sub=mysub)
dev.off()
(myacf <- c(racf$acf))
(mypacf <- c(rpacf$acf))
lengthx <- length(x)
sqrtn <- sqrt(lengthx)
load(file='createtable')
a<-table.start()
a<-table.row.start(a)
a<-table.element(a,'Autocorrelation Function',4,TRUE)
a<-table.row.end(a)
a<-table.row.start(a)
a<-table.element(a,'Time lag k',header=TRUE)
a<-table.element(a,hyperlink('basics.htm','ACF(k)','click here for more information about the Autocorrelation Function'),header=TRUE)
a<-table.element(a,'T-STAT',header=TRUE)
a<-table.element(a,'P-value',header=TRUE)
a<-table.row.end(a)
for (i in 2:(par1+1)) {
a<-table.row.start(a)
a<-table.element(a,i-1,header=TRUE)
a<-table.element(a,round(myacf[i],6))
mytstat <- myacf[i]*sqrtn
a<-table.element(a,round(mytstat,4))
a<-table.element(a,round(1-pt(abs(mytstat),lengthx),6))
a<-table.row.end(a)
}
a<-table.end(a)
table.save(a,file='mytable.tab')
a<-table.start()
a<-table.row.start(a)
a<-table.element(a,'Partial Autocorrelation Function',4,TRUE)
a<-table.row.end(a)
a<-table.row.start(a)
a<-table.element(a,'Time lag k',header=TRUE)
a<-table.element(a,hyperlink('basics.htm','PACF(k)','click here for more information about the Partial Autocorrelation Function'),header=TRUE)
a<-table.element(a,'T-STAT',header=TRUE)
a<-table.element(a,'P-value',header=TRUE)
a<-table.row.end(a)
for (i in 1:par1) {
a<-table.row.start(a)
a<-table.element(a,i,header=TRUE)
a<-table.element(a,round(mypacf[i],6))
mytstat <- mypacf[i]*sqrtn
a<-table.element(a,round(mytstat,4))
a<-table.element(a,round(1-pt(abs(mytstat),lengthx),6))
a<-table.row.end(a)
}
a<-table.end(a)
table.save(a,file='mytable1.tab')