Free Statistics

of Irreproducible Research!

Author's title

Author*Unverified author*
R Software Modulerwasp_autocorrelation.wasp
Title produced by software(Partial) Autocorrelation Function
Date of computationThu, 19 May 2011 17:40:53 +0000
Cite this page as followsStatistical Computations at FreeStatistics.org, Office for Research Development and Education, URL https://freestatistics.org/blog/index.php?v=date/2011/May/19/t1305826627okvupvpvja5p6at.htm/, Retrieved Sat, 11 May 2024 07:20:09 +0000
Statistical Computations at FreeStatistics.org, Office for Research Development and Education, URL https://freestatistics.org/blog/index.php?pk=122157, Retrieved Sat, 11 May 2024 07:20:09 +0000
QR Codes:

Original text written by user:
IsPrivate?No (this computation is public)
User-defined keywordsKDGP2W12
Estimated Impact78
Family? (F = Feedback message, R = changed R code, M = changed R Module, P = changed Parameters, D = changed Data)
-       [(Partial) Autocorrelation Function] [] [2011-05-19 17:40:53] [31b126aa1b32aa85c8fd6bf40153b92b] [Current]
Feedback Forum

Post a new message
Dataseries X:
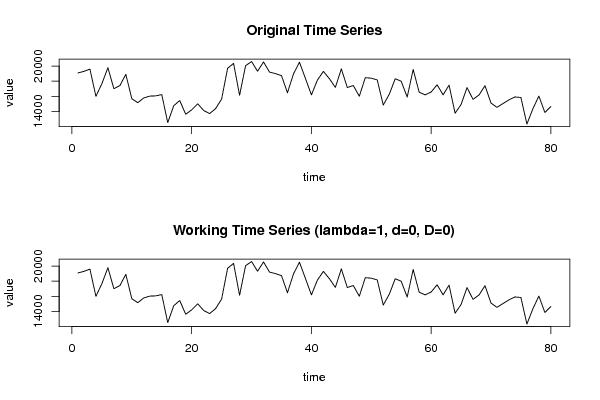
19097,1
19304,6
19601,7
16006,9
17681,2
19790,4
17014,2
17424,5
18908,9
15692,1
15160
15794,3
16032,1
16065
16236,8
12521
14762,1
15446,9
13635
14212,6
15021,7
14134,3
13721,4
14384,5
15638,6
19711,6
20359,8
16141,4
20056,9
20605,5
19325,8
20547,7
19211,2
19009,5
18746,8
16471,5
18957,2
20515,2
18374,4
16192,9
18147,5
19301,4
18344,7
17183,6
19630
17167,2
17428,5
16016,5
18466,5
18406,6
18174,1
14851,9
16260,7
18329,6
18003,8
15903,8
19554,2
16554,2
16198,9
16571,8
17535,2
16198,1
17487,5
13768
14915,8
17160,9
15607,4
16181,5
17413,2
15116,3
14544,5
15050,6
15535,4
15919,3
15853,1
12336,4
14355,5
16040,8
13867,7
14656,6


Summary of computational transaction
Raw Inputview raw input (R code)
Raw Outputview raw output of R engine
Computing time2 seconds
R Server'George Udny Yule' @ 216.218.223.82

\begin{tabular}{lllllllll}
\hline
Summary of computational transaction \tabularnewline
Raw Input & view raw input (R code)  \tabularnewline
Raw Output & view raw output of R engine  \tabularnewline
Computing time & 2 seconds \tabularnewline
R Server & 'George Udny Yule' @ 216.218.223.82 \tabularnewline
\hline
\end{tabular}
%Source: https://freestatistics.org/blog/index.php?pk=122157&T=0

[TABLE]
[ROW][C]Summary of computational transaction[/C][/ROW]
[ROW][C]Raw Input[/C][C]view raw input (R code) [/C][/ROW]
[ROW][C]Raw Output[/C][C]view raw output of R engine [/C][/ROW]
[ROW][C]Computing time[/C][C]2 seconds[/C][/ROW]
[ROW][C]R Server[/C][C]'George Udny Yule' @ 216.218.223.82[/C][/ROW]
[/TABLE]
Source: https://freestatistics.org/blog/index.php?pk=122157&T=0

Globally Unique Identifier (entire table): ba.freestatistics.org/blog/index.php?pk=122157&T=0

As an alternative you can also use a QR Code:  

The GUIDs for individual cells are displayed in the table below:

Summary of computational transaction
Raw Inputview raw input (R code)
Raw Outputview raw output of R engine
Computing time2 seconds
R Server'George Udny Yule' @ 216.218.223.82


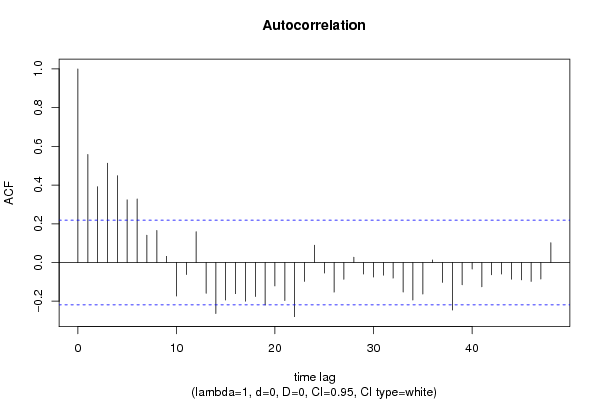
Autocorrelation Function
Time lag kACF(k)T-STATP-value
10.5578074.98922e-06
20.3916193.50270.000378
30.5130664.5898e-06
40.4484464.0116.8e-05
50.3235692.89410.002449
60.3279322.93310.002188
70.1407071.25850.105932
80.1658151.48310.070989
90.0317850.28430.388461
10-0.173403-1.5510.062429
11-0.061935-0.5540.290574
120.1589441.42160.079509
13-0.159304-1.42490.079043
14-0.263422-2.35610.010457
15-0.193638-1.7320.043568
16-0.160828-1.43850.077099
17-0.199555-1.78490.039036
18-0.176029-1.57440.059665
19-0.219863-1.96650.026354
20-0.121014-1.08240.141167
21-0.196032-1.75340.041685
22-0.279781-2.50240.007186
23-0.097417-0.87130.193093
240.0889930.7960.2142
25-0.054214-0.48490.314535
26-0.152946-1.3680.087573
27-0.086746-0.77590.220055
280.0272510.24370.404027
29-0.059636-0.53340.297616
30-0.074651-0.66770.253124
31-0.065376-0.58470.280185
32-0.080601-0.72090.236532
33-0.152348-1.36260.088409
34-0.193914-1.73440.043347
35-0.162469-1.45320.075044
360.0130030.11630.453851
37-0.102812-0.91960.180278
38-0.245203-2.19320.0156
39-0.114614-1.02510.154194
40-0.033441-0.29910.382816
41-0.125009-1.11810.133432
42-0.06299-0.56340.28737
43-0.059248-0.52990.298814
44-0.08597-0.76890.222097
45-0.08963-0.80170.212557
46-0.097505-0.87210.19288
47-0.085513-0.76490.223305
480.1017570.91010.182741

\begin{tabular}{lllllllll}
\hline
Autocorrelation Function \tabularnewline
Time lag k & ACF(k) & T-STAT & P-value \tabularnewline
1 & 0.557807 & 4.9892 & 2e-06 \tabularnewline
2 & 0.391619 & 3.5027 & 0.000378 \tabularnewline
3 & 0.513066 & 4.589 & 8e-06 \tabularnewline
4 & 0.448446 & 4.011 & 6.8e-05 \tabularnewline
5 & 0.323569 & 2.8941 & 0.002449 \tabularnewline
6 & 0.327932 & 2.9331 & 0.002188 \tabularnewline
7 & 0.140707 & 1.2585 & 0.105932 \tabularnewline
8 & 0.165815 & 1.4831 & 0.070989 \tabularnewline
9 & 0.031785 & 0.2843 & 0.388461 \tabularnewline
10 & -0.173403 & -1.551 & 0.062429 \tabularnewline
11 & -0.061935 & -0.554 & 0.290574 \tabularnewline
12 & 0.158944 & 1.4216 & 0.079509 \tabularnewline
13 & -0.159304 & -1.4249 & 0.079043 \tabularnewline
14 & -0.263422 & -2.3561 & 0.010457 \tabularnewline
15 & -0.193638 & -1.732 & 0.043568 \tabularnewline
16 & -0.160828 & -1.4385 & 0.077099 \tabularnewline
17 & -0.199555 & -1.7849 & 0.039036 \tabularnewline
18 & -0.176029 & -1.5744 & 0.059665 \tabularnewline
19 & -0.219863 & -1.9665 & 0.026354 \tabularnewline
20 & -0.121014 & -1.0824 & 0.141167 \tabularnewline
21 & -0.196032 & -1.7534 & 0.041685 \tabularnewline
22 & -0.279781 & -2.5024 & 0.007186 \tabularnewline
23 & -0.097417 & -0.8713 & 0.193093 \tabularnewline
24 & 0.088993 & 0.796 & 0.2142 \tabularnewline
25 & -0.054214 & -0.4849 & 0.314535 \tabularnewline
26 & -0.152946 & -1.368 & 0.087573 \tabularnewline
27 & -0.086746 & -0.7759 & 0.220055 \tabularnewline
28 & 0.027251 & 0.2437 & 0.404027 \tabularnewline
29 & -0.059636 & -0.5334 & 0.297616 \tabularnewline
30 & -0.074651 & -0.6677 & 0.253124 \tabularnewline
31 & -0.065376 & -0.5847 & 0.280185 \tabularnewline
32 & -0.080601 & -0.7209 & 0.236532 \tabularnewline
33 & -0.152348 & -1.3626 & 0.088409 \tabularnewline
34 & -0.193914 & -1.7344 & 0.043347 \tabularnewline
35 & -0.162469 & -1.4532 & 0.075044 \tabularnewline
36 & 0.013003 & 0.1163 & 0.453851 \tabularnewline
37 & -0.102812 & -0.9196 & 0.180278 \tabularnewline
38 & -0.245203 & -2.1932 & 0.0156 \tabularnewline
39 & -0.114614 & -1.0251 & 0.154194 \tabularnewline
40 & -0.033441 & -0.2991 & 0.382816 \tabularnewline
41 & -0.125009 & -1.1181 & 0.133432 \tabularnewline
42 & -0.06299 & -0.5634 & 0.28737 \tabularnewline
43 & -0.059248 & -0.5299 & 0.298814 \tabularnewline
44 & -0.08597 & -0.7689 & 0.222097 \tabularnewline
45 & -0.08963 & -0.8017 & 0.212557 \tabularnewline
46 & -0.097505 & -0.8721 & 0.19288 \tabularnewline
47 & -0.085513 & -0.7649 & 0.223305 \tabularnewline
48 & 0.101757 & 0.9101 & 0.182741 \tabularnewline
\hline
\end{tabular}
%Source: https://freestatistics.org/blog/index.php?pk=122157&T=1

[TABLE]
[ROW][C]Autocorrelation Function[/C][/ROW]
[ROW][C]Time lag k[/C][C]ACF(k)[/C][C]T-STAT[/C][C]P-value[/C][/ROW]
[ROW][C]1[/C][C]0.557807[/C][C]4.9892[/C][C]2e-06[/C][/ROW]
[ROW][C]2[/C][C]0.391619[/C][C]3.5027[/C][C]0.000378[/C][/ROW]
[ROW][C]3[/C][C]0.513066[/C][C]4.589[/C][C]8e-06[/C][/ROW]
[ROW][C]4[/C][C]0.448446[/C][C]4.011[/C][C]6.8e-05[/C][/ROW]
[ROW][C]5[/C][C]0.323569[/C][C]2.8941[/C][C]0.002449[/C][/ROW]
[ROW][C]6[/C][C]0.327932[/C][C]2.9331[/C][C]0.002188[/C][/ROW]
[ROW][C]7[/C][C]0.140707[/C][C]1.2585[/C][C]0.105932[/C][/ROW]
[ROW][C]8[/C][C]0.165815[/C][C]1.4831[/C][C]0.070989[/C][/ROW]
[ROW][C]9[/C][C]0.031785[/C][C]0.2843[/C][C]0.388461[/C][/ROW]
[ROW][C]10[/C][C]-0.173403[/C][C]-1.551[/C][C]0.062429[/C][/ROW]
[ROW][C]11[/C][C]-0.061935[/C][C]-0.554[/C][C]0.290574[/C][/ROW]
[ROW][C]12[/C][C]0.158944[/C][C]1.4216[/C][C]0.079509[/C][/ROW]
[ROW][C]13[/C][C]-0.159304[/C][C]-1.4249[/C][C]0.079043[/C][/ROW]
[ROW][C]14[/C][C]-0.263422[/C][C]-2.3561[/C][C]0.010457[/C][/ROW]
[ROW][C]15[/C][C]-0.193638[/C][C]-1.732[/C][C]0.043568[/C][/ROW]
[ROW][C]16[/C][C]-0.160828[/C][C]-1.4385[/C][C]0.077099[/C][/ROW]
[ROW][C]17[/C][C]-0.199555[/C][C]-1.7849[/C][C]0.039036[/C][/ROW]
[ROW][C]18[/C][C]-0.176029[/C][C]-1.5744[/C][C]0.059665[/C][/ROW]
[ROW][C]19[/C][C]-0.219863[/C][C]-1.9665[/C][C]0.026354[/C][/ROW]
[ROW][C]20[/C][C]-0.121014[/C][C]-1.0824[/C][C]0.141167[/C][/ROW]
[ROW][C]21[/C][C]-0.196032[/C][C]-1.7534[/C][C]0.041685[/C][/ROW]
[ROW][C]22[/C][C]-0.279781[/C][C]-2.5024[/C][C]0.007186[/C][/ROW]
[ROW][C]23[/C][C]-0.097417[/C][C]-0.8713[/C][C]0.193093[/C][/ROW]
[ROW][C]24[/C][C]0.088993[/C][C]0.796[/C][C]0.2142[/C][/ROW]
[ROW][C]25[/C][C]-0.054214[/C][C]-0.4849[/C][C]0.314535[/C][/ROW]
[ROW][C]26[/C][C]-0.152946[/C][C]-1.368[/C][C]0.087573[/C][/ROW]
[ROW][C]27[/C][C]-0.086746[/C][C]-0.7759[/C][C]0.220055[/C][/ROW]
[ROW][C]28[/C][C]0.027251[/C][C]0.2437[/C][C]0.404027[/C][/ROW]
[ROW][C]29[/C][C]-0.059636[/C][C]-0.5334[/C][C]0.297616[/C][/ROW]
[ROW][C]30[/C][C]-0.074651[/C][C]-0.6677[/C][C]0.253124[/C][/ROW]
[ROW][C]31[/C][C]-0.065376[/C][C]-0.5847[/C][C]0.280185[/C][/ROW]
[ROW][C]32[/C][C]-0.080601[/C][C]-0.7209[/C][C]0.236532[/C][/ROW]
[ROW][C]33[/C][C]-0.152348[/C][C]-1.3626[/C][C]0.088409[/C][/ROW]
[ROW][C]34[/C][C]-0.193914[/C][C]-1.7344[/C][C]0.043347[/C][/ROW]
[ROW][C]35[/C][C]-0.162469[/C][C]-1.4532[/C][C]0.075044[/C][/ROW]
[ROW][C]36[/C][C]0.013003[/C][C]0.1163[/C][C]0.453851[/C][/ROW]
[ROW][C]37[/C][C]-0.102812[/C][C]-0.9196[/C][C]0.180278[/C][/ROW]
[ROW][C]38[/C][C]-0.245203[/C][C]-2.1932[/C][C]0.0156[/C][/ROW]
[ROW][C]39[/C][C]-0.114614[/C][C]-1.0251[/C][C]0.154194[/C][/ROW]
[ROW][C]40[/C][C]-0.033441[/C][C]-0.2991[/C][C]0.382816[/C][/ROW]
[ROW][C]41[/C][C]-0.125009[/C][C]-1.1181[/C][C]0.133432[/C][/ROW]
[ROW][C]42[/C][C]-0.06299[/C][C]-0.5634[/C][C]0.28737[/C][/ROW]
[ROW][C]43[/C][C]-0.059248[/C][C]-0.5299[/C][C]0.298814[/C][/ROW]
[ROW][C]44[/C][C]-0.08597[/C][C]-0.7689[/C][C]0.222097[/C][/ROW]
[ROW][C]45[/C][C]-0.08963[/C][C]-0.8017[/C][C]0.212557[/C][/ROW]
[ROW][C]46[/C][C]-0.097505[/C][C]-0.8721[/C][C]0.19288[/C][/ROW]
[ROW][C]47[/C][C]-0.085513[/C][C]-0.7649[/C][C]0.223305[/C][/ROW]
[ROW][C]48[/C][C]0.101757[/C][C]0.9101[/C][C]0.182741[/C][/ROW]
[/TABLE]
Source: https://freestatistics.org/blog/index.php?pk=122157&T=1

Globally Unique Identifier (entire table): ba.freestatistics.org/blog/index.php?pk=122157&T=1

As an alternative you can also use a QR Code:  

The GUIDs for individual cells are displayed in the table below:

Autocorrelation Function
Time lag kACF(k)T-STATP-value
10.5578074.98922e-06
20.3916193.50270.000378
30.5130664.5898e-06
40.4484464.0116.8e-05
50.3235692.89410.002449
60.3279322.93310.002188
70.1407071.25850.105932
80.1658151.48310.070989
90.0317850.28430.388461
10-0.173403-1.5510.062429
11-0.061935-0.5540.290574
120.1589441.42160.079509
13-0.159304-1.42490.079043
14-0.263422-2.35610.010457
15-0.193638-1.7320.043568
16-0.160828-1.43850.077099
17-0.199555-1.78490.039036
18-0.176029-1.57440.059665
19-0.219863-1.96650.026354
20-0.121014-1.08240.141167
21-0.196032-1.75340.041685
22-0.279781-2.50240.007186
23-0.097417-0.87130.193093
240.0889930.7960.2142
25-0.054214-0.48490.314535
26-0.152946-1.3680.087573
27-0.086746-0.77590.220055
280.0272510.24370.404027
29-0.059636-0.53340.297616
30-0.074651-0.66770.253124
31-0.065376-0.58470.280185
32-0.080601-0.72090.236532
33-0.152348-1.36260.088409
34-0.193914-1.73440.043347
35-0.162469-1.45320.075044
360.0130030.11630.453851
37-0.102812-0.91960.180278
38-0.245203-2.19320.0156
39-0.114614-1.02510.154194
40-0.033441-0.29910.382816
41-0.125009-1.11810.133432
42-0.06299-0.56340.28737
43-0.059248-0.52990.298814
44-0.08597-0.76890.222097
45-0.08963-0.80170.212557
46-0.097505-0.87210.19288
47-0.085513-0.76490.223305
480.1017570.91010.182741


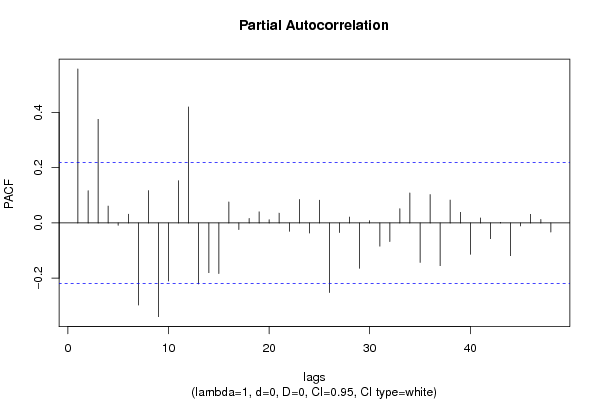
Partial Autocorrelation Function
Time lag kPACF(k)T-STATP-value
10.5578074.98922e-06
20.1168181.04490.149619
30.3752663.35650.000605
40.060820.5440.293982
5-0.008366-0.07480.47027
60.0317850.28430.388459
7-0.297541-2.66130.004702
80.1171991.04830.148838
9-0.339505-3.03660.001614
10-0.210615-1.88380.031613
110.1530271.36870.08746
120.4201423.75790.000162
13-0.220906-1.97580.02581
14-0.180099-1.61090.055575
15-0.182993-1.63670.052807
160.0756640.67680.250256
17-0.023962-0.21430.41542
180.0159740.14290.443375
190.0400280.3580.360635
200.0114190.10210.459452
210.0354330.31690.376064
22-0.030299-0.2710.393543
230.0851650.76170.224228
24-0.036574-0.32710.372214
250.0822160.73540.232134
26-0.251898-2.2530.013497
27-0.034395-0.30760.37958
280.0211950.18960.425061
29-0.164113-1.46790.07303
300.0078380.07010.472144
31-0.084172-0.75290.226874
32-0.067476-0.60350.273935
330.0511660.45760.324223
340.1083030.96870.167809
35-0.142834-1.27750.102552
360.1025830.91750.180811
37-0.154608-1.38290.085279
380.0825950.73880.231109
390.0382890.34250.366449
40-0.11329-1.01330.156987
410.0179990.1610.436253
42-0.057026-0.51010.305708
430.0019910.01780.492919
44-0.118396-1.0590.146401
45-0.010753-0.09620.461811
460.0310420.27760.391
470.0126490.11310.455104
48-0.032862-0.29390.384786

\begin{tabular}{lllllllll}
\hline
Partial Autocorrelation Function \tabularnewline
Time lag k & PACF(k) & T-STAT & P-value \tabularnewline
1 & 0.557807 & 4.9892 & 2e-06 \tabularnewline
2 & 0.116818 & 1.0449 & 0.149619 \tabularnewline
3 & 0.375266 & 3.3565 & 0.000605 \tabularnewline
4 & 0.06082 & 0.544 & 0.293982 \tabularnewline
5 & -0.008366 & -0.0748 & 0.47027 \tabularnewline
6 & 0.031785 & 0.2843 & 0.388459 \tabularnewline
7 & -0.297541 & -2.6613 & 0.004702 \tabularnewline
8 & 0.117199 & 1.0483 & 0.148838 \tabularnewline
9 & -0.339505 & -3.0366 & 0.001614 \tabularnewline
10 & -0.210615 & -1.8838 & 0.031613 \tabularnewline
11 & 0.153027 & 1.3687 & 0.08746 \tabularnewline
12 & 0.420142 & 3.7579 & 0.000162 \tabularnewline
13 & -0.220906 & -1.9758 & 0.02581 \tabularnewline
14 & -0.180099 & -1.6109 & 0.055575 \tabularnewline
15 & -0.182993 & -1.6367 & 0.052807 \tabularnewline
16 & 0.075664 & 0.6768 & 0.250256 \tabularnewline
17 & -0.023962 & -0.2143 & 0.41542 \tabularnewline
18 & 0.015974 & 0.1429 & 0.443375 \tabularnewline
19 & 0.040028 & 0.358 & 0.360635 \tabularnewline
20 & 0.011419 & 0.1021 & 0.459452 \tabularnewline
21 & 0.035433 & 0.3169 & 0.376064 \tabularnewline
22 & -0.030299 & -0.271 & 0.393543 \tabularnewline
23 & 0.085165 & 0.7617 & 0.224228 \tabularnewline
24 & -0.036574 & -0.3271 & 0.372214 \tabularnewline
25 & 0.082216 & 0.7354 & 0.232134 \tabularnewline
26 & -0.251898 & -2.253 & 0.013497 \tabularnewline
27 & -0.034395 & -0.3076 & 0.37958 \tabularnewline
28 & 0.021195 & 0.1896 & 0.425061 \tabularnewline
29 & -0.164113 & -1.4679 & 0.07303 \tabularnewline
30 & 0.007838 & 0.0701 & 0.472144 \tabularnewline
31 & -0.084172 & -0.7529 & 0.226874 \tabularnewline
32 & -0.067476 & -0.6035 & 0.273935 \tabularnewline
33 & 0.051166 & 0.4576 & 0.324223 \tabularnewline
34 & 0.108303 & 0.9687 & 0.167809 \tabularnewline
35 & -0.142834 & -1.2775 & 0.102552 \tabularnewline
36 & 0.102583 & 0.9175 & 0.180811 \tabularnewline
37 & -0.154608 & -1.3829 & 0.085279 \tabularnewline
38 & 0.082595 & 0.7388 & 0.231109 \tabularnewline
39 & 0.038289 & 0.3425 & 0.366449 \tabularnewline
40 & -0.11329 & -1.0133 & 0.156987 \tabularnewline
41 & 0.017999 & 0.161 & 0.436253 \tabularnewline
42 & -0.057026 & -0.5101 & 0.305708 \tabularnewline
43 & 0.001991 & 0.0178 & 0.492919 \tabularnewline
44 & -0.118396 & -1.059 & 0.146401 \tabularnewline
45 & -0.010753 & -0.0962 & 0.461811 \tabularnewline
46 & 0.031042 & 0.2776 & 0.391 \tabularnewline
47 & 0.012649 & 0.1131 & 0.455104 \tabularnewline
48 & -0.032862 & -0.2939 & 0.384786 \tabularnewline
\hline
\end{tabular}
%Source: https://freestatistics.org/blog/index.php?pk=122157&T=2

[TABLE]
[ROW][C]Partial Autocorrelation Function[/C][/ROW]
[ROW][C]Time lag k[/C][C]PACF(k)[/C][C]T-STAT[/C][C]P-value[/C][/ROW]
[ROW][C]1[/C][C]0.557807[/C][C]4.9892[/C][C]2e-06[/C][/ROW]
[ROW][C]2[/C][C]0.116818[/C][C]1.0449[/C][C]0.149619[/C][/ROW]
[ROW][C]3[/C][C]0.375266[/C][C]3.3565[/C][C]0.000605[/C][/ROW]
[ROW][C]4[/C][C]0.06082[/C][C]0.544[/C][C]0.293982[/C][/ROW]
[ROW][C]5[/C][C]-0.008366[/C][C]-0.0748[/C][C]0.47027[/C][/ROW]
[ROW][C]6[/C][C]0.031785[/C][C]0.2843[/C][C]0.388459[/C][/ROW]
[ROW][C]7[/C][C]-0.297541[/C][C]-2.6613[/C][C]0.004702[/C][/ROW]
[ROW][C]8[/C][C]0.117199[/C][C]1.0483[/C][C]0.148838[/C][/ROW]
[ROW][C]9[/C][C]-0.339505[/C][C]-3.0366[/C][C]0.001614[/C][/ROW]
[ROW][C]10[/C][C]-0.210615[/C][C]-1.8838[/C][C]0.031613[/C][/ROW]
[ROW][C]11[/C][C]0.153027[/C][C]1.3687[/C][C]0.08746[/C][/ROW]
[ROW][C]12[/C][C]0.420142[/C][C]3.7579[/C][C]0.000162[/C][/ROW]
[ROW][C]13[/C][C]-0.220906[/C][C]-1.9758[/C][C]0.02581[/C][/ROW]
[ROW][C]14[/C][C]-0.180099[/C][C]-1.6109[/C][C]0.055575[/C][/ROW]
[ROW][C]15[/C][C]-0.182993[/C][C]-1.6367[/C][C]0.052807[/C][/ROW]
[ROW][C]16[/C][C]0.075664[/C][C]0.6768[/C][C]0.250256[/C][/ROW]
[ROW][C]17[/C][C]-0.023962[/C][C]-0.2143[/C][C]0.41542[/C][/ROW]
[ROW][C]18[/C][C]0.015974[/C][C]0.1429[/C][C]0.443375[/C][/ROW]
[ROW][C]19[/C][C]0.040028[/C][C]0.358[/C][C]0.360635[/C][/ROW]
[ROW][C]20[/C][C]0.011419[/C][C]0.1021[/C][C]0.459452[/C][/ROW]
[ROW][C]21[/C][C]0.035433[/C][C]0.3169[/C][C]0.376064[/C][/ROW]
[ROW][C]22[/C][C]-0.030299[/C][C]-0.271[/C][C]0.393543[/C][/ROW]
[ROW][C]23[/C][C]0.085165[/C][C]0.7617[/C][C]0.224228[/C][/ROW]
[ROW][C]24[/C][C]-0.036574[/C][C]-0.3271[/C][C]0.372214[/C][/ROW]
[ROW][C]25[/C][C]0.082216[/C][C]0.7354[/C][C]0.232134[/C][/ROW]
[ROW][C]26[/C][C]-0.251898[/C][C]-2.253[/C][C]0.013497[/C][/ROW]
[ROW][C]27[/C][C]-0.034395[/C][C]-0.3076[/C][C]0.37958[/C][/ROW]
[ROW][C]28[/C][C]0.021195[/C][C]0.1896[/C][C]0.425061[/C][/ROW]
[ROW][C]29[/C][C]-0.164113[/C][C]-1.4679[/C][C]0.07303[/C][/ROW]
[ROW][C]30[/C][C]0.007838[/C][C]0.0701[/C][C]0.472144[/C][/ROW]
[ROW][C]31[/C][C]-0.084172[/C][C]-0.7529[/C][C]0.226874[/C][/ROW]
[ROW][C]32[/C][C]-0.067476[/C][C]-0.6035[/C][C]0.273935[/C][/ROW]
[ROW][C]33[/C][C]0.051166[/C][C]0.4576[/C][C]0.324223[/C][/ROW]
[ROW][C]34[/C][C]0.108303[/C][C]0.9687[/C][C]0.167809[/C][/ROW]
[ROW][C]35[/C][C]-0.142834[/C][C]-1.2775[/C][C]0.102552[/C][/ROW]
[ROW][C]36[/C][C]0.102583[/C][C]0.9175[/C][C]0.180811[/C][/ROW]
[ROW][C]37[/C][C]-0.154608[/C][C]-1.3829[/C][C]0.085279[/C][/ROW]
[ROW][C]38[/C][C]0.082595[/C][C]0.7388[/C][C]0.231109[/C][/ROW]
[ROW][C]39[/C][C]0.038289[/C][C]0.3425[/C][C]0.366449[/C][/ROW]
[ROW][C]40[/C][C]-0.11329[/C][C]-1.0133[/C][C]0.156987[/C][/ROW]
[ROW][C]41[/C][C]0.017999[/C][C]0.161[/C][C]0.436253[/C][/ROW]
[ROW][C]42[/C][C]-0.057026[/C][C]-0.5101[/C][C]0.305708[/C][/ROW]
[ROW][C]43[/C][C]0.001991[/C][C]0.0178[/C][C]0.492919[/C][/ROW]
[ROW][C]44[/C][C]-0.118396[/C][C]-1.059[/C][C]0.146401[/C][/ROW]
[ROW][C]45[/C][C]-0.010753[/C][C]-0.0962[/C][C]0.461811[/C][/ROW]
[ROW][C]46[/C][C]0.031042[/C][C]0.2776[/C][C]0.391[/C][/ROW]
[ROW][C]47[/C][C]0.012649[/C][C]0.1131[/C][C]0.455104[/C][/ROW]
[ROW][C]48[/C][C]-0.032862[/C][C]-0.2939[/C][C]0.384786[/C][/ROW]
[/TABLE]
Source: https://freestatistics.org/blog/index.php?pk=122157&T=2

Globally Unique Identifier (entire table): ba.freestatistics.org/blog/index.php?pk=122157&T=2

As an alternative you can also use a QR Code:  

The GUIDs for individual cells are displayed in the table below:

Partial Autocorrelation Function
Time lag kPACF(k)T-STATP-value
10.5578074.98922e-06
20.1168181.04490.149619
30.3752663.35650.000605
40.060820.5440.293982
5-0.008366-0.07480.47027
60.0317850.28430.388459
7-0.297541-2.66130.004702
80.1171991.04830.148838
9-0.339505-3.03660.001614
10-0.210615-1.88380.031613
110.1530271.36870.08746
120.4201423.75790.000162
13-0.220906-1.97580.02581
14-0.180099-1.61090.055575
15-0.182993-1.63670.052807
160.0756640.67680.250256
17-0.023962-0.21430.41542
180.0159740.14290.443375
190.0400280.3580.360635
200.0114190.10210.459452
210.0354330.31690.376064
22-0.030299-0.2710.393543
230.0851650.76170.224228
24-0.036574-0.32710.372214
250.0822160.73540.232134
26-0.251898-2.2530.013497
27-0.034395-0.30760.37958
280.0211950.18960.425061
29-0.164113-1.46790.07303
300.0078380.07010.472144
31-0.084172-0.75290.226874
32-0.067476-0.60350.273935
330.0511660.45760.324223
340.1083030.96870.167809
35-0.142834-1.27750.102552
360.1025830.91750.180811
37-0.154608-1.38290.085279
380.0825950.73880.231109
390.0382890.34250.366449
40-0.11329-1.01330.156987
410.0179990.1610.436253
42-0.057026-0.51010.305708
430.0019910.01780.492919
44-0.118396-1.0590.146401
45-0.010753-0.09620.461811
460.0310420.27760.391
470.0126490.11310.455104
48-0.032862-0.29390.384786


Parameters (Session):
par1 = 48 ; par2 = 1 ; par3 = 0 ; par4 = 0 ; par5 = 12 ; par6 = White Noise ; par7 = 0.95 ;
Parameters (R input):
par1 = 48 ; par2 = 1 ; par3 = 0 ; par4 = 0 ; par5 = 12 ; par6 = White Noise ; par7 = 0.95 ; par8 = ;
R code (references can be found in the software module):
if (par1 == 'Default') {
par1 = 10*log10(length(x))
} else {
par1 <- as.numeric(par1)
}
par2 <- as.numeric(par2)
par3 <- as.numeric(par3)
par4 <- as.numeric(par4)
par5 <- as.numeric(par5)
if (par6 == 'White Noise') par6 <- 'white' else par6 <- 'ma'
par7 <- as.numeric(par7)
if (par8 != '') par8 <- as.numeric(par8)
ox <- x
if (par8 == '') {
if (par2 == 0) {
x <- log(x)
} else {
x <- (x ^ par2 - 1) / par2
}
} else {
x <- log(x,base=par8)
}
if (par3 > 0) x <- diff(x,lag=1,difference=par3)
if (par4 > 0) x <- diff(x,lag=par5,difference=par4)
bitmap(file='picts.png')
op <- par(mfrow=c(2,1))
plot(ox,type='l',main='Original Time Series',xlab='time',ylab='value')
if (par8=='') {
mytitle <- paste('Working Time Series (lambda=',par2,', d=',par3,', D=',par4,')',sep='')
mysub <- paste('(lambda=',par2,', d=',par3,', D=',par4,', CI=', par7, ', CI type=',par6,')',sep='')
} else {
mytitle <- paste('Working Time Series (base=',par8,', d=',par3,', D=',par4,')',sep='')
mysub <- paste('(base=',par8,', d=',par3,', D=',par4,', CI=', par7, ', CI type=',par6,')',sep='')
}
plot(x,type='l', main=mytitle,xlab='time',ylab='value')
par(op)
dev.off()
bitmap(file='pic1.png')
racf <- acf(x, par1, main='Autocorrelation', xlab='time lag', ylab='ACF', ci.type=par6, ci=par7, sub=mysub)
dev.off()
bitmap(file='pic2.png')
rpacf <- pacf(x,par1,main='Partial Autocorrelation',xlab='lags',ylab='PACF',sub=mysub)
dev.off()
(myacf <- c(racf$acf))
(mypacf <- c(rpacf$acf))
lengthx <- length(x)
sqrtn <- sqrt(lengthx)
load(file='createtable')
a<-table.start()
a<-table.row.start(a)
a<-table.element(a,'Autocorrelation Function',4,TRUE)
a<-table.row.end(a)
a<-table.row.start(a)
a<-table.element(a,'Time lag k',header=TRUE)
a<-table.element(a,hyperlink('basics.htm','ACF(k)','click here for more information about the Autocorrelation Function'),header=TRUE)
a<-table.element(a,'T-STAT',header=TRUE)
a<-table.element(a,'P-value',header=TRUE)
a<-table.row.end(a)
for (i in 2:(par1+1)) {
a<-table.row.start(a)
a<-table.element(a,i-1,header=TRUE)
a<-table.element(a,round(myacf[i],6))
mytstat <- myacf[i]*sqrtn
a<-table.element(a,round(mytstat,4))
a<-table.element(a,round(1-pt(abs(mytstat),lengthx),6))
a<-table.row.end(a)
}
a<-table.end(a)
table.save(a,file='mytable.tab')
a<-table.start()
a<-table.row.start(a)
a<-table.element(a,'Partial Autocorrelation Function',4,TRUE)
a<-table.row.end(a)
a<-table.row.start(a)
a<-table.element(a,'Time lag k',header=TRUE)
a<-table.element(a,hyperlink('basics.htm','PACF(k)','click here for more information about the Partial Autocorrelation Function'),header=TRUE)
a<-table.element(a,'T-STAT',header=TRUE)
a<-table.element(a,'P-value',header=TRUE)
a<-table.row.end(a)
for (i in 1:par1) {
a<-table.row.start(a)
a<-table.element(a,i,header=TRUE)
a<-table.element(a,round(mypacf[i],6))
mytstat <- mypacf[i]*sqrtn
a<-table.element(a,round(mytstat,4))
a<-table.element(a,round(1-pt(abs(mytstat),lengthx),6))
a<-table.row.end(a)
}
a<-table.end(a)
table.save(a,file='mytable1.tab')