Free Statistics

of Irreproducible Research!

Author's title

Author*Unverified author*
R Software Modulerwasp_autocorrelation.wasp
Title produced by software(Partial) Autocorrelation Function
Date of computationThu, 19 May 2011 17:08:09 +0000
Cite this page as followsStatistical Computations at FreeStatistics.org, Office for Research Development and Education, URL https://freestatistics.org/blog/index.php?v=date/2011/May/19/t1305824654p93168kymx2kyhd.htm/, Retrieved Sat, 11 May 2024 12:20:06 +0000
Statistical Computations at FreeStatistics.org, Office for Research Development and Education, URL https://freestatistics.org/blog/index.php?pk=122152, Retrieved Sat, 11 May 2024 12:20:06 +0000
QR Codes:

Original text written by user:
IsPrivate?No (this computation is public)
User-defined keywordsKDGP2W12
Estimated Impact93
Family? (F = Feedback message, R = changed R code, M = changed R Module, P = changed Parameters, D = changed Data)
-       [(Partial) Autocorrelation Function] [inflation in cons...] [2011-05-19 17:08:09] [5e78ed906b09bab42b8ec3dd93b6358a] [Current]
Feedback Forum

Post a new message
Dataseries X:
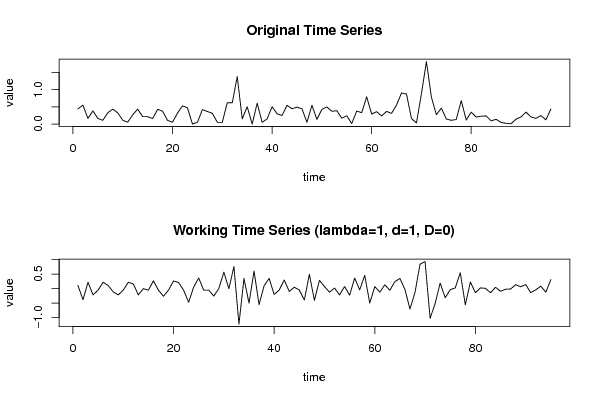
0.440
0.548
0.163
0.381
0.164
0.109
0.328
0.435
0.325
0.108
0.054
0.270
0.431
0.215
0.214
0.160
0.427
0.372
0.106
0.053
0.317
0.527
0.472
0.000
0.052
0.418
0.364
0.311
0.052
0.052
0.620
0.616
1.377
0.151
0.502
0.000
0.606
0.050
0.150
0.501
0.299
0.248
0.545
0.444
0.491
0.444
0.050
0.545
0.138
0.423
0.495
0.370
0.388
0.169
0.241
0.014
0.376
0.331
0.789
0.289
0.359
0.236
0.367
0.309
0.551
0.901
0.870
0.160
0.032
0.877
1.812
0.784
0.270
0.462
0.146
0.108
0.132
0.680
0.117
0.345
0.204
0.227
0.236
0.092
0.138
0.046
0.023
0.009
0.142
0.207
0.346
0.207
0.165
0.247
0.123
0.433


Summary of computational transaction
Raw Inputview raw input (R code)
Raw Outputview raw output of R engine
Computing time2 seconds
R Server'Herman Ole Andreas Wold' @ www.yougetit.org

\begin{tabular}{lllllllll}
\hline
Summary of computational transaction \tabularnewline
Raw Input & view raw input (R code)  \tabularnewline
Raw Output & view raw output of R engine  \tabularnewline
Computing time & 2 seconds \tabularnewline
R Server & 'Herman Ole Andreas Wold' @ www.yougetit.org \tabularnewline
\hline
\end{tabular}
%Source: https://freestatistics.org/blog/index.php?pk=122152&T=0

[TABLE]
[ROW][C]Summary of computational transaction[/C][/ROW]
[ROW][C]Raw Input[/C][C]view raw input (R code) [/C][/ROW]
[ROW][C]Raw Output[/C][C]view raw output of R engine [/C][/ROW]
[ROW][C]Computing time[/C][C]2 seconds[/C][/ROW]
[ROW][C]R Server[/C][C]'Herman Ole Andreas Wold' @ www.yougetit.org[/C][/ROW]
[/TABLE]
Source: https://freestatistics.org/blog/index.php?pk=122152&T=0

Globally Unique Identifier (entire table): ba.freestatistics.org/blog/index.php?pk=122152&T=0

As an alternative you can also use a QR Code:  

The GUIDs for individual cells are displayed in the table below:

Summary of computational transaction
Raw Inputview raw input (R code)
Raw Outputview raw output of R engine
Computing time2 seconds
R Server'Herman Ole Andreas Wold' @ www.yougetit.org


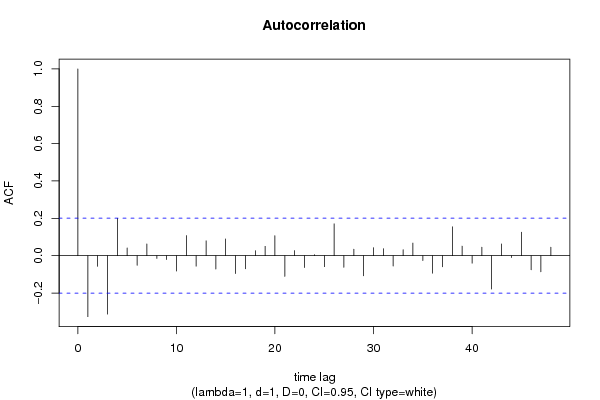
Autocorrelation Function
Time lag kACF(k)T-STATP-value
1-0.326606-3.18340.000984
2-0.056952-0.55510.290066
3-0.312929-3.05010.001483
40.1999491.94890.027131
50.0407060.39680.346221
6-0.051431-0.50130.308664
70.0621550.60580.273042
8-0.014712-0.14340.443139
9-0.020379-0.19860.42149
10-0.081917-0.79840.213306
110.1073551.04640.149023
12-0.056147-0.54720.292746
130.0794320.77420.220364
14-0.071208-0.6940.244673
150.0890480.86790.193808
16-0.095293-0.92880.177672
17-0.070167-0.68390.247851
180.0267220.26050.397538
190.0498150.48550.314208
200.1064981.0380.150949
21-0.11077-1.07960.141516
220.0271660.26480.395877
23-0.063406-0.6180.269025
240.0045380.04420.482406
25-0.058915-0.57420.283585
260.1703921.66080.050028
27-0.062385-0.60810.272302
280.034420.33550.369
29-0.107926-1.05190.147748
300.0420870.41020.341285
310.0374390.36490.357994
32-0.055473-0.54070.294996
330.031790.30980.378678
340.0672580.65560.256849
35-0.026135-0.25470.399739
36-0.093533-0.91170.18213
37-0.059829-0.58310.280592
380.1541691.50270.068123
390.0509920.4970.310164
40-0.040147-0.39130.348224
410.0455140.44360.329166
42-0.178745-1.74220.042356
430.0623450.60770.272431
44-0.009654-0.09410.462617
450.1252421.22070.11261
46-0.075503-0.73590.231798
47-0.085911-0.83740.202245
480.0446910.43560.332061

\begin{tabular}{lllllllll}
\hline
Autocorrelation Function \tabularnewline
Time lag k & ACF(k) & T-STAT & P-value \tabularnewline
1 & -0.326606 & -3.1834 & 0.000984 \tabularnewline
2 & -0.056952 & -0.5551 & 0.290066 \tabularnewline
3 & -0.312929 & -3.0501 & 0.001483 \tabularnewline
4 & 0.199949 & 1.9489 & 0.027131 \tabularnewline
5 & 0.040706 & 0.3968 & 0.346221 \tabularnewline
6 & -0.051431 & -0.5013 & 0.308664 \tabularnewline
7 & 0.062155 & 0.6058 & 0.273042 \tabularnewline
8 & -0.014712 & -0.1434 & 0.443139 \tabularnewline
9 & -0.020379 & -0.1986 & 0.42149 \tabularnewline
10 & -0.081917 & -0.7984 & 0.213306 \tabularnewline
11 & 0.107355 & 1.0464 & 0.149023 \tabularnewline
12 & -0.056147 & -0.5472 & 0.292746 \tabularnewline
13 & 0.079432 & 0.7742 & 0.220364 \tabularnewline
14 & -0.071208 & -0.694 & 0.244673 \tabularnewline
15 & 0.089048 & 0.8679 & 0.193808 \tabularnewline
16 & -0.095293 & -0.9288 & 0.177672 \tabularnewline
17 & -0.070167 & -0.6839 & 0.247851 \tabularnewline
18 & 0.026722 & 0.2605 & 0.397538 \tabularnewline
19 & 0.049815 & 0.4855 & 0.314208 \tabularnewline
20 & 0.106498 & 1.038 & 0.150949 \tabularnewline
21 & -0.11077 & -1.0796 & 0.141516 \tabularnewline
22 & 0.027166 & 0.2648 & 0.395877 \tabularnewline
23 & -0.063406 & -0.618 & 0.269025 \tabularnewline
24 & 0.004538 & 0.0442 & 0.482406 \tabularnewline
25 & -0.058915 & -0.5742 & 0.283585 \tabularnewline
26 & 0.170392 & 1.6608 & 0.050028 \tabularnewline
27 & -0.062385 & -0.6081 & 0.272302 \tabularnewline
28 & 0.03442 & 0.3355 & 0.369 \tabularnewline
29 & -0.107926 & -1.0519 & 0.147748 \tabularnewline
30 & 0.042087 & 0.4102 & 0.341285 \tabularnewline
31 & 0.037439 & 0.3649 & 0.357994 \tabularnewline
32 & -0.055473 & -0.5407 & 0.294996 \tabularnewline
33 & 0.03179 & 0.3098 & 0.378678 \tabularnewline
34 & 0.067258 & 0.6556 & 0.256849 \tabularnewline
35 & -0.026135 & -0.2547 & 0.399739 \tabularnewline
36 & -0.093533 & -0.9117 & 0.18213 \tabularnewline
37 & -0.059829 & -0.5831 & 0.280592 \tabularnewline
38 & 0.154169 & 1.5027 & 0.068123 \tabularnewline
39 & 0.050992 & 0.497 & 0.310164 \tabularnewline
40 & -0.040147 & -0.3913 & 0.348224 \tabularnewline
41 & 0.045514 & 0.4436 & 0.329166 \tabularnewline
42 & -0.178745 & -1.7422 & 0.042356 \tabularnewline
43 & 0.062345 & 0.6077 & 0.272431 \tabularnewline
44 & -0.009654 & -0.0941 & 0.462617 \tabularnewline
45 & 0.125242 & 1.2207 & 0.11261 \tabularnewline
46 & -0.075503 & -0.7359 & 0.231798 \tabularnewline
47 & -0.085911 & -0.8374 & 0.202245 \tabularnewline
48 & 0.044691 & 0.4356 & 0.332061 \tabularnewline
\hline
\end{tabular}
%Source: https://freestatistics.org/blog/index.php?pk=122152&T=1

[TABLE]
[ROW][C]Autocorrelation Function[/C][/ROW]
[ROW][C]Time lag k[/C][C]ACF(k)[/C][C]T-STAT[/C][C]P-value[/C][/ROW]
[ROW][C]1[/C][C]-0.326606[/C][C]-3.1834[/C][C]0.000984[/C][/ROW]
[ROW][C]2[/C][C]-0.056952[/C][C]-0.5551[/C][C]0.290066[/C][/ROW]
[ROW][C]3[/C][C]-0.312929[/C][C]-3.0501[/C][C]0.001483[/C][/ROW]
[ROW][C]4[/C][C]0.199949[/C][C]1.9489[/C][C]0.027131[/C][/ROW]
[ROW][C]5[/C][C]0.040706[/C][C]0.3968[/C][C]0.346221[/C][/ROW]
[ROW][C]6[/C][C]-0.051431[/C][C]-0.5013[/C][C]0.308664[/C][/ROW]
[ROW][C]7[/C][C]0.062155[/C][C]0.6058[/C][C]0.273042[/C][/ROW]
[ROW][C]8[/C][C]-0.014712[/C][C]-0.1434[/C][C]0.443139[/C][/ROW]
[ROW][C]9[/C][C]-0.020379[/C][C]-0.1986[/C][C]0.42149[/C][/ROW]
[ROW][C]10[/C][C]-0.081917[/C][C]-0.7984[/C][C]0.213306[/C][/ROW]
[ROW][C]11[/C][C]0.107355[/C][C]1.0464[/C][C]0.149023[/C][/ROW]
[ROW][C]12[/C][C]-0.056147[/C][C]-0.5472[/C][C]0.292746[/C][/ROW]
[ROW][C]13[/C][C]0.079432[/C][C]0.7742[/C][C]0.220364[/C][/ROW]
[ROW][C]14[/C][C]-0.071208[/C][C]-0.694[/C][C]0.244673[/C][/ROW]
[ROW][C]15[/C][C]0.089048[/C][C]0.8679[/C][C]0.193808[/C][/ROW]
[ROW][C]16[/C][C]-0.095293[/C][C]-0.9288[/C][C]0.177672[/C][/ROW]
[ROW][C]17[/C][C]-0.070167[/C][C]-0.6839[/C][C]0.247851[/C][/ROW]
[ROW][C]18[/C][C]0.026722[/C][C]0.2605[/C][C]0.397538[/C][/ROW]
[ROW][C]19[/C][C]0.049815[/C][C]0.4855[/C][C]0.314208[/C][/ROW]
[ROW][C]20[/C][C]0.106498[/C][C]1.038[/C][C]0.150949[/C][/ROW]
[ROW][C]21[/C][C]-0.11077[/C][C]-1.0796[/C][C]0.141516[/C][/ROW]
[ROW][C]22[/C][C]0.027166[/C][C]0.2648[/C][C]0.395877[/C][/ROW]
[ROW][C]23[/C][C]-0.063406[/C][C]-0.618[/C][C]0.269025[/C][/ROW]
[ROW][C]24[/C][C]0.004538[/C][C]0.0442[/C][C]0.482406[/C][/ROW]
[ROW][C]25[/C][C]-0.058915[/C][C]-0.5742[/C][C]0.283585[/C][/ROW]
[ROW][C]26[/C][C]0.170392[/C][C]1.6608[/C][C]0.050028[/C][/ROW]
[ROW][C]27[/C][C]-0.062385[/C][C]-0.6081[/C][C]0.272302[/C][/ROW]
[ROW][C]28[/C][C]0.03442[/C][C]0.3355[/C][C]0.369[/C][/ROW]
[ROW][C]29[/C][C]-0.107926[/C][C]-1.0519[/C][C]0.147748[/C][/ROW]
[ROW][C]30[/C][C]0.042087[/C][C]0.4102[/C][C]0.341285[/C][/ROW]
[ROW][C]31[/C][C]0.037439[/C][C]0.3649[/C][C]0.357994[/C][/ROW]
[ROW][C]32[/C][C]-0.055473[/C][C]-0.5407[/C][C]0.294996[/C][/ROW]
[ROW][C]33[/C][C]0.03179[/C][C]0.3098[/C][C]0.378678[/C][/ROW]
[ROW][C]34[/C][C]0.067258[/C][C]0.6556[/C][C]0.256849[/C][/ROW]
[ROW][C]35[/C][C]-0.026135[/C][C]-0.2547[/C][C]0.399739[/C][/ROW]
[ROW][C]36[/C][C]-0.093533[/C][C]-0.9117[/C][C]0.18213[/C][/ROW]
[ROW][C]37[/C][C]-0.059829[/C][C]-0.5831[/C][C]0.280592[/C][/ROW]
[ROW][C]38[/C][C]0.154169[/C][C]1.5027[/C][C]0.068123[/C][/ROW]
[ROW][C]39[/C][C]0.050992[/C][C]0.497[/C][C]0.310164[/C][/ROW]
[ROW][C]40[/C][C]-0.040147[/C][C]-0.3913[/C][C]0.348224[/C][/ROW]
[ROW][C]41[/C][C]0.045514[/C][C]0.4436[/C][C]0.329166[/C][/ROW]
[ROW][C]42[/C][C]-0.178745[/C][C]-1.7422[/C][C]0.042356[/C][/ROW]
[ROW][C]43[/C][C]0.062345[/C][C]0.6077[/C][C]0.272431[/C][/ROW]
[ROW][C]44[/C][C]-0.009654[/C][C]-0.0941[/C][C]0.462617[/C][/ROW]
[ROW][C]45[/C][C]0.125242[/C][C]1.2207[/C][C]0.11261[/C][/ROW]
[ROW][C]46[/C][C]-0.075503[/C][C]-0.7359[/C][C]0.231798[/C][/ROW]
[ROW][C]47[/C][C]-0.085911[/C][C]-0.8374[/C][C]0.202245[/C][/ROW]
[ROW][C]48[/C][C]0.044691[/C][C]0.4356[/C][C]0.332061[/C][/ROW]
[/TABLE]
Source: https://freestatistics.org/blog/index.php?pk=122152&T=1

Globally Unique Identifier (entire table): ba.freestatistics.org/blog/index.php?pk=122152&T=1

As an alternative you can also use a QR Code:  

The GUIDs for individual cells are displayed in the table below:

Autocorrelation Function
Time lag kACF(k)T-STATP-value
1-0.326606-3.18340.000984
2-0.056952-0.55510.290066
3-0.312929-3.05010.001483
40.1999491.94890.027131
50.0407060.39680.346221
6-0.051431-0.50130.308664
70.0621550.60580.273042
8-0.014712-0.14340.443139
9-0.020379-0.19860.42149
10-0.081917-0.79840.213306
110.1073551.04640.149023
12-0.056147-0.54720.292746
130.0794320.77420.220364
14-0.071208-0.6940.244673
150.0890480.86790.193808
16-0.095293-0.92880.177672
17-0.070167-0.68390.247851
180.0267220.26050.397538
190.0498150.48550.314208
200.1064981.0380.150949
21-0.11077-1.07960.141516
220.0271660.26480.395877
23-0.063406-0.6180.269025
240.0045380.04420.482406
25-0.058915-0.57420.283585
260.1703921.66080.050028
27-0.062385-0.60810.272302
280.034420.33550.369
29-0.107926-1.05190.147748
300.0420870.41020.341285
310.0374390.36490.357994
32-0.055473-0.54070.294996
330.031790.30980.378678
340.0672580.65560.256849
35-0.026135-0.25470.399739
36-0.093533-0.91170.18213
37-0.059829-0.58310.280592
380.1541691.50270.068123
390.0509920.4970.310164
40-0.040147-0.39130.348224
410.0455140.44360.329166
42-0.178745-1.74220.042356
430.0623450.60770.272431
44-0.009654-0.09410.462617
450.1252421.22070.11261
46-0.075503-0.73590.231798
47-0.085911-0.83740.202245
480.0446910.43560.332061


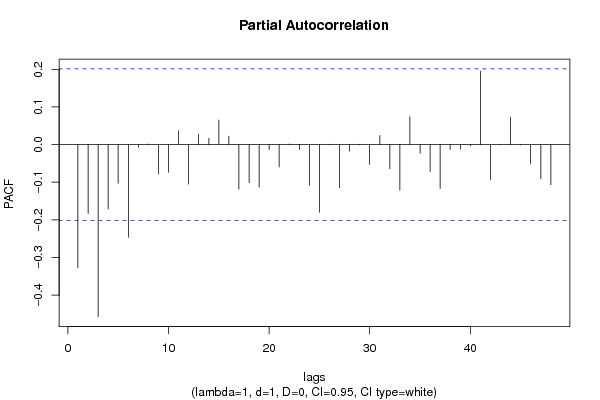
Partial Autocorrelation Function
Time lag kPACF(k)T-STATP-value
1-0.326606-3.18340.000984
2-0.183162-1.78520.038707
3-0.457236-4.45661.1e-05
4-0.171357-1.67020.049088
5-0.102768-1.00170.159527
6-0.246166-2.39930.009188
7-0.006419-0.06260.47512
80.0016040.01560.493779
9-0.077775-0.75810.225147
10-0.07343-0.71570.237962
110.03680.35870.360314
12-0.104946-1.02290.15448
130.027370.26680.395114
140.0170030.16570.434361
150.0655170.63860.262317
160.0221690.21610.414694
17-0.118658-1.15650.125181
18-0.101062-0.9850.163557
19-0.113023-1.10160.136706
20-0.012884-0.12560.450165
21-0.05957-0.58060.281436
220.0017140.01670.493352
23-0.013143-0.12810.449169
24-0.107638-1.04910.14839
25-0.179501-1.74960.041711
260.0010060.00980.496099
27-0.114332-1.11440.133966
28-0.01733-0.16890.433112
290.0011860.01160.495401
30-0.052606-0.51270.304663
310.0239460.23340.407979
32-0.06405-0.62430.266968
33-0.120571-1.17520.121429
340.0738080.71940.236834
35-0.023207-0.22620.41077
36-0.071454-0.69640.243924
37-0.116419-1.13470.129676
38-0.01269-0.12370.450913
39-0.011317-0.11030.456201
40-0.002883-0.02810.48882
410.1948871.89950.030265
42-0.093219-0.90860.182933
430.0004610.00450.498213
440.0728640.71020.239662
45-0.000707-0.00690.497258
46-0.05126-0.49960.309247
47-0.090392-0.8810.190261
48-0.106438-1.03740.151084

\begin{tabular}{lllllllll}
\hline
Partial Autocorrelation Function \tabularnewline
Time lag k & PACF(k) & T-STAT & P-value \tabularnewline
1 & -0.326606 & -3.1834 & 0.000984 \tabularnewline
2 & -0.183162 & -1.7852 & 0.038707 \tabularnewline
3 & -0.457236 & -4.4566 & 1.1e-05 \tabularnewline
4 & -0.171357 & -1.6702 & 0.049088 \tabularnewline
5 & -0.102768 & -1.0017 & 0.159527 \tabularnewline
6 & -0.246166 & -2.3993 & 0.009188 \tabularnewline
7 & -0.006419 & -0.0626 & 0.47512 \tabularnewline
8 & 0.001604 & 0.0156 & 0.493779 \tabularnewline
9 & -0.077775 & -0.7581 & 0.225147 \tabularnewline
10 & -0.07343 & -0.7157 & 0.237962 \tabularnewline
11 & 0.0368 & 0.3587 & 0.360314 \tabularnewline
12 & -0.104946 & -1.0229 & 0.15448 \tabularnewline
13 & 0.02737 & 0.2668 & 0.395114 \tabularnewline
14 & 0.017003 & 0.1657 & 0.434361 \tabularnewline
15 & 0.065517 & 0.6386 & 0.262317 \tabularnewline
16 & 0.022169 & 0.2161 & 0.414694 \tabularnewline
17 & -0.118658 & -1.1565 & 0.125181 \tabularnewline
18 & -0.101062 & -0.985 & 0.163557 \tabularnewline
19 & -0.113023 & -1.1016 & 0.136706 \tabularnewline
20 & -0.012884 & -0.1256 & 0.450165 \tabularnewline
21 & -0.05957 & -0.5806 & 0.281436 \tabularnewline
22 & 0.001714 & 0.0167 & 0.493352 \tabularnewline
23 & -0.013143 & -0.1281 & 0.449169 \tabularnewline
24 & -0.107638 & -1.0491 & 0.14839 \tabularnewline
25 & -0.179501 & -1.7496 & 0.041711 \tabularnewline
26 & 0.001006 & 0.0098 & 0.496099 \tabularnewline
27 & -0.114332 & -1.1144 & 0.133966 \tabularnewline
28 & -0.01733 & -0.1689 & 0.433112 \tabularnewline
29 & 0.001186 & 0.0116 & 0.495401 \tabularnewline
30 & -0.052606 & -0.5127 & 0.304663 \tabularnewline
31 & 0.023946 & 0.2334 & 0.407979 \tabularnewline
32 & -0.06405 & -0.6243 & 0.266968 \tabularnewline
33 & -0.120571 & -1.1752 & 0.121429 \tabularnewline
34 & 0.073808 & 0.7194 & 0.236834 \tabularnewline
35 & -0.023207 & -0.2262 & 0.41077 \tabularnewline
36 & -0.071454 & -0.6964 & 0.243924 \tabularnewline
37 & -0.116419 & -1.1347 & 0.129676 \tabularnewline
38 & -0.01269 & -0.1237 & 0.450913 \tabularnewline
39 & -0.011317 & -0.1103 & 0.456201 \tabularnewline
40 & -0.002883 & -0.0281 & 0.48882 \tabularnewline
41 & 0.194887 & 1.8995 & 0.030265 \tabularnewline
42 & -0.093219 & -0.9086 & 0.182933 \tabularnewline
43 & 0.000461 & 0.0045 & 0.498213 \tabularnewline
44 & 0.072864 & 0.7102 & 0.239662 \tabularnewline
45 & -0.000707 & -0.0069 & 0.497258 \tabularnewline
46 & -0.05126 & -0.4996 & 0.309247 \tabularnewline
47 & -0.090392 & -0.881 & 0.190261 \tabularnewline
48 & -0.106438 & -1.0374 & 0.151084 \tabularnewline
\hline
\end{tabular}
%Source: https://freestatistics.org/blog/index.php?pk=122152&T=2

[TABLE]
[ROW][C]Partial Autocorrelation Function[/C][/ROW]
[ROW][C]Time lag k[/C][C]PACF(k)[/C][C]T-STAT[/C][C]P-value[/C][/ROW]
[ROW][C]1[/C][C]-0.326606[/C][C]-3.1834[/C][C]0.000984[/C][/ROW]
[ROW][C]2[/C][C]-0.183162[/C][C]-1.7852[/C][C]0.038707[/C][/ROW]
[ROW][C]3[/C][C]-0.457236[/C][C]-4.4566[/C][C]1.1e-05[/C][/ROW]
[ROW][C]4[/C][C]-0.171357[/C][C]-1.6702[/C][C]0.049088[/C][/ROW]
[ROW][C]5[/C][C]-0.102768[/C][C]-1.0017[/C][C]0.159527[/C][/ROW]
[ROW][C]6[/C][C]-0.246166[/C][C]-2.3993[/C][C]0.009188[/C][/ROW]
[ROW][C]7[/C][C]-0.006419[/C][C]-0.0626[/C][C]0.47512[/C][/ROW]
[ROW][C]8[/C][C]0.001604[/C][C]0.0156[/C][C]0.493779[/C][/ROW]
[ROW][C]9[/C][C]-0.077775[/C][C]-0.7581[/C][C]0.225147[/C][/ROW]
[ROW][C]10[/C][C]-0.07343[/C][C]-0.7157[/C][C]0.237962[/C][/ROW]
[ROW][C]11[/C][C]0.0368[/C][C]0.3587[/C][C]0.360314[/C][/ROW]
[ROW][C]12[/C][C]-0.104946[/C][C]-1.0229[/C][C]0.15448[/C][/ROW]
[ROW][C]13[/C][C]0.02737[/C][C]0.2668[/C][C]0.395114[/C][/ROW]
[ROW][C]14[/C][C]0.017003[/C][C]0.1657[/C][C]0.434361[/C][/ROW]
[ROW][C]15[/C][C]0.065517[/C][C]0.6386[/C][C]0.262317[/C][/ROW]
[ROW][C]16[/C][C]0.022169[/C][C]0.2161[/C][C]0.414694[/C][/ROW]
[ROW][C]17[/C][C]-0.118658[/C][C]-1.1565[/C][C]0.125181[/C][/ROW]
[ROW][C]18[/C][C]-0.101062[/C][C]-0.985[/C][C]0.163557[/C][/ROW]
[ROW][C]19[/C][C]-0.113023[/C][C]-1.1016[/C][C]0.136706[/C][/ROW]
[ROW][C]20[/C][C]-0.012884[/C][C]-0.1256[/C][C]0.450165[/C][/ROW]
[ROW][C]21[/C][C]-0.05957[/C][C]-0.5806[/C][C]0.281436[/C][/ROW]
[ROW][C]22[/C][C]0.001714[/C][C]0.0167[/C][C]0.493352[/C][/ROW]
[ROW][C]23[/C][C]-0.013143[/C][C]-0.1281[/C][C]0.449169[/C][/ROW]
[ROW][C]24[/C][C]-0.107638[/C][C]-1.0491[/C][C]0.14839[/C][/ROW]
[ROW][C]25[/C][C]-0.179501[/C][C]-1.7496[/C][C]0.041711[/C][/ROW]
[ROW][C]26[/C][C]0.001006[/C][C]0.0098[/C][C]0.496099[/C][/ROW]
[ROW][C]27[/C][C]-0.114332[/C][C]-1.1144[/C][C]0.133966[/C][/ROW]
[ROW][C]28[/C][C]-0.01733[/C][C]-0.1689[/C][C]0.433112[/C][/ROW]
[ROW][C]29[/C][C]0.001186[/C][C]0.0116[/C][C]0.495401[/C][/ROW]
[ROW][C]30[/C][C]-0.052606[/C][C]-0.5127[/C][C]0.304663[/C][/ROW]
[ROW][C]31[/C][C]0.023946[/C][C]0.2334[/C][C]0.407979[/C][/ROW]
[ROW][C]32[/C][C]-0.06405[/C][C]-0.6243[/C][C]0.266968[/C][/ROW]
[ROW][C]33[/C][C]-0.120571[/C][C]-1.1752[/C][C]0.121429[/C][/ROW]
[ROW][C]34[/C][C]0.073808[/C][C]0.7194[/C][C]0.236834[/C][/ROW]
[ROW][C]35[/C][C]-0.023207[/C][C]-0.2262[/C][C]0.41077[/C][/ROW]
[ROW][C]36[/C][C]-0.071454[/C][C]-0.6964[/C][C]0.243924[/C][/ROW]
[ROW][C]37[/C][C]-0.116419[/C][C]-1.1347[/C][C]0.129676[/C][/ROW]
[ROW][C]38[/C][C]-0.01269[/C][C]-0.1237[/C][C]0.450913[/C][/ROW]
[ROW][C]39[/C][C]-0.011317[/C][C]-0.1103[/C][C]0.456201[/C][/ROW]
[ROW][C]40[/C][C]-0.002883[/C][C]-0.0281[/C][C]0.48882[/C][/ROW]
[ROW][C]41[/C][C]0.194887[/C][C]1.8995[/C][C]0.030265[/C][/ROW]
[ROW][C]42[/C][C]-0.093219[/C][C]-0.9086[/C][C]0.182933[/C][/ROW]
[ROW][C]43[/C][C]0.000461[/C][C]0.0045[/C][C]0.498213[/C][/ROW]
[ROW][C]44[/C][C]0.072864[/C][C]0.7102[/C][C]0.239662[/C][/ROW]
[ROW][C]45[/C][C]-0.000707[/C][C]-0.0069[/C][C]0.497258[/C][/ROW]
[ROW][C]46[/C][C]-0.05126[/C][C]-0.4996[/C][C]0.309247[/C][/ROW]
[ROW][C]47[/C][C]-0.090392[/C][C]-0.881[/C][C]0.190261[/C][/ROW]
[ROW][C]48[/C][C]-0.106438[/C][C]-1.0374[/C][C]0.151084[/C][/ROW]
[/TABLE]
Source: https://freestatistics.org/blog/index.php?pk=122152&T=2

Globally Unique Identifier (entire table): ba.freestatistics.org/blog/index.php?pk=122152&T=2

As an alternative you can also use a QR Code:  

The GUIDs for individual cells are displayed in the table below:

Partial Autocorrelation Function
Time lag kPACF(k)T-STATP-value
1-0.326606-3.18340.000984
2-0.183162-1.78520.038707
3-0.457236-4.45661.1e-05
4-0.171357-1.67020.049088
5-0.102768-1.00170.159527
6-0.246166-2.39930.009188
7-0.006419-0.06260.47512
80.0016040.01560.493779
9-0.077775-0.75810.225147
10-0.07343-0.71570.237962
110.03680.35870.360314
12-0.104946-1.02290.15448
130.027370.26680.395114
140.0170030.16570.434361
150.0655170.63860.262317
160.0221690.21610.414694
17-0.118658-1.15650.125181
18-0.101062-0.9850.163557
19-0.113023-1.10160.136706
20-0.012884-0.12560.450165
21-0.05957-0.58060.281436
220.0017140.01670.493352
23-0.013143-0.12810.449169
24-0.107638-1.04910.14839
25-0.179501-1.74960.041711
260.0010060.00980.496099
27-0.114332-1.11440.133966
28-0.01733-0.16890.433112
290.0011860.01160.495401
30-0.052606-0.51270.304663
310.0239460.23340.407979
32-0.06405-0.62430.266968
33-0.120571-1.17520.121429
340.0738080.71940.236834
35-0.023207-0.22620.41077
36-0.071454-0.69640.243924
37-0.116419-1.13470.129676
38-0.01269-0.12370.450913
39-0.011317-0.11030.456201
40-0.002883-0.02810.48882
410.1948871.89950.030265
42-0.093219-0.90860.182933
430.0004610.00450.498213
440.0728640.71020.239662
45-0.000707-0.00690.497258
46-0.05126-0.49960.309247
47-0.090392-0.8810.190261
48-0.106438-1.03740.151084


Parameters (Session):
par1 = Studio 100 PRIJS 2005 ; par2 = Studio 100 PRIJS 2005 ; par3 = Studio 100 PRIJS 2005 ; par4 = 12 ;
Parameters (R input):
par1 = 48 ; par2 = 1 ; par3 = 1 ; par4 = 0 ; par5 = 12 ; par6 = White Noise ; par7 = 0.95 ; par8 = ;
R code (references can be found in the software module):
if (par1 == 'Default') {
par1 = 10*log10(length(x))
} else {
par1 <- as.numeric(par1)
}
par2 <- as.numeric(par2)
par3 <- as.numeric(par3)
par4 <- as.numeric(par4)
par5 <- as.numeric(par5)
if (par6 == 'White Noise') par6 <- 'white' else par6 <- 'ma'
par7 <- as.numeric(par7)
if (par8 != '') par8 <- as.numeric(par8)
ox <- x
if (par8 == '') {
if (par2 == 0) {
x <- log(x)
} else {
x <- (x ^ par2 - 1) / par2
}
} else {
x <- log(x,base=par8)
}
if (par3 > 0) x <- diff(x,lag=1,difference=par3)
if (par4 > 0) x <- diff(x,lag=par5,difference=par4)
bitmap(file='picts.png')
op <- par(mfrow=c(2,1))
plot(ox,type='l',main='Original Time Series',xlab='time',ylab='value')
if (par8=='') {
mytitle <- paste('Working Time Series (lambda=',par2,', d=',par3,', D=',par4,')',sep='')
mysub <- paste('(lambda=',par2,', d=',par3,', D=',par4,', CI=', par7, ', CI type=',par6,')',sep='')
} else {
mytitle <- paste('Working Time Series (base=',par8,', d=',par3,', D=',par4,')',sep='')
mysub <- paste('(base=',par8,', d=',par3,', D=',par4,', CI=', par7, ', CI type=',par6,')',sep='')
}
plot(x,type='l', main=mytitle,xlab='time',ylab='value')
par(op)
dev.off()
bitmap(file='pic1.png')
racf <- acf(x, par1, main='Autocorrelation', xlab='time lag', ylab='ACF', ci.type=par6, ci=par7, sub=mysub)
dev.off()
bitmap(file='pic2.png')
rpacf <- pacf(x,par1,main='Partial Autocorrelation',xlab='lags',ylab='PACF',sub=mysub)
dev.off()
(myacf <- c(racf$acf))
(mypacf <- c(rpacf$acf))
lengthx <- length(x)
sqrtn <- sqrt(lengthx)
load(file='createtable')
a<-table.start()
a<-table.row.start(a)
a<-table.element(a,'Autocorrelation Function',4,TRUE)
a<-table.row.end(a)
a<-table.row.start(a)
a<-table.element(a,'Time lag k',header=TRUE)
a<-table.element(a,hyperlink('basics.htm','ACF(k)','click here for more information about the Autocorrelation Function'),header=TRUE)
a<-table.element(a,'T-STAT',header=TRUE)
a<-table.element(a,'P-value',header=TRUE)
a<-table.row.end(a)
for (i in 2:(par1+1)) {
a<-table.row.start(a)
a<-table.element(a,i-1,header=TRUE)
a<-table.element(a,round(myacf[i],6))
mytstat <- myacf[i]*sqrtn
a<-table.element(a,round(mytstat,4))
a<-table.element(a,round(1-pt(abs(mytstat),lengthx),6))
a<-table.row.end(a)
}
a<-table.end(a)
table.save(a,file='mytable.tab')
a<-table.start()
a<-table.row.start(a)
a<-table.element(a,'Partial Autocorrelation Function',4,TRUE)
a<-table.row.end(a)
a<-table.row.start(a)
a<-table.element(a,'Time lag k',header=TRUE)
a<-table.element(a,hyperlink('basics.htm','PACF(k)','click here for more information about the Partial Autocorrelation Function'),header=TRUE)
a<-table.element(a,'T-STAT',header=TRUE)
a<-table.element(a,'P-value',header=TRUE)
a<-table.row.end(a)
for (i in 1:par1) {
a<-table.row.start(a)
a<-table.element(a,i,header=TRUE)
a<-table.element(a,round(mypacf[i],6))
mytstat <- mypacf[i]*sqrtn
a<-table.element(a,round(mytstat,4))
a<-table.element(a,round(1-pt(abs(mytstat),lengthx),6))
a<-table.row.end(a)
}
a<-table.end(a)
table.save(a,file='mytable1.tab')