Free Statistics

of Irreproducible Research!

Author's title

Author*Unverified author*
R Software Modulerwasp_autocorrelation.wasp
Title produced by software(Partial) Autocorrelation Function
Date of computationThu, 19 May 2011 17:05:00 +0000
Cite this page as followsStatistical Computations at FreeStatistics.org, Office for Research Development and Education, URL https://freestatistics.org/blog/index.php?v=date/2011/May/19/t1305824510c77l48x89ftafzb.htm/, Retrieved Sat, 11 May 2024 21:58:52 +0000
Statistical Computations at FreeStatistics.org, Office for Research Development and Education, URL https://freestatistics.org/blog/index.php?pk=122149, Retrieved Sat, 11 May 2024 21:58:52 +0000
QR Codes:

Original text written by user:
IsPrivate?No (this computation is public)
User-defined keywordsKDGP2W12
Estimated Impact89
Family? (F = Feedback message, R = changed R code, M = changed R Module, P = changed Parameters, D = changed Data)
-       [(Partial) Autocorrelation Function] [inflation in cons...] [2011-05-19 17:05:00] [5e78ed906b09bab42b8ec3dd93b6358a] [Current]
Feedback Forum

Post a new message
Dataseries X:
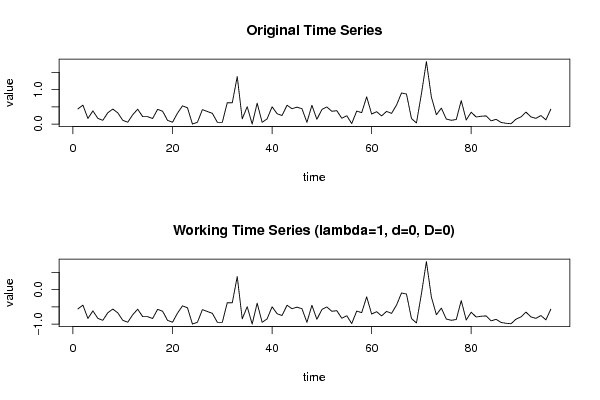
0.440
0.548
0.163
0.381
0.164
0.109
0.328
0.435
0.325
0.108
0.054
0.270
0.431
0.215
0.214
0.160
0.427
0.372
0.106
0.053
0.317
0.527
0.472
0.000
0.052
0.418
0.364
0.311
0.052
0.052
0.620
0.616
1.377
0.151
0.502
0.000
0.606
0.050
0.150
0.501
0.299
0.248
0.545
0.444
0.491
0.444
0.050
0.545
0.138
0.423
0.495
0.370
0.388
0.169
0.241
0.014
0.376
0.331
0.789
0.289
0.359
0.236
0.367
0.309
0.551
0.901
0.870
0.160
0.032
0.877
1.812
0.784
0.270
0.462
0.146
0.108
0.132
0.680
0.117
0.345
0.204
0.227
0.236
0.092
0.138
0.046
0.023
0.009
0.142
0.207
0.346
0.207
0.165
0.247
0.123
0.433


Summary of computational transaction
Raw Inputview raw input (R code)
Raw Outputview raw output of R engine
Computing time2 seconds
R Server'Sir Ronald Aylmer Fisher' @ 193.190.124.24

\begin{tabular}{lllllllll}
\hline
Summary of computational transaction \tabularnewline
Raw Input & view raw input (R code)  \tabularnewline
Raw Output & view raw output of R engine  \tabularnewline
Computing time & 2 seconds \tabularnewline
R Server & 'Sir Ronald Aylmer Fisher' @ 193.190.124.24 \tabularnewline
\hline
\end{tabular}
%Source: https://freestatistics.org/blog/index.php?pk=122149&T=0

[TABLE]
[ROW][C]Summary of computational transaction[/C][/ROW]
[ROW][C]Raw Input[/C][C]view raw input (R code) [/C][/ROW]
[ROW][C]Raw Output[/C][C]view raw output of R engine [/C][/ROW]
[ROW][C]Computing time[/C][C]2 seconds[/C][/ROW]
[ROW][C]R Server[/C][C]'Sir Ronald Aylmer Fisher' @ 193.190.124.24[/C][/ROW]
[/TABLE]
Source: https://freestatistics.org/blog/index.php?pk=122149&T=0

Globally Unique Identifier (entire table): ba.freestatistics.org/blog/index.php?pk=122149&T=0

As an alternative you can also use a QR Code:  

The GUIDs for individual cells are displayed in the table below:

Summary of computational transaction
Raw Inputview raw input (R code)
Raw Outputview raw output of R engine
Computing time2 seconds
R Server'Sir Ronald Aylmer Fisher' @ 193.190.124.24


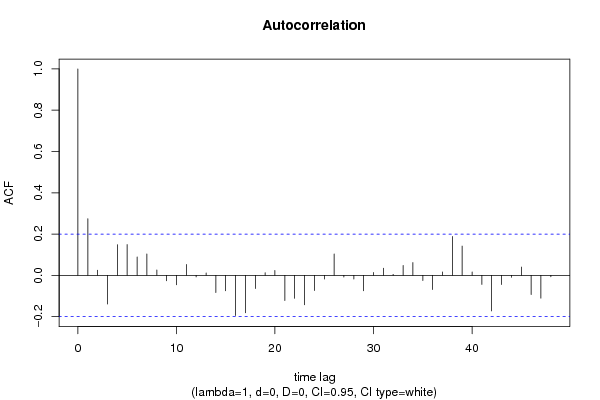
Autocorrelation Function
Time lag kACF(k)T-STATP-value
10.27472.69150.004196
20.0248160.24310.404205
3-0.138797-1.35990.088519
40.1486191.45620.074305
50.1490851.46070.073677
60.0895590.87750.191205
70.1032261.01140.157183
80.026250.25720.398788
9-0.026102-0.25570.399346
10-0.046058-0.45130.326404
110.0530410.51970.302237
12-0.00757-0.07420.470516
130.0114270.1120.455544
14-0.083418-0.81730.207882
15-0.07504-0.73520.231994
16-0.194507-1.90580.029836
17-0.181678-1.78010.039114
18-0.063461-0.62180.267779
190.0123790.12130.451859
200.0241260.23640.406818
21-0.121738-1.19280.117947
22-0.110727-1.08490.140343
23-0.142457-1.39580.082999
24-0.073142-0.71660.237668
25-0.01795-0.17590.430383
260.103711.01610.156058
27-0.008131-0.07970.468333
28-0.017691-0.17330.431377
29-0.075103-0.73590.231807
300.0143180.14030.444363
310.0343370.33640.36864
320.0048550.04760.48108
330.0480820.47110.319316
340.0619210.60670.272741
35-0.024858-0.24360.404047
36-0.068303-0.66920.252477
370.0159870.15660.43793
380.1881561.84350.034168
390.141791.38930.083985
400.016020.1570.4378
41-0.043958-0.43070.333826
42-0.172117-1.68640.047483
43-0.044766-0.43860.330964
44-0.009146-0.08960.46439
450.040020.39210.347923
46-0.093122-0.91240.18192
47-0.110404-1.08170.141041
48-0.006556-0.06420.474457

\begin{tabular}{lllllllll}
\hline
Autocorrelation Function \tabularnewline
Time lag k & ACF(k) & T-STAT & P-value \tabularnewline
1 & 0.2747 & 2.6915 & 0.004196 \tabularnewline
2 & 0.024816 & 0.2431 & 0.404205 \tabularnewline
3 & -0.138797 & -1.3599 & 0.088519 \tabularnewline
4 & 0.148619 & 1.4562 & 0.074305 \tabularnewline
5 & 0.149085 & 1.4607 & 0.073677 \tabularnewline
6 & 0.089559 & 0.8775 & 0.191205 \tabularnewline
7 & 0.103226 & 1.0114 & 0.157183 \tabularnewline
8 & 0.02625 & 0.2572 & 0.398788 \tabularnewline
9 & -0.026102 & -0.2557 & 0.399346 \tabularnewline
10 & -0.046058 & -0.4513 & 0.326404 \tabularnewline
11 & 0.053041 & 0.5197 & 0.302237 \tabularnewline
12 & -0.00757 & -0.0742 & 0.470516 \tabularnewline
13 & 0.011427 & 0.112 & 0.455544 \tabularnewline
14 & -0.083418 & -0.8173 & 0.207882 \tabularnewline
15 & -0.07504 & -0.7352 & 0.231994 \tabularnewline
16 & -0.194507 & -1.9058 & 0.029836 \tabularnewline
17 & -0.181678 & -1.7801 & 0.039114 \tabularnewline
18 & -0.063461 & -0.6218 & 0.267779 \tabularnewline
19 & 0.012379 & 0.1213 & 0.451859 \tabularnewline
20 & 0.024126 & 0.2364 & 0.406818 \tabularnewline
21 & -0.121738 & -1.1928 & 0.117947 \tabularnewline
22 & -0.110727 & -1.0849 & 0.140343 \tabularnewline
23 & -0.142457 & -1.3958 & 0.082999 \tabularnewline
24 & -0.073142 & -0.7166 & 0.237668 \tabularnewline
25 & -0.01795 & -0.1759 & 0.430383 \tabularnewline
26 & 0.10371 & 1.0161 & 0.156058 \tabularnewline
27 & -0.008131 & -0.0797 & 0.468333 \tabularnewline
28 & -0.017691 & -0.1733 & 0.431377 \tabularnewline
29 & -0.075103 & -0.7359 & 0.231807 \tabularnewline
30 & 0.014318 & 0.1403 & 0.444363 \tabularnewline
31 & 0.034337 & 0.3364 & 0.36864 \tabularnewline
32 & 0.004855 & 0.0476 & 0.48108 \tabularnewline
33 & 0.048082 & 0.4711 & 0.319316 \tabularnewline
34 & 0.061921 & 0.6067 & 0.272741 \tabularnewline
35 & -0.024858 & -0.2436 & 0.404047 \tabularnewline
36 & -0.068303 & -0.6692 & 0.252477 \tabularnewline
37 & 0.015987 & 0.1566 & 0.43793 \tabularnewline
38 & 0.188156 & 1.8435 & 0.034168 \tabularnewline
39 & 0.14179 & 1.3893 & 0.083985 \tabularnewline
40 & 0.01602 & 0.157 & 0.4378 \tabularnewline
41 & -0.043958 & -0.4307 & 0.333826 \tabularnewline
42 & -0.172117 & -1.6864 & 0.047483 \tabularnewline
43 & -0.044766 & -0.4386 & 0.330964 \tabularnewline
44 & -0.009146 & -0.0896 & 0.46439 \tabularnewline
45 & 0.04002 & 0.3921 & 0.347923 \tabularnewline
46 & -0.093122 & -0.9124 & 0.18192 \tabularnewline
47 & -0.110404 & -1.0817 & 0.141041 \tabularnewline
48 & -0.006556 & -0.0642 & 0.474457 \tabularnewline
\hline
\end{tabular}
%Source: https://freestatistics.org/blog/index.php?pk=122149&T=1

[TABLE]
[ROW][C]Autocorrelation Function[/C][/ROW]
[ROW][C]Time lag k[/C][C]ACF(k)[/C][C]T-STAT[/C][C]P-value[/C][/ROW]
[ROW][C]1[/C][C]0.2747[/C][C]2.6915[/C][C]0.004196[/C][/ROW]
[ROW][C]2[/C][C]0.024816[/C][C]0.2431[/C][C]0.404205[/C][/ROW]
[ROW][C]3[/C][C]-0.138797[/C][C]-1.3599[/C][C]0.088519[/C][/ROW]
[ROW][C]4[/C][C]0.148619[/C][C]1.4562[/C][C]0.074305[/C][/ROW]
[ROW][C]5[/C][C]0.149085[/C][C]1.4607[/C][C]0.073677[/C][/ROW]
[ROW][C]6[/C][C]0.089559[/C][C]0.8775[/C][C]0.191205[/C][/ROW]
[ROW][C]7[/C][C]0.103226[/C][C]1.0114[/C][C]0.157183[/C][/ROW]
[ROW][C]8[/C][C]0.02625[/C][C]0.2572[/C][C]0.398788[/C][/ROW]
[ROW][C]9[/C][C]-0.026102[/C][C]-0.2557[/C][C]0.399346[/C][/ROW]
[ROW][C]10[/C][C]-0.046058[/C][C]-0.4513[/C][C]0.326404[/C][/ROW]
[ROW][C]11[/C][C]0.053041[/C][C]0.5197[/C][C]0.302237[/C][/ROW]
[ROW][C]12[/C][C]-0.00757[/C][C]-0.0742[/C][C]0.470516[/C][/ROW]
[ROW][C]13[/C][C]0.011427[/C][C]0.112[/C][C]0.455544[/C][/ROW]
[ROW][C]14[/C][C]-0.083418[/C][C]-0.8173[/C][C]0.207882[/C][/ROW]
[ROW][C]15[/C][C]-0.07504[/C][C]-0.7352[/C][C]0.231994[/C][/ROW]
[ROW][C]16[/C][C]-0.194507[/C][C]-1.9058[/C][C]0.029836[/C][/ROW]
[ROW][C]17[/C][C]-0.181678[/C][C]-1.7801[/C][C]0.039114[/C][/ROW]
[ROW][C]18[/C][C]-0.063461[/C][C]-0.6218[/C][C]0.267779[/C][/ROW]
[ROW][C]19[/C][C]0.012379[/C][C]0.1213[/C][C]0.451859[/C][/ROW]
[ROW][C]20[/C][C]0.024126[/C][C]0.2364[/C][C]0.406818[/C][/ROW]
[ROW][C]21[/C][C]-0.121738[/C][C]-1.1928[/C][C]0.117947[/C][/ROW]
[ROW][C]22[/C][C]-0.110727[/C][C]-1.0849[/C][C]0.140343[/C][/ROW]
[ROW][C]23[/C][C]-0.142457[/C][C]-1.3958[/C][C]0.082999[/C][/ROW]
[ROW][C]24[/C][C]-0.073142[/C][C]-0.7166[/C][C]0.237668[/C][/ROW]
[ROW][C]25[/C][C]-0.01795[/C][C]-0.1759[/C][C]0.430383[/C][/ROW]
[ROW][C]26[/C][C]0.10371[/C][C]1.0161[/C][C]0.156058[/C][/ROW]
[ROW][C]27[/C][C]-0.008131[/C][C]-0.0797[/C][C]0.468333[/C][/ROW]
[ROW][C]28[/C][C]-0.017691[/C][C]-0.1733[/C][C]0.431377[/C][/ROW]
[ROW][C]29[/C][C]-0.075103[/C][C]-0.7359[/C][C]0.231807[/C][/ROW]
[ROW][C]30[/C][C]0.014318[/C][C]0.1403[/C][C]0.444363[/C][/ROW]
[ROW][C]31[/C][C]0.034337[/C][C]0.3364[/C][C]0.36864[/C][/ROW]
[ROW][C]32[/C][C]0.004855[/C][C]0.0476[/C][C]0.48108[/C][/ROW]
[ROW][C]33[/C][C]0.048082[/C][C]0.4711[/C][C]0.319316[/C][/ROW]
[ROW][C]34[/C][C]0.061921[/C][C]0.6067[/C][C]0.272741[/C][/ROW]
[ROW][C]35[/C][C]-0.024858[/C][C]-0.2436[/C][C]0.404047[/C][/ROW]
[ROW][C]36[/C][C]-0.068303[/C][C]-0.6692[/C][C]0.252477[/C][/ROW]
[ROW][C]37[/C][C]0.015987[/C][C]0.1566[/C][C]0.43793[/C][/ROW]
[ROW][C]38[/C][C]0.188156[/C][C]1.8435[/C][C]0.034168[/C][/ROW]
[ROW][C]39[/C][C]0.14179[/C][C]1.3893[/C][C]0.083985[/C][/ROW]
[ROW][C]40[/C][C]0.01602[/C][C]0.157[/C][C]0.4378[/C][/ROW]
[ROW][C]41[/C][C]-0.043958[/C][C]-0.4307[/C][C]0.333826[/C][/ROW]
[ROW][C]42[/C][C]-0.172117[/C][C]-1.6864[/C][C]0.047483[/C][/ROW]
[ROW][C]43[/C][C]-0.044766[/C][C]-0.4386[/C][C]0.330964[/C][/ROW]
[ROW][C]44[/C][C]-0.009146[/C][C]-0.0896[/C][C]0.46439[/C][/ROW]
[ROW][C]45[/C][C]0.04002[/C][C]0.3921[/C][C]0.347923[/C][/ROW]
[ROW][C]46[/C][C]-0.093122[/C][C]-0.9124[/C][C]0.18192[/C][/ROW]
[ROW][C]47[/C][C]-0.110404[/C][C]-1.0817[/C][C]0.141041[/C][/ROW]
[ROW][C]48[/C][C]-0.006556[/C][C]-0.0642[/C][C]0.474457[/C][/ROW]
[/TABLE]
Source: https://freestatistics.org/blog/index.php?pk=122149&T=1

Globally Unique Identifier (entire table): ba.freestatistics.org/blog/index.php?pk=122149&T=1

As an alternative you can also use a QR Code:  

The GUIDs for individual cells are displayed in the table below:

Autocorrelation Function
Time lag kACF(k)T-STATP-value
10.27472.69150.004196
20.0248160.24310.404205
3-0.138797-1.35990.088519
40.1486191.45620.074305
50.1490851.46070.073677
60.0895590.87750.191205
70.1032261.01140.157183
80.026250.25720.398788
9-0.026102-0.25570.399346
10-0.046058-0.45130.326404
110.0530410.51970.302237
12-0.00757-0.07420.470516
130.0114270.1120.455544
14-0.083418-0.81730.207882
15-0.07504-0.73520.231994
16-0.194507-1.90580.029836
17-0.181678-1.78010.039114
18-0.063461-0.62180.267779
190.0123790.12130.451859
200.0241260.23640.406818
21-0.121738-1.19280.117947
22-0.110727-1.08490.140343
23-0.142457-1.39580.082999
24-0.073142-0.71660.237668
25-0.01795-0.17590.430383
260.103711.01610.156058
27-0.008131-0.07970.468333
28-0.017691-0.17330.431377
29-0.075103-0.73590.231807
300.0143180.14030.444363
310.0343370.33640.36864
320.0048550.04760.48108
330.0480820.47110.319316
340.0619210.60670.272741
35-0.024858-0.24360.404047
36-0.068303-0.66920.252477
370.0159870.15660.43793
380.1881561.84350.034168
390.141791.38930.083985
400.016020.1570.4378
41-0.043958-0.43070.333826
42-0.172117-1.68640.047483
43-0.044766-0.43860.330964
44-0.009146-0.08960.46439
450.040020.39210.347923
46-0.093122-0.91240.18192
47-0.110404-1.08170.141041
48-0.006556-0.06420.474457


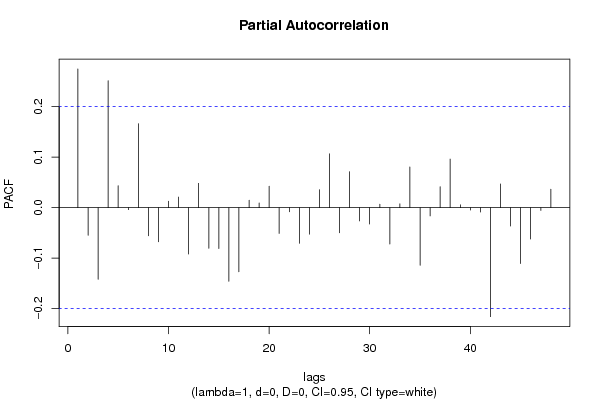
Partial Autocorrelation Function
Time lag kPACF(k)T-STATP-value
10.27472.69150.004196
2-0.054778-0.53670.296355
3-0.142054-1.39180.083594
40.2514662.46390.007762
50.0433340.42460.336044
6-0.00395-0.03870.484606
70.1662841.62920.05327
8-0.055859-0.54730.292719
9-0.0676-0.66230.254669
100.0127410.12480.450459
110.0208530.20430.41927
12-0.092014-0.90150.184776
130.0480680.4710.319367
14-0.080476-0.78850.216174
15-0.081087-0.79450.214435
16-0.145839-1.42890.078136
17-0.127024-1.24460.108159
180.0147280.14430.442781
190.0092650.09080.463927
200.042590.41730.338696
21-0.051035-0.50.309096
22-0.008329-0.08160.467565
23-0.070635-0.69210.245279
24-0.052564-0.5150.303863
250.0354930.34780.36439
260.1065771.04420.1495
27-0.049644-0.48640.313893
280.0712460.69810.243411
29-0.026244-0.25710.398813
30-0.032392-0.31740.375825
310.0067790.06640.473589
32-0.072065-0.70610.240921
330.007480.07330.470864
340.0803920.78770.216413
35-0.11406-1.11760.133274
36-0.016395-0.16060.436357
370.041440.4060.342815
380.0961780.94230.17419
390.0054770.05370.478657
40-0.004661-0.04570.481834
41-0.008658-0.08480.466287
42-0.215941-2.11580.018475
430.0470330.46080.322983
44-0.036558-0.35820.360494
45-0.110663-1.08430.140481
46-0.062313-0.61050.271472
47-0.00544-0.05330.478801
480.0365470.35810.360534

\begin{tabular}{lllllllll}
\hline
Partial Autocorrelation Function \tabularnewline
Time lag k & PACF(k) & T-STAT & P-value \tabularnewline
1 & 0.2747 & 2.6915 & 0.004196 \tabularnewline
2 & -0.054778 & -0.5367 & 0.296355 \tabularnewline
3 & -0.142054 & -1.3918 & 0.083594 \tabularnewline
4 & 0.251466 & 2.4639 & 0.007762 \tabularnewline
5 & 0.043334 & 0.4246 & 0.336044 \tabularnewline
6 & -0.00395 & -0.0387 & 0.484606 \tabularnewline
7 & 0.166284 & 1.6292 & 0.05327 \tabularnewline
8 & -0.055859 & -0.5473 & 0.292719 \tabularnewline
9 & -0.0676 & -0.6623 & 0.254669 \tabularnewline
10 & 0.012741 & 0.1248 & 0.450459 \tabularnewline
11 & 0.020853 & 0.2043 & 0.41927 \tabularnewline
12 & -0.092014 & -0.9015 & 0.184776 \tabularnewline
13 & 0.048068 & 0.471 & 0.319367 \tabularnewline
14 & -0.080476 & -0.7885 & 0.216174 \tabularnewline
15 & -0.081087 & -0.7945 & 0.214435 \tabularnewline
16 & -0.145839 & -1.4289 & 0.078136 \tabularnewline
17 & -0.127024 & -1.2446 & 0.108159 \tabularnewline
18 & 0.014728 & 0.1443 & 0.442781 \tabularnewline
19 & 0.009265 & 0.0908 & 0.463927 \tabularnewline
20 & 0.04259 & 0.4173 & 0.338696 \tabularnewline
21 & -0.051035 & -0.5 & 0.309096 \tabularnewline
22 & -0.008329 & -0.0816 & 0.467565 \tabularnewline
23 & -0.070635 & -0.6921 & 0.245279 \tabularnewline
24 & -0.052564 & -0.515 & 0.303863 \tabularnewline
25 & 0.035493 & 0.3478 & 0.36439 \tabularnewline
26 & 0.106577 & 1.0442 & 0.1495 \tabularnewline
27 & -0.049644 & -0.4864 & 0.313893 \tabularnewline
28 & 0.071246 & 0.6981 & 0.243411 \tabularnewline
29 & -0.026244 & -0.2571 & 0.398813 \tabularnewline
30 & -0.032392 & -0.3174 & 0.375825 \tabularnewline
31 & 0.006779 & 0.0664 & 0.473589 \tabularnewline
32 & -0.072065 & -0.7061 & 0.240921 \tabularnewline
33 & 0.00748 & 0.0733 & 0.470864 \tabularnewline
34 & 0.080392 & 0.7877 & 0.216413 \tabularnewline
35 & -0.11406 & -1.1176 & 0.133274 \tabularnewline
36 & -0.016395 & -0.1606 & 0.436357 \tabularnewline
37 & 0.04144 & 0.406 & 0.342815 \tabularnewline
38 & 0.096178 & 0.9423 & 0.17419 \tabularnewline
39 & 0.005477 & 0.0537 & 0.478657 \tabularnewline
40 & -0.004661 & -0.0457 & 0.481834 \tabularnewline
41 & -0.008658 & -0.0848 & 0.466287 \tabularnewline
42 & -0.215941 & -2.1158 & 0.018475 \tabularnewline
43 & 0.047033 & 0.4608 & 0.322983 \tabularnewline
44 & -0.036558 & -0.3582 & 0.360494 \tabularnewline
45 & -0.110663 & -1.0843 & 0.140481 \tabularnewline
46 & -0.062313 & -0.6105 & 0.271472 \tabularnewline
47 & -0.00544 & -0.0533 & 0.478801 \tabularnewline
48 & 0.036547 & 0.3581 & 0.360534 \tabularnewline
\hline
\end{tabular}
%Source: https://freestatistics.org/blog/index.php?pk=122149&T=2

[TABLE]
[ROW][C]Partial Autocorrelation Function[/C][/ROW]
[ROW][C]Time lag k[/C][C]PACF(k)[/C][C]T-STAT[/C][C]P-value[/C][/ROW]
[ROW][C]1[/C][C]0.2747[/C][C]2.6915[/C][C]0.004196[/C][/ROW]
[ROW][C]2[/C][C]-0.054778[/C][C]-0.5367[/C][C]0.296355[/C][/ROW]
[ROW][C]3[/C][C]-0.142054[/C][C]-1.3918[/C][C]0.083594[/C][/ROW]
[ROW][C]4[/C][C]0.251466[/C][C]2.4639[/C][C]0.007762[/C][/ROW]
[ROW][C]5[/C][C]0.043334[/C][C]0.4246[/C][C]0.336044[/C][/ROW]
[ROW][C]6[/C][C]-0.00395[/C][C]-0.0387[/C][C]0.484606[/C][/ROW]
[ROW][C]7[/C][C]0.166284[/C][C]1.6292[/C][C]0.05327[/C][/ROW]
[ROW][C]8[/C][C]-0.055859[/C][C]-0.5473[/C][C]0.292719[/C][/ROW]
[ROW][C]9[/C][C]-0.0676[/C][C]-0.6623[/C][C]0.254669[/C][/ROW]
[ROW][C]10[/C][C]0.012741[/C][C]0.1248[/C][C]0.450459[/C][/ROW]
[ROW][C]11[/C][C]0.020853[/C][C]0.2043[/C][C]0.41927[/C][/ROW]
[ROW][C]12[/C][C]-0.092014[/C][C]-0.9015[/C][C]0.184776[/C][/ROW]
[ROW][C]13[/C][C]0.048068[/C][C]0.471[/C][C]0.319367[/C][/ROW]
[ROW][C]14[/C][C]-0.080476[/C][C]-0.7885[/C][C]0.216174[/C][/ROW]
[ROW][C]15[/C][C]-0.081087[/C][C]-0.7945[/C][C]0.214435[/C][/ROW]
[ROW][C]16[/C][C]-0.145839[/C][C]-1.4289[/C][C]0.078136[/C][/ROW]
[ROW][C]17[/C][C]-0.127024[/C][C]-1.2446[/C][C]0.108159[/C][/ROW]
[ROW][C]18[/C][C]0.014728[/C][C]0.1443[/C][C]0.442781[/C][/ROW]
[ROW][C]19[/C][C]0.009265[/C][C]0.0908[/C][C]0.463927[/C][/ROW]
[ROW][C]20[/C][C]0.04259[/C][C]0.4173[/C][C]0.338696[/C][/ROW]
[ROW][C]21[/C][C]-0.051035[/C][C]-0.5[/C][C]0.309096[/C][/ROW]
[ROW][C]22[/C][C]-0.008329[/C][C]-0.0816[/C][C]0.467565[/C][/ROW]
[ROW][C]23[/C][C]-0.070635[/C][C]-0.6921[/C][C]0.245279[/C][/ROW]
[ROW][C]24[/C][C]-0.052564[/C][C]-0.515[/C][C]0.303863[/C][/ROW]
[ROW][C]25[/C][C]0.035493[/C][C]0.3478[/C][C]0.36439[/C][/ROW]
[ROW][C]26[/C][C]0.106577[/C][C]1.0442[/C][C]0.1495[/C][/ROW]
[ROW][C]27[/C][C]-0.049644[/C][C]-0.4864[/C][C]0.313893[/C][/ROW]
[ROW][C]28[/C][C]0.071246[/C][C]0.6981[/C][C]0.243411[/C][/ROW]
[ROW][C]29[/C][C]-0.026244[/C][C]-0.2571[/C][C]0.398813[/C][/ROW]
[ROW][C]30[/C][C]-0.032392[/C][C]-0.3174[/C][C]0.375825[/C][/ROW]
[ROW][C]31[/C][C]0.006779[/C][C]0.0664[/C][C]0.473589[/C][/ROW]
[ROW][C]32[/C][C]-0.072065[/C][C]-0.7061[/C][C]0.240921[/C][/ROW]
[ROW][C]33[/C][C]0.00748[/C][C]0.0733[/C][C]0.470864[/C][/ROW]
[ROW][C]34[/C][C]0.080392[/C][C]0.7877[/C][C]0.216413[/C][/ROW]
[ROW][C]35[/C][C]-0.11406[/C][C]-1.1176[/C][C]0.133274[/C][/ROW]
[ROW][C]36[/C][C]-0.016395[/C][C]-0.1606[/C][C]0.436357[/C][/ROW]
[ROW][C]37[/C][C]0.04144[/C][C]0.406[/C][C]0.342815[/C][/ROW]
[ROW][C]38[/C][C]0.096178[/C][C]0.9423[/C][C]0.17419[/C][/ROW]
[ROW][C]39[/C][C]0.005477[/C][C]0.0537[/C][C]0.478657[/C][/ROW]
[ROW][C]40[/C][C]-0.004661[/C][C]-0.0457[/C][C]0.481834[/C][/ROW]
[ROW][C]41[/C][C]-0.008658[/C][C]-0.0848[/C][C]0.466287[/C][/ROW]
[ROW][C]42[/C][C]-0.215941[/C][C]-2.1158[/C][C]0.018475[/C][/ROW]
[ROW][C]43[/C][C]0.047033[/C][C]0.4608[/C][C]0.322983[/C][/ROW]
[ROW][C]44[/C][C]-0.036558[/C][C]-0.3582[/C][C]0.360494[/C][/ROW]
[ROW][C]45[/C][C]-0.110663[/C][C]-1.0843[/C][C]0.140481[/C][/ROW]
[ROW][C]46[/C][C]-0.062313[/C][C]-0.6105[/C][C]0.271472[/C][/ROW]
[ROW][C]47[/C][C]-0.00544[/C][C]-0.0533[/C][C]0.478801[/C][/ROW]
[ROW][C]48[/C][C]0.036547[/C][C]0.3581[/C][C]0.360534[/C][/ROW]
[/TABLE]
Source: https://freestatistics.org/blog/index.php?pk=122149&T=2

Globally Unique Identifier (entire table): ba.freestatistics.org/blog/index.php?pk=122149&T=2

As an alternative you can also use a QR Code:  

The GUIDs for individual cells are displayed in the table below:

Partial Autocorrelation Function
Time lag kPACF(k)T-STATP-value
10.27472.69150.004196
2-0.054778-0.53670.296355
3-0.142054-1.39180.083594
40.2514662.46390.007762
50.0433340.42460.336044
6-0.00395-0.03870.484606
70.1662841.62920.05327
8-0.055859-0.54730.292719
9-0.0676-0.66230.254669
100.0127410.12480.450459
110.0208530.20430.41927
12-0.092014-0.90150.184776
130.0480680.4710.319367
14-0.080476-0.78850.216174
15-0.081087-0.79450.214435
16-0.145839-1.42890.078136
17-0.127024-1.24460.108159
180.0147280.14430.442781
190.0092650.09080.463927
200.042590.41730.338696
21-0.051035-0.50.309096
22-0.008329-0.08160.467565
23-0.070635-0.69210.245279
24-0.052564-0.5150.303863
250.0354930.34780.36439
260.1065771.04420.1495
27-0.049644-0.48640.313893
280.0712460.69810.243411
29-0.026244-0.25710.398813
30-0.032392-0.31740.375825
310.0067790.06640.473589
32-0.072065-0.70610.240921
330.007480.07330.470864
340.0803920.78770.216413
35-0.11406-1.11760.133274
36-0.016395-0.16060.436357
370.041440.4060.342815
380.0961780.94230.17419
390.0054770.05370.478657
40-0.004661-0.04570.481834
41-0.008658-0.08480.466287
42-0.215941-2.11580.018475
430.0470330.46080.322983
44-0.036558-0.35820.360494
45-0.110663-1.08430.140481
46-0.062313-0.61050.271472
47-0.00544-0.05330.478801
480.0365470.35810.360534


Parameters (Session):
par1 = Studio 100 PRIJS 2005 ; par2 = Studio 100 PRIJS 2005 ; par3 = Studio 100 PRIJS 2005 ; par4 = 12 ;
Parameters (R input):
par1 = 48 ; par2 = 1 ; par3 = 0 ; par4 = 0 ; par5 = 12 ; par6 = White Noise ; par7 = 0.95 ; par8 = ;
R code (references can be found in the software module):
if (par1 == 'Default') {
par1 = 10*log10(length(x))
} else {
par1 <- as.numeric(par1)
}
par2 <- as.numeric(par2)
par3 <- as.numeric(par3)
par4 <- as.numeric(par4)
par5 <- as.numeric(par5)
if (par6 == 'White Noise') par6 <- 'white' else par6 <- 'ma'
par7 <- as.numeric(par7)
if (par8 != '') par8 <- as.numeric(par8)
ox <- x
if (par8 == '') {
if (par2 == 0) {
x <- log(x)
} else {
x <- (x ^ par2 - 1) / par2
}
} else {
x <- log(x,base=par8)
}
if (par3 > 0) x <- diff(x,lag=1,difference=par3)
if (par4 > 0) x <- diff(x,lag=par5,difference=par4)
bitmap(file='picts.png')
op <- par(mfrow=c(2,1))
plot(ox,type='l',main='Original Time Series',xlab='time',ylab='value')
if (par8=='') {
mytitle <- paste('Working Time Series (lambda=',par2,', d=',par3,', D=',par4,')',sep='')
mysub <- paste('(lambda=',par2,', d=',par3,', D=',par4,', CI=', par7, ', CI type=',par6,')',sep='')
} else {
mytitle <- paste('Working Time Series (base=',par8,', d=',par3,', D=',par4,')',sep='')
mysub <- paste('(base=',par8,', d=',par3,', D=',par4,', CI=', par7, ', CI type=',par6,')',sep='')
}
plot(x,type='l', main=mytitle,xlab='time',ylab='value')
par(op)
dev.off()
bitmap(file='pic1.png')
racf <- acf(x, par1, main='Autocorrelation', xlab='time lag', ylab='ACF', ci.type=par6, ci=par7, sub=mysub)
dev.off()
bitmap(file='pic2.png')
rpacf <- pacf(x,par1,main='Partial Autocorrelation',xlab='lags',ylab='PACF',sub=mysub)
dev.off()
(myacf <- c(racf$acf))
(mypacf <- c(rpacf$acf))
lengthx <- length(x)
sqrtn <- sqrt(lengthx)
load(file='createtable')
a<-table.start()
a<-table.row.start(a)
a<-table.element(a,'Autocorrelation Function',4,TRUE)
a<-table.row.end(a)
a<-table.row.start(a)
a<-table.element(a,'Time lag k',header=TRUE)
a<-table.element(a,hyperlink('basics.htm','ACF(k)','click here for more information about the Autocorrelation Function'),header=TRUE)
a<-table.element(a,'T-STAT',header=TRUE)
a<-table.element(a,'P-value',header=TRUE)
a<-table.row.end(a)
for (i in 2:(par1+1)) {
a<-table.row.start(a)
a<-table.element(a,i-1,header=TRUE)
a<-table.element(a,round(myacf[i],6))
mytstat <- myacf[i]*sqrtn
a<-table.element(a,round(mytstat,4))
a<-table.element(a,round(1-pt(abs(mytstat),lengthx),6))
a<-table.row.end(a)
}
a<-table.end(a)
table.save(a,file='mytable.tab')
a<-table.start()
a<-table.row.start(a)
a<-table.element(a,'Partial Autocorrelation Function',4,TRUE)
a<-table.row.end(a)
a<-table.row.start(a)
a<-table.element(a,'Time lag k',header=TRUE)
a<-table.element(a,hyperlink('basics.htm','PACF(k)','click here for more information about the Partial Autocorrelation Function'),header=TRUE)
a<-table.element(a,'T-STAT',header=TRUE)
a<-table.element(a,'P-value',header=TRUE)
a<-table.row.end(a)
for (i in 1:par1) {
a<-table.row.start(a)
a<-table.element(a,i,header=TRUE)
a<-table.element(a,round(mypacf[i],6))
mytstat <- mypacf[i]*sqrtn
a<-table.element(a,round(mytstat,4))
a<-table.element(a,round(1-pt(abs(mytstat),lengthx),6))
a<-table.row.end(a)
}
a<-table.end(a)
table.save(a,file='mytable1.tab')