Free Statistics

of Irreproducible Research!

Author's title

Author*Unverified author*
R Software Modulerwasp_autocorrelation.wasp
Title produced by software(Partial) Autocorrelation Function
Date of computationThu, 19 May 2011 17:05:30 +0000
Cite this page as followsStatistical Computations at FreeStatistics.org, Office for Research Development and Education, URL https://freestatistics.org/blog/index.php?v=date/2011/May/19/t1305824480qv7s0xjxlyd0h84.htm/, Retrieved Sun, 12 May 2024 04:47:50 +0000
Statistical Computations at FreeStatistics.org, Office for Research Development and Education, URL https://freestatistics.org/blog/index.php?pk=122148, Retrieved Sun, 12 May 2024 04:47:50 +0000
QR Codes:

Original text written by user:
IsPrivate?No (this computation is public)
User-defined keywordsKDGP2W12
Estimated Impact80
Family? (F = Feedback message, R = changed R code, M = changed R Module, P = changed Parameters, D = changed Data)
-       [(Partial) Autocorrelation Function] [] [2011-05-19 17:05:30] [164acd287bf1b95108b808ea4c161e74] [Current]
Feedback Forum

Post a new message
Dataseries X:
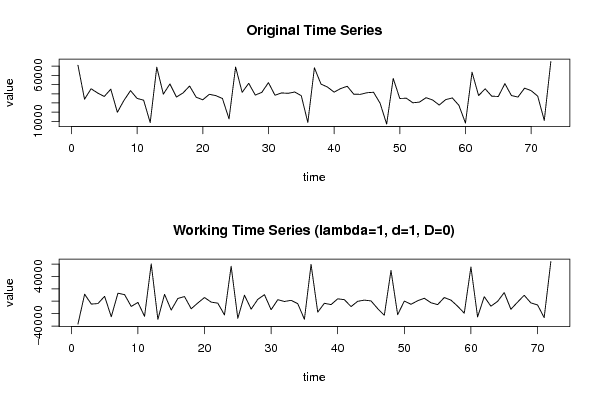
70938
34077
45409
40809
37013
44953
19848
32745
43412
34931
33008
8620
68906
39556
50669
36432
40891
48428
36222
33425
39401
37967
34801
12657
69116
41519
51321
38529
41547
52073
38401
40898
40439
41888
37898
8771
68184
50530
47221
41756
45633
48138
39486
39341
41117
41629
29722
7054
56676
34870
35117
30169
30936
35699
33228
27733
33666
35429
27438
8170
63410
38040
45389
37353
37024
50957
37994
36454
46080
43373
37395
10963
75001


Summary of computational transaction
Raw Inputview raw input (R code)
Raw Outputview raw output of R engine
Computing time1 seconds
R Server'Herman Ole Andreas Wold' @ www.yougetit.org

\begin{tabular}{lllllllll}
\hline
Summary of computational transaction \tabularnewline
Raw Input & view raw input (R code)  \tabularnewline
Raw Output & view raw output of R engine  \tabularnewline
Computing time & 1 seconds \tabularnewline
R Server & 'Herman Ole Andreas Wold' @ www.yougetit.org \tabularnewline
\hline
\end{tabular}
%Source: https://freestatistics.org/blog/index.php?pk=122148&T=0

[TABLE]
[ROW][C]Summary of computational transaction[/C][/ROW]
[ROW][C]Raw Input[/C][C]view raw input (R code) [/C][/ROW]
[ROW][C]Raw Output[/C][C]view raw output of R engine [/C][/ROW]
[ROW][C]Computing time[/C][C]1 seconds[/C][/ROW]
[ROW][C]R Server[/C][C]'Herman Ole Andreas Wold' @ www.yougetit.org[/C][/ROW]
[/TABLE]
Source: https://freestatistics.org/blog/index.php?pk=122148&T=0

Globally Unique Identifier (entire table): ba.freestatistics.org/blog/index.php?pk=122148&T=0

As an alternative you can also use a QR Code:  

The GUIDs for individual cells are displayed in the table below:

Summary of computational transaction
Raw Inputview raw input (R code)
Raw Outputview raw output of R engine
Computing time1 seconds
R Server'Herman Ole Andreas Wold' @ www.yougetit.org


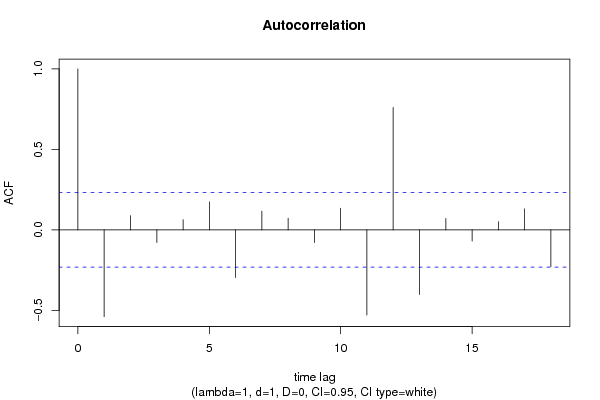
Autocorrelation Function
Time lag kACF(k)T-STATP-value
1-0.539401-4.5771e-05
20.0877520.74460.229469
3-0.07815-0.66310.254685
40.0626590.53170.298293
50.1740711.4770.072012
6-0.296166-2.51310.007104
70.1162890.98670.163536
80.0724680.61490.270277
9-0.078515-0.66620.2537
100.1348721.14440.128119
11-0.528705-4.48621.3e-05
120.7609796.45710
13-0.401372-3.40580.000541
140.0706490.59950.27537
15-0.069081-0.58620.279797
160.0507330.43050.334063
170.1305551.10780.135818
18-0.228488-1.93880.028224

\begin{tabular}{lllllllll}
\hline
Autocorrelation Function \tabularnewline
Time lag k & ACF(k) & T-STAT & P-value \tabularnewline
1 & -0.539401 & -4.577 & 1e-05 \tabularnewline
2 & 0.087752 & 0.7446 & 0.229469 \tabularnewline
3 & -0.07815 & -0.6631 & 0.254685 \tabularnewline
4 & 0.062659 & 0.5317 & 0.298293 \tabularnewline
5 & 0.174071 & 1.477 & 0.072012 \tabularnewline
6 & -0.296166 & -2.5131 & 0.007104 \tabularnewline
7 & 0.116289 & 0.9867 & 0.163536 \tabularnewline
8 & 0.072468 & 0.6149 & 0.270277 \tabularnewline
9 & -0.078515 & -0.6662 & 0.2537 \tabularnewline
10 & 0.134872 & 1.1444 & 0.128119 \tabularnewline
11 & -0.528705 & -4.4862 & 1.3e-05 \tabularnewline
12 & 0.760979 & 6.4571 & 0 \tabularnewline
13 & -0.401372 & -3.4058 & 0.000541 \tabularnewline
14 & 0.070649 & 0.5995 & 0.27537 \tabularnewline
15 & -0.069081 & -0.5862 & 0.279797 \tabularnewline
16 & 0.050733 & 0.4305 & 0.334063 \tabularnewline
17 & 0.130555 & 1.1078 & 0.135818 \tabularnewline
18 & -0.228488 & -1.9388 & 0.028224 \tabularnewline
\hline
\end{tabular}
%Source: https://freestatistics.org/blog/index.php?pk=122148&T=1

[TABLE]
[ROW][C]Autocorrelation Function[/C][/ROW]
[ROW][C]Time lag k[/C][C]ACF(k)[/C][C]T-STAT[/C][C]P-value[/C][/ROW]
[ROW][C]1[/C][C]-0.539401[/C][C]-4.577[/C][C]1e-05[/C][/ROW]
[ROW][C]2[/C][C]0.087752[/C][C]0.7446[/C][C]0.229469[/C][/ROW]
[ROW][C]3[/C][C]-0.07815[/C][C]-0.6631[/C][C]0.254685[/C][/ROW]
[ROW][C]4[/C][C]0.062659[/C][C]0.5317[/C][C]0.298293[/C][/ROW]
[ROW][C]5[/C][C]0.174071[/C][C]1.477[/C][C]0.072012[/C][/ROW]
[ROW][C]6[/C][C]-0.296166[/C][C]-2.5131[/C][C]0.007104[/C][/ROW]
[ROW][C]7[/C][C]0.116289[/C][C]0.9867[/C][C]0.163536[/C][/ROW]
[ROW][C]8[/C][C]0.072468[/C][C]0.6149[/C][C]0.270277[/C][/ROW]
[ROW][C]9[/C][C]-0.078515[/C][C]-0.6662[/C][C]0.2537[/C][/ROW]
[ROW][C]10[/C][C]0.134872[/C][C]1.1444[/C][C]0.128119[/C][/ROW]
[ROW][C]11[/C][C]-0.528705[/C][C]-4.4862[/C][C]1.3e-05[/C][/ROW]
[ROW][C]12[/C][C]0.760979[/C][C]6.4571[/C][C]0[/C][/ROW]
[ROW][C]13[/C][C]-0.401372[/C][C]-3.4058[/C][C]0.000541[/C][/ROW]
[ROW][C]14[/C][C]0.070649[/C][C]0.5995[/C][C]0.27537[/C][/ROW]
[ROW][C]15[/C][C]-0.069081[/C][C]-0.5862[/C][C]0.279797[/C][/ROW]
[ROW][C]16[/C][C]0.050733[/C][C]0.4305[/C][C]0.334063[/C][/ROW]
[ROW][C]17[/C][C]0.130555[/C][C]1.1078[/C][C]0.135818[/C][/ROW]
[ROW][C]18[/C][C]-0.228488[/C][C]-1.9388[/C][C]0.028224[/C][/ROW]
[/TABLE]
Source: https://freestatistics.org/blog/index.php?pk=122148&T=1

Globally Unique Identifier (entire table): ba.freestatistics.org/blog/index.php?pk=122148&T=1

As an alternative you can also use a QR Code:  

The GUIDs for individual cells are displayed in the table below:

Autocorrelation Function
Time lag kACF(k)T-STATP-value
1-0.539401-4.5771e-05
20.0877520.74460.229469
3-0.07815-0.66310.254685
40.0626590.53170.298293
50.1740711.4770.072012
6-0.296166-2.51310.007104
70.1162890.98670.163536
80.0724680.61490.270277
9-0.078515-0.66620.2537
100.1348721.14440.128119
11-0.528705-4.48621.3e-05
120.7609796.45710
13-0.401372-3.40580.000541
140.0706490.59950.27537
15-0.069081-0.58620.279797
160.0507330.43050.334063
170.1305551.10780.135818
18-0.228488-1.93880.028224


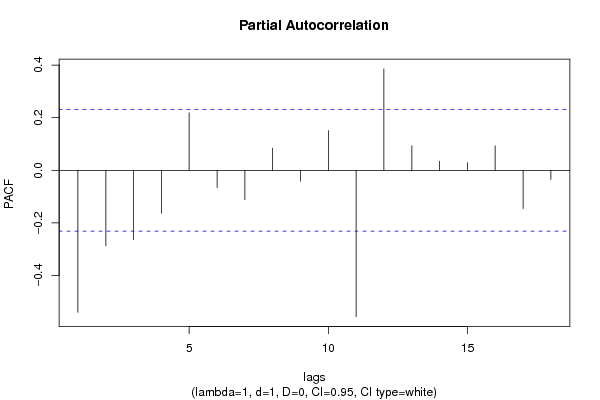
Partial Autocorrelation Function
Time lag kPACF(k)T-STATP-value
1-0.539401-4.5771e-05
2-0.286584-2.43170.008758
3-0.264032-2.24040.014076
4-0.16299-1.3830.085467
50.2181241.85080.034147
6-0.065374-0.55470.290403
7-0.112057-0.95080.172433
80.084240.71480.238522
9-0.041235-0.34990.36372
100.1508771.28020.102286
11-0.555946-4.71746e-06
120.3849983.26680.000834
130.0929030.78830.216552
140.0346790.29430.384701
150.0285580.24230.404611
160.0929140.78840.216526
17-0.144874-1.22930.111482
18-0.03462-0.29380.384892

\begin{tabular}{lllllllll}
\hline
Partial Autocorrelation Function \tabularnewline
Time lag k & PACF(k) & T-STAT & P-value \tabularnewline
1 & -0.539401 & -4.577 & 1e-05 \tabularnewline
2 & -0.286584 & -2.4317 & 0.008758 \tabularnewline
3 & -0.264032 & -2.2404 & 0.014076 \tabularnewline
4 & -0.16299 & -1.383 & 0.085467 \tabularnewline
5 & 0.218124 & 1.8508 & 0.034147 \tabularnewline
6 & -0.065374 & -0.5547 & 0.290403 \tabularnewline
7 & -0.112057 & -0.9508 & 0.172433 \tabularnewline
8 & 0.08424 & 0.7148 & 0.238522 \tabularnewline
9 & -0.041235 & -0.3499 & 0.36372 \tabularnewline
10 & 0.150877 & 1.2802 & 0.102286 \tabularnewline
11 & -0.555946 & -4.7174 & 6e-06 \tabularnewline
12 & 0.384998 & 3.2668 & 0.000834 \tabularnewline
13 & 0.092903 & 0.7883 & 0.216552 \tabularnewline
14 & 0.034679 & 0.2943 & 0.384701 \tabularnewline
15 & 0.028558 & 0.2423 & 0.404611 \tabularnewline
16 & 0.092914 & 0.7884 & 0.216526 \tabularnewline
17 & -0.144874 & -1.2293 & 0.111482 \tabularnewline
18 & -0.03462 & -0.2938 & 0.384892 \tabularnewline
\hline
\end{tabular}
%Source: https://freestatistics.org/blog/index.php?pk=122148&T=2

[TABLE]
[ROW][C]Partial Autocorrelation Function[/C][/ROW]
[ROW][C]Time lag k[/C][C]PACF(k)[/C][C]T-STAT[/C][C]P-value[/C][/ROW]
[ROW][C]1[/C][C]-0.539401[/C][C]-4.577[/C][C]1e-05[/C][/ROW]
[ROW][C]2[/C][C]-0.286584[/C][C]-2.4317[/C][C]0.008758[/C][/ROW]
[ROW][C]3[/C][C]-0.264032[/C][C]-2.2404[/C][C]0.014076[/C][/ROW]
[ROW][C]4[/C][C]-0.16299[/C][C]-1.383[/C][C]0.085467[/C][/ROW]
[ROW][C]5[/C][C]0.218124[/C][C]1.8508[/C][C]0.034147[/C][/ROW]
[ROW][C]6[/C][C]-0.065374[/C][C]-0.5547[/C][C]0.290403[/C][/ROW]
[ROW][C]7[/C][C]-0.112057[/C][C]-0.9508[/C][C]0.172433[/C][/ROW]
[ROW][C]8[/C][C]0.08424[/C][C]0.7148[/C][C]0.238522[/C][/ROW]
[ROW][C]9[/C][C]-0.041235[/C][C]-0.3499[/C][C]0.36372[/C][/ROW]
[ROW][C]10[/C][C]0.150877[/C][C]1.2802[/C][C]0.102286[/C][/ROW]
[ROW][C]11[/C][C]-0.555946[/C][C]-4.7174[/C][C]6e-06[/C][/ROW]
[ROW][C]12[/C][C]0.384998[/C][C]3.2668[/C][C]0.000834[/C][/ROW]
[ROW][C]13[/C][C]0.092903[/C][C]0.7883[/C][C]0.216552[/C][/ROW]
[ROW][C]14[/C][C]0.034679[/C][C]0.2943[/C][C]0.384701[/C][/ROW]
[ROW][C]15[/C][C]0.028558[/C][C]0.2423[/C][C]0.404611[/C][/ROW]
[ROW][C]16[/C][C]0.092914[/C][C]0.7884[/C][C]0.216526[/C][/ROW]
[ROW][C]17[/C][C]-0.144874[/C][C]-1.2293[/C][C]0.111482[/C][/ROW]
[ROW][C]18[/C][C]-0.03462[/C][C]-0.2938[/C][C]0.384892[/C][/ROW]
[/TABLE]
Source: https://freestatistics.org/blog/index.php?pk=122148&T=2

Globally Unique Identifier (entire table): ba.freestatistics.org/blog/index.php?pk=122148&T=2

As an alternative you can also use a QR Code:  

The GUIDs for individual cells are displayed in the table below:

Partial Autocorrelation Function
Time lag kPACF(k)T-STATP-value
1-0.539401-4.5771e-05
2-0.286584-2.43170.008758
3-0.264032-2.24040.014076
4-0.16299-1.3830.085467
50.2181241.85080.034147
6-0.065374-0.55470.290403
7-0.112057-0.95080.172433
80.084240.71480.238522
9-0.041235-0.34990.36372
100.1508771.28020.102286
11-0.555946-4.71746e-06
120.3849983.26680.000834
130.0929030.78830.216552
140.0346790.29430.384701
150.0285580.24230.404611
160.0929140.78840.216526
17-0.144874-1.22930.111482
18-0.03462-0.29380.384892


Parameters (Session):
par1 = Default ; par2 = 1 ; par3 = 1 ; par4 = 0 ; par5 = 12 ; par6 = White Noise ; par7 = 0.95 ;
Parameters (R input):
par1 = Default ; par2 = 1 ; par3 = 1 ; par4 = 0 ; par5 = 12 ; par6 = White Noise ; par7 = 0.95 ; par8 = ;
R code (references can be found in the software module):
if (par1 == 'Default') {
par1 = 10*log10(length(x))
} else {
par1 <- as.numeric(par1)
}
par2 <- as.numeric(par2)
par3 <- as.numeric(par3)
par4 <- as.numeric(par4)
par5 <- as.numeric(par5)
if (par6 == 'White Noise') par6 <- 'white' else par6 <- 'ma'
par7 <- as.numeric(par7)
if (par8 != '') par8 <- as.numeric(par8)
ox <- x
if (par8 == '') {
if (par2 == 0) {
x <- log(x)
} else {
x <- (x ^ par2 - 1) / par2
}
} else {
x <- log(x,base=par8)
}
if (par3 > 0) x <- diff(x,lag=1,difference=par3)
if (par4 > 0) x <- diff(x,lag=par5,difference=par4)
bitmap(file='picts.png')
op <- par(mfrow=c(2,1))
plot(ox,type='l',main='Original Time Series',xlab='time',ylab='value')
if (par8=='') {
mytitle <- paste('Working Time Series (lambda=',par2,', d=',par3,', D=',par4,')',sep='')
mysub <- paste('(lambda=',par2,', d=',par3,', D=',par4,', CI=', par7, ', CI type=',par6,')',sep='')
} else {
mytitle <- paste('Working Time Series (base=',par8,', d=',par3,', D=',par4,')',sep='')
mysub <- paste('(base=',par8,', d=',par3,', D=',par4,', CI=', par7, ', CI type=',par6,')',sep='')
}
plot(x,type='l', main=mytitle,xlab='time',ylab='value')
par(op)
dev.off()
bitmap(file='pic1.png')
racf <- acf(x, par1, main='Autocorrelation', xlab='time lag', ylab='ACF', ci.type=par6, ci=par7, sub=mysub)
dev.off()
bitmap(file='pic2.png')
rpacf <- pacf(x,par1,main='Partial Autocorrelation',xlab='lags',ylab='PACF',sub=mysub)
dev.off()
(myacf <- c(racf$acf))
(mypacf <- c(rpacf$acf))
lengthx <- length(x)
sqrtn <- sqrt(lengthx)
load(file='createtable')
a<-table.start()
a<-table.row.start(a)
a<-table.element(a,'Autocorrelation Function',4,TRUE)
a<-table.row.end(a)
a<-table.row.start(a)
a<-table.element(a,'Time lag k',header=TRUE)
a<-table.element(a,hyperlink('basics.htm','ACF(k)','click here for more information about the Autocorrelation Function'),header=TRUE)
a<-table.element(a,'T-STAT',header=TRUE)
a<-table.element(a,'P-value',header=TRUE)
a<-table.row.end(a)
for (i in 2:(par1+1)) {
a<-table.row.start(a)
a<-table.element(a,i-1,header=TRUE)
a<-table.element(a,round(myacf[i],6))
mytstat <- myacf[i]*sqrtn
a<-table.element(a,round(mytstat,4))
a<-table.element(a,round(1-pt(abs(mytstat),lengthx),6))
a<-table.row.end(a)
}
a<-table.end(a)
table.save(a,file='mytable.tab')
a<-table.start()
a<-table.row.start(a)
a<-table.element(a,'Partial Autocorrelation Function',4,TRUE)
a<-table.row.end(a)
a<-table.row.start(a)
a<-table.element(a,'Time lag k',header=TRUE)
a<-table.element(a,hyperlink('basics.htm','PACF(k)','click here for more information about the Partial Autocorrelation Function'),header=TRUE)
a<-table.element(a,'T-STAT',header=TRUE)
a<-table.element(a,'P-value',header=TRUE)
a<-table.row.end(a)
for (i in 1:par1) {
a<-table.row.start(a)
a<-table.element(a,i,header=TRUE)
a<-table.element(a,round(mypacf[i],6))
mytstat <- mypacf[i]*sqrtn
a<-table.element(a,round(mytstat,4))
a<-table.element(a,round(1-pt(abs(mytstat),lengthx),6))
a<-table.row.end(a)
}
a<-table.end(a)
table.save(a,file='mytable1.tab')