Free Statistics

of Irreproducible Research!

Author's title

Opdracht 10 - eigen cijferreeks evolutie geboorten is België - Sophie Van ...

Author*Unverified author*
R Software Modulerwasp_exponentialsmoothing.wasp
Title produced by softwareExponential Smoothing
Date of computationThu, 19 May 2011 16:09:42 +0000
Cite this page as followsStatistical Computations at FreeStatistics.org, Office for Research Development and Education, URL https://freestatistics.org/blog/index.php?v=date/2011/May/19/t13058212504y3jlm3i53crmhq.htm/, Retrieved Sat, 11 May 2024 19:56:44 +0000
Statistical Computations at FreeStatistics.org, Office for Research Development and Education, URL https://freestatistics.org/blog/index.php?pk=122118, Retrieved Sat, 11 May 2024 19:56:44 +0000
QR Codes:

Original text written by user:
IsPrivate?No (this computation is public)
User-defined keywordsKDGP2W102
Estimated Impact94
Family? (F = Feedback message, R = changed R code, M = changed R Module, P = changed Parameters, D = changed Data)
-       [Exponential Smoothing] [Opdracht 10 - eig...] [2011-05-19 16:09:42] [d41d8cd98f00b204e9800998ecf8427e] [Current]
Feedback Forum

Post a new message
Dataseries X:
126.304
125.511
125.495
130.133
126.257
110.323
98.417
105.749
120.665
124.075
127.245
146.731
144.979
148.210
144.670
142.970
142.524
146.142
146.522
148.128
148.798
150.181
152.388
155.694
160.662
155.520
158.262
154.338
158.196
160.371
154.856
150.636
145.899
141.242
140.834
141.119
139.104
134.437
129.425
123.155
119.273
120.472
121.523
121.983
123.658
124.794
124.827
120.382
117.395
115.790
114.283
117.271
117.448
118.764
120.550
123.554
125.412
124.182
119.828
115.361
114.226
115.214
115.864
114.276
113.469
114.883
114.172
111.225
112.149
115.618
118.002
121.382
120.663


Summary of computational transaction
Raw Inputview raw input (R code)
Raw Outputview raw output of R engine
Computing time2 seconds
R Server'Sir Ronald Aylmer Fisher' @ 193.190.124.24

\begin{tabular}{lllllllll}
\hline
Summary of computational transaction \tabularnewline
Raw Input & view raw input (R code)  \tabularnewline
Raw Output & view raw output of R engine  \tabularnewline
Computing time & 2 seconds \tabularnewline
R Server & 'Sir Ronald Aylmer Fisher' @ 193.190.124.24 \tabularnewline
\hline
\end{tabular}
%Source: https://freestatistics.org/blog/index.php?pk=122118&T=0

[TABLE]
[ROW][C]Summary of computational transaction[/C][/ROW]
[ROW][C]Raw Input[/C][C]view raw input (R code) [/C][/ROW]
[ROW][C]Raw Output[/C][C]view raw output of R engine [/C][/ROW]
[ROW][C]Computing time[/C][C]2 seconds[/C][/ROW]
[ROW][C]R Server[/C][C]'Sir Ronald Aylmer Fisher' @ 193.190.124.24[/C][/ROW]
[/TABLE]
Source: https://freestatistics.org/blog/index.php?pk=122118&T=0

Globally Unique Identifier (entire table): ba.freestatistics.org/blog/index.php?pk=122118&T=0

As an alternative you can also use a QR Code:  

The GUIDs for individual cells are displayed in the table below:

Summary of computational transaction
Raw Inputview raw input (R code)
Raw Outputview raw output of R engine
Computing time2 seconds
R Server'Sir Ronald Aylmer Fisher' @ 193.190.124.24


Estimated Parameters of Exponential Smoothing
ParameterValue
alpha0.773753532020297
beta0.0346047116561005
gamma1

\begin{tabular}{lllllllll}
\hline
Estimated Parameters of Exponential Smoothing \tabularnewline
Parameter & Value \tabularnewline
alpha & 0.773753532020297 \tabularnewline
beta & 0.0346047116561005 \tabularnewline
gamma & 1 \tabularnewline
\hline
\end{tabular}
%Source: https://freestatistics.org/blog/index.php?pk=122118&T=1

[TABLE]
[ROW][C]Estimated Parameters of Exponential Smoothing[/C][/ROW]
[ROW][C]Parameter[/C][C]Value[/C][/ROW]
[ROW][C]alpha[/C][C]0.773753532020297[/C][/ROW]
[ROW][C]beta[/C][C]0.0346047116561005[/C][/ROW]
[ROW][C]gamma[/C][C]1[/C][/ROW]
[/TABLE]
Source: https://freestatistics.org/blog/index.php?pk=122118&T=1

Globally Unique Identifier (entire table): ba.freestatistics.org/blog/index.php?pk=122118&T=1

As an alternative you can also use a QR Code:  

The GUIDs for individual cells are displayed in the table below:

Estimated Parameters of Exponential Smoothing
ParameterValue
alpha0.773753532020297
beta0.0346047116561005
gamma1


Interpolation Forecasts of Exponential Smoothing
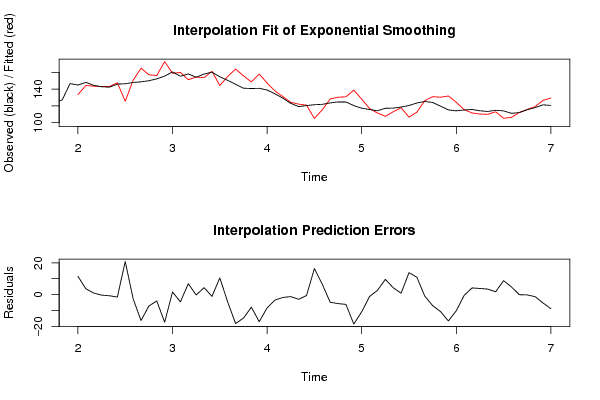
tObservedFittedResiduals
13144.979133.51567654914511.4633234508547
14148.21144.5163514658393.69364853416059
15144.67143.6652789920851.00472100791521
16142.97143.278582939518-0.308582939518118
17142.524143.246034184331-0.722034184331079
18146.142147.652534895614-1.51053489561431
19146.522125.6934017091220.8285982908801
20148.128150.70319823366-2.57519823365959
21148.798165.098438934999-16.3004389349988
22150.181157.342190138547-7.16119013854706
23152.388156.346889470515-3.95888947051478
24155.694173.081795605873-17.3877956058731
25160.662158.9894240646221.67257593537772
26155.52160.048135129227-4.52813512922685
27158.262151.3984487619466.86355123805433
28154.338154.576166738474-0.238166738473836
29158.196153.8347001384934.36129986150718
30160.371161.462301177588-1.09130117758806
31154.856144.35917489857210.496825101428
32150.636155.280533903342-4.64453390334177
33145.899164.114758834874-18.2157588348742
34141.242156.038390823322-14.7963908233218
35140.834148.74954298314-7.91554298313994
36141.119158.168497569169-17.049497569169
37139.104147.44305083641-8.33905083640977
38134.437137.877098624352-3.44009862435249
39129.425131.2005031681-1.77550316809965
40123.155124.40955853764-1.25455853763961
41119.273122.21762871106-2.94462871106042
42120.472121.058350410092-0.586350410091796
43121.523105.08096495439616.4420350456037
44121.983115.4492189742686.53378102573177
45123.658128.434014845848-4.77601484584768
46124.794130.461924244474-5.66792424447364
47124.827130.969054696029-6.14205469602922
48120.382138.917240725629-18.5352407256293
49117.395128.196634824461-10.8016348244609
50115.79116.951415265722-1.16141526572194
51114.283111.5933759533332.68962404666661
52117.271107.6735652565739.5974347434271
53117.448113.084962991014.36303700898954
54118.764117.898167359630.865832640369504
55120.55106.72050705810213.8294929418976
56123.554112.57911907904310.9748809209567
57125.412126.313872217897-0.901872217896951
58124.182131.113795889218-6.93179588921801
59119.828130.478064115764-10.6500641157638
60115.361131.955876345639-16.5948763456394
61114.226124.359918495297-10.1339184952969
62115.214115.703874119368-0.489874119368395
63115.864111.6461687343294.21783126567104
64114.276110.4220426332283.85395736677208
65113.469110.0017169715383.46728302846178
66114.883113.1031906305451.77980936945548
67114.172105.3627698397268.80923016027417
68111.225106.3537342117974.87126578820303
69112.149112.17793697608-0.0289369760799048
70115.618115.811638575546-0.193638575546018
71118.002119.251342555537-1.24934255553717
72121.382126.612720500418-5.23072050041813
73120.663129.530585399097-8.8675853990966

\begin{tabular}{lllllllll}
\hline
Interpolation Forecasts of Exponential Smoothing \tabularnewline
t & Observed & Fitted & Residuals \tabularnewline
13 & 144.979 & 133.515676549145 & 11.4633234508547 \tabularnewline
14 & 148.21 & 144.516351465839 & 3.69364853416059 \tabularnewline
15 & 144.67 & 143.665278992085 & 1.00472100791521 \tabularnewline
16 & 142.97 & 143.278582939518 & -0.308582939518118 \tabularnewline
17 & 142.524 & 143.246034184331 & -0.722034184331079 \tabularnewline
18 & 146.142 & 147.652534895614 & -1.51053489561431 \tabularnewline
19 & 146.522 & 125.69340170912 & 20.8285982908801 \tabularnewline
20 & 148.128 & 150.70319823366 & -2.57519823365959 \tabularnewline
21 & 148.798 & 165.098438934999 & -16.3004389349988 \tabularnewline
22 & 150.181 & 157.342190138547 & -7.16119013854706 \tabularnewline
23 & 152.388 & 156.346889470515 & -3.95888947051478 \tabularnewline
24 & 155.694 & 173.081795605873 & -17.3877956058731 \tabularnewline
25 & 160.662 & 158.989424064622 & 1.67257593537772 \tabularnewline
26 & 155.52 & 160.048135129227 & -4.52813512922685 \tabularnewline
27 & 158.262 & 151.398448761946 & 6.86355123805433 \tabularnewline
28 & 154.338 & 154.576166738474 & -0.238166738473836 \tabularnewline
29 & 158.196 & 153.834700138493 & 4.36129986150718 \tabularnewline
30 & 160.371 & 161.462301177588 & -1.09130117758806 \tabularnewline
31 & 154.856 & 144.359174898572 & 10.496825101428 \tabularnewline
32 & 150.636 & 155.280533903342 & -4.64453390334177 \tabularnewline
33 & 145.899 & 164.114758834874 & -18.2157588348742 \tabularnewline
34 & 141.242 & 156.038390823322 & -14.7963908233218 \tabularnewline
35 & 140.834 & 148.74954298314 & -7.91554298313994 \tabularnewline
36 & 141.119 & 158.168497569169 & -17.049497569169 \tabularnewline
37 & 139.104 & 147.44305083641 & -8.33905083640977 \tabularnewline
38 & 134.437 & 137.877098624352 & -3.44009862435249 \tabularnewline
39 & 129.425 & 131.2005031681 & -1.77550316809965 \tabularnewline
40 & 123.155 & 124.40955853764 & -1.25455853763961 \tabularnewline
41 & 119.273 & 122.21762871106 & -2.94462871106042 \tabularnewline
42 & 120.472 & 121.058350410092 & -0.586350410091796 \tabularnewline
43 & 121.523 & 105.080964954396 & 16.4420350456037 \tabularnewline
44 & 121.983 & 115.449218974268 & 6.53378102573177 \tabularnewline
45 & 123.658 & 128.434014845848 & -4.77601484584768 \tabularnewline
46 & 124.794 & 130.461924244474 & -5.66792424447364 \tabularnewline
47 & 124.827 & 130.969054696029 & -6.14205469602922 \tabularnewline
48 & 120.382 & 138.917240725629 & -18.5352407256293 \tabularnewline
49 & 117.395 & 128.196634824461 & -10.8016348244609 \tabularnewline
50 & 115.79 & 116.951415265722 & -1.16141526572194 \tabularnewline
51 & 114.283 & 111.593375953333 & 2.68962404666661 \tabularnewline
52 & 117.271 & 107.673565256573 & 9.5974347434271 \tabularnewline
53 & 117.448 & 113.08496299101 & 4.36303700898954 \tabularnewline
54 & 118.764 & 117.89816735963 & 0.865832640369504 \tabularnewline
55 & 120.55 & 106.720507058102 & 13.8294929418976 \tabularnewline
56 & 123.554 & 112.579119079043 & 10.9748809209567 \tabularnewline
57 & 125.412 & 126.313872217897 & -0.901872217896951 \tabularnewline
58 & 124.182 & 131.113795889218 & -6.93179588921801 \tabularnewline
59 & 119.828 & 130.478064115764 & -10.6500641157638 \tabularnewline
60 & 115.361 & 131.955876345639 & -16.5948763456394 \tabularnewline
61 & 114.226 & 124.359918495297 & -10.1339184952969 \tabularnewline
62 & 115.214 & 115.703874119368 & -0.489874119368395 \tabularnewline
63 & 115.864 & 111.646168734329 & 4.21783126567104 \tabularnewline
64 & 114.276 & 110.422042633228 & 3.85395736677208 \tabularnewline
65 & 113.469 & 110.001716971538 & 3.46728302846178 \tabularnewline
66 & 114.883 & 113.103190630545 & 1.77980936945548 \tabularnewline
67 & 114.172 & 105.362769839726 & 8.80923016027417 \tabularnewline
68 & 111.225 & 106.353734211797 & 4.87126578820303 \tabularnewline
69 & 112.149 & 112.17793697608 & -0.0289369760799048 \tabularnewline
70 & 115.618 & 115.811638575546 & -0.193638575546018 \tabularnewline
71 & 118.002 & 119.251342555537 & -1.24934255553717 \tabularnewline
72 & 121.382 & 126.612720500418 & -5.23072050041813 \tabularnewline
73 & 120.663 & 129.530585399097 & -8.8675853990966 \tabularnewline
\hline
\end{tabular}
%Source: https://freestatistics.org/blog/index.php?pk=122118&T=2

[TABLE]
[ROW][C]Interpolation Forecasts of Exponential Smoothing[/C][/ROW]
[ROW][C]t[/C][C]Observed[/C][C]Fitted[/C][C]Residuals[/C][/ROW]
[ROW][C]13[/C][C]144.979[/C][C]133.515676549145[/C][C]11.4633234508547[/C][/ROW]
[ROW][C]14[/C][C]148.21[/C][C]144.516351465839[/C][C]3.69364853416059[/C][/ROW]
[ROW][C]15[/C][C]144.67[/C][C]143.665278992085[/C][C]1.00472100791521[/C][/ROW]
[ROW][C]16[/C][C]142.97[/C][C]143.278582939518[/C][C]-0.308582939518118[/C][/ROW]
[ROW][C]17[/C][C]142.524[/C][C]143.246034184331[/C][C]-0.722034184331079[/C][/ROW]
[ROW][C]18[/C][C]146.142[/C][C]147.652534895614[/C][C]-1.51053489561431[/C][/ROW]
[ROW][C]19[/C][C]146.522[/C][C]125.69340170912[/C][C]20.8285982908801[/C][/ROW]
[ROW][C]20[/C][C]148.128[/C][C]150.70319823366[/C][C]-2.57519823365959[/C][/ROW]
[ROW][C]21[/C][C]148.798[/C][C]165.098438934999[/C][C]-16.3004389349988[/C][/ROW]
[ROW][C]22[/C][C]150.181[/C][C]157.342190138547[/C][C]-7.16119013854706[/C][/ROW]
[ROW][C]23[/C][C]152.388[/C][C]156.346889470515[/C][C]-3.95888947051478[/C][/ROW]
[ROW][C]24[/C][C]155.694[/C][C]173.081795605873[/C][C]-17.3877956058731[/C][/ROW]
[ROW][C]25[/C][C]160.662[/C][C]158.989424064622[/C][C]1.67257593537772[/C][/ROW]
[ROW][C]26[/C][C]155.52[/C][C]160.048135129227[/C][C]-4.52813512922685[/C][/ROW]
[ROW][C]27[/C][C]158.262[/C][C]151.398448761946[/C][C]6.86355123805433[/C][/ROW]
[ROW][C]28[/C][C]154.338[/C][C]154.576166738474[/C][C]-0.238166738473836[/C][/ROW]
[ROW][C]29[/C][C]158.196[/C][C]153.834700138493[/C][C]4.36129986150718[/C][/ROW]
[ROW][C]30[/C][C]160.371[/C][C]161.462301177588[/C][C]-1.09130117758806[/C][/ROW]
[ROW][C]31[/C][C]154.856[/C][C]144.359174898572[/C][C]10.496825101428[/C][/ROW]
[ROW][C]32[/C][C]150.636[/C][C]155.280533903342[/C][C]-4.64453390334177[/C][/ROW]
[ROW][C]33[/C][C]145.899[/C][C]164.114758834874[/C][C]-18.2157588348742[/C][/ROW]
[ROW][C]34[/C][C]141.242[/C][C]156.038390823322[/C][C]-14.7963908233218[/C][/ROW]
[ROW][C]35[/C][C]140.834[/C][C]148.74954298314[/C][C]-7.91554298313994[/C][/ROW]
[ROW][C]36[/C][C]141.119[/C][C]158.168497569169[/C][C]-17.049497569169[/C][/ROW]
[ROW][C]37[/C][C]139.104[/C][C]147.44305083641[/C][C]-8.33905083640977[/C][/ROW]
[ROW][C]38[/C][C]134.437[/C][C]137.877098624352[/C][C]-3.44009862435249[/C][/ROW]
[ROW][C]39[/C][C]129.425[/C][C]131.2005031681[/C][C]-1.77550316809965[/C][/ROW]
[ROW][C]40[/C][C]123.155[/C][C]124.40955853764[/C][C]-1.25455853763961[/C][/ROW]
[ROW][C]41[/C][C]119.273[/C][C]122.21762871106[/C][C]-2.94462871106042[/C][/ROW]
[ROW][C]42[/C][C]120.472[/C][C]121.058350410092[/C][C]-0.586350410091796[/C][/ROW]
[ROW][C]43[/C][C]121.523[/C][C]105.080964954396[/C][C]16.4420350456037[/C][/ROW]
[ROW][C]44[/C][C]121.983[/C][C]115.449218974268[/C][C]6.53378102573177[/C][/ROW]
[ROW][C]45[/C][C]123.658[/C][C]128.434014845848[/C][C]-4.77601484584768[/C][/ROW]
[ROW][C]46[/C][C]124.794[/C][C]130.461924244474[/C][C]-5.66792424447364[/C][/ROW]
[ROW][C]47[/C][C]124.827[/C][C]130.969054696029[/C][C]-6.14205469602922[/C][/ROW]
[ROW][C]48[/C][C]120.382[/C][C]138.917240725629[/C][C]-18.5352407256293[/C][/ROW]
[ROW][C]49[/C][C]117.395[/C][C]128.196634824461[/C][C]-10.8016348244609[/C][/ROW]
[ROW][C]50[/C][C]115.79[/C][C]116.951415265722[/C][C]-1.16141526572194[/C][/ROW]
[ROW][C]51[/C][C]114.283[/C][C]111.593375953333[/C][C]2.68962404666661[/C][/ROW]
[ROW][C]52[/C][C]117.271[/C][C]107.673565256573[/C][C]9.5974347434271[/C][/ROW]
[ROW][C]53[/C][C]117.448[/C][C]113.08496299101[/C][C]4.36303700898954[/C][/ROW]
[ROW][C]54[/C][C]118.764[/C][C]117.89816735963[/C][C]0.865832640369504[/C][/ROW]
[ROW][C]55[/C][C]120.55[/C][C]106.720507058102[/C][C]13.8294929418976[/C][/ROW]
[ROW][C]56[/C][C]123.554[/C][C]112.579119079043[/C][C]10.9748809209567[/C][/ROW]
[ROW][C]57[/C][C]125.412[/C][C]126.313872217897[/C][C]-0.901872217896951[/C][/ROW]
[ROW][C]58[/C][C]124.182[/C][C]131.113795889218[/C][C]-6.93179588921801[/C][/ROW]
[ROW][C]59[/C][C]119.828[/C][C]130.478064115764[/C][C]-10.6500641157638[/C][/ROW]
[ROW][C]60[/C][C]115.361[/C][C]131.955876345639[/C][C]-16.5948763456394[/C][/ROW]
[ROW][C]61[/C][C]114.226[/C][C]124.359918495297[/C][C]-10.1339184952969[/C][/ROW]
[ROW][C]62[/C][C]115.214[/C][C]115.703874119368[/C][C]-0.489874119368395[/C][/ROW]
[ROW][C]63[/C][C]115.864[/C][C]111.646168734329[/C][C]4.21783126567104[/C][/ROW]
[ROW][C]64[/C][C]114.276[/C][C]110.422042633228[/C][C]3.85395736677208[/C][/ROW]
[ROW][C]65[/C][C]113.469[/C][C]110.001716971538[/C][C]3.46728302846178[/C][/ROW]
[ROW][C]66[/C][C]114.883[/C][C]113.103190630545[/C][C]1.77980936945548[/C][/ROW]
[ROW][C]67[/C][C]114.172[/C][C]105.362769839726[/C][C]8.80923016027417[/C][/ROW]
[ROW][C]68[/C][C]111.225[/C][C]106.353734211797[/C][C]4.87126578820303[/C][/ROW]
[ROW][C]69[/C][C]112.149[/C][C]112.17793697608[/C][C]-0.0289369760799048[/C][/ROW]
[ROW][C]70[/C][C]115.618[/C][C]115.811638575546[/C][C]-0.193638575546018[/C][/ROW]
[ROW][C]71[/C][C]118.002[/C][C]119.251342555537[/C][C]-1.24934255553717[/C][/ROW]
[ROW][C]72[/C][C]121.382[/C][C]126.612720500418[/C][C]-5.23072050041813[/C][/ROW]
[ROW][C]73[/C][C]120.663[/C][C]129.530585399097[/C][C]-8.8675853990966[/C][/ROW]
[/TABLE]
Source: https://freestatistics.org/blog/index.php?pk=122118&T=2

Globally Unique Identifier (entire table): ba.freestatistics.org/blog/index.php?pk=122118&T=2

As an alternative you can also use a QR Code:  

The GUIDs for individual cells are displayed in the table below:

Interpolation Forecasts of Exponential Smoothing
tObservedFittedResiduals
13144.979133.51567654914511.4633234508547
14148.21144.5163514658393.69364853416059
15144.67143.6652789920851.00472100791521
16142.97143.278582939518-0.308582939518118
17142.524143.246034184331-0.722034184331079
18146.142147.652534895614-1.51053489561431
19146.522125.6934017091220.8285982908801
20148.128150.70319823366-2.57519823365959
21148.798165.098438934999-16.3004389349988
22150.181157.342190138547-7.16119013854706
23152.388156.346889470515-3.95888947051478
24155.694173.081795605873-17.3877956058731
25160.662158.9894240646221.67257593537772
26155.52160.048135129227-4.52813512922685
27158.262151.3984487619466.86355123805433
28154.338154.576166738474-0.238166738473836
29158.196153.8347001384934.36129986150718
30160.371161.462301177588-1.09130117758806
31154.856144.35917489857210.496825101428
32150.636155.280533903342-4.64453390334177
33145.899164.114758834874-18.2157588348742
34141.242156.038390823322-14.7963908233218
35140.834148.74954298314-7.91554298313994
36141.119158.168497569169-17.049497569169
37139.104147.44305083641-8.33905083640977
38134.437137.877098624352-3.44009862435249
39129.425131.2005031681-1.77550316809965
40123.155124.40955853764-1.25455853763961
41119.273122.21762871106-2.94462871106042
42120.472121.058350410092-0.586350410091796
43121.523105.08096495439616.4420350456037
44121.983115.4492189742686.53378102573177
45123.658128.434014845848-4.77601484584768
46124.794130.461924244474-5.66792424447364
47124.827130.969054696029-6.14205469602922
48120.382138.917240725629-18.5352407256293
49117.395128.196634824461-10.8016348244609
50115.79116.951415265722-1.16141526572194
51114.283111.5933759533332.68962404666661
52117.271107.6735652565739.5974347434271
53117.448113.084962991014.36303700898954
54118.764117.898167359630.865832640369504
55120.55106.72050705810213.8294929418976
56123.554112.57911907904310.9748809209567
57125.412126.313872217897-0.901872217896951
58124.182131.113795889218-6.93179588921801
59119.828130.478064115764-10.6500641157638
60115.361131.955876345639-16.5948763456394
61114.226124.359918495297-10.1339184952969
62115.214115.703874119368-0.489874119368395
63115.864111.6461687343294.21783126567104
64114.276110.4220426332283.85395736677208
65113.469110.0017169715383.46728302846178
66114.883113.1031906305451.77980936945548
67114.172105.3627698397268.80923016027417
68111.225106.3537342117974.87126578820303
69112.149112.17793697608-0.0289369760799048
70115.618115.811638575546-0.193638575546018
71118.002119.251342555537-1.24934255553717
72121.382126.612720500418-5.23072050041813
73120.663129.530585399097-8.8675853990966


Extrapolation Forecasts of Exponential Smoothing
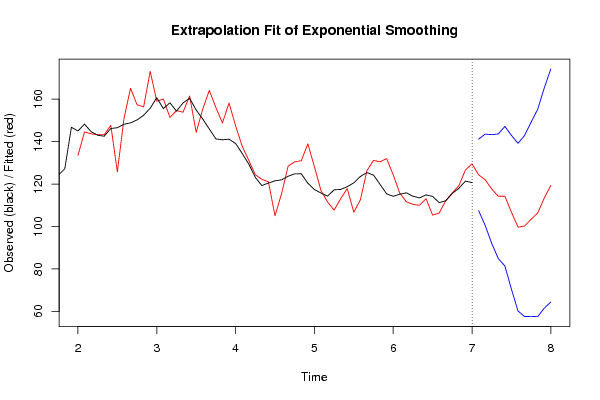
tForecast95% Lower Bound95% Upper Bound
74124.329206562552107.542214573171141.116198551932
75122.0216662129100.518278024119143.525054401682
76117.64473996131292.046478264596143.243001658028
77114.24481264039584.904855922515143.584769358274
78114.27873572464181.423204321162147.13426712812
79106.7009643263670.484480262408142.917448390313
8099.69833507037660.2308744487108139.165795692041
81100.22782434671757.5894590054352142.866189687999
82103.43052686989557.6802587134843149.180795026305
83106.37026884949857.5516758196873155.188861879309
84113.4200678701861.5650948075685165.275040932792
85119.32495920191964.4565646619633174.193353741875

\begin{tabular}{lllllllll}
\hline
Extrapolation Forecasts of Exponential Smoothing \tabularnewline
t & Forecast & 95% Lower Bound & 95% Upper Bound \tabularnewline
74 & 124.329206562552 & 107.542214573171 & 141.116198551932 \tabularnewline
75 & 122.0216662129 & 100.518278024119 & 143.525054401682 \tabularnewline
76 & 117.644739961312 & 92.046478264596 & 143.243001658028 \tabularnewline
77 & 114.244812640395 & 84.904855922515 & 143.584769358274 \tabularnewline
78 & 114.278735724641 & 81.423204321162 & 147.13426712812 \tabularnewline
79 & 106.70096432636 & 70.484480262408 & 142.917448390313 \tabularnewline
80 & 99.698335070376 & 60.2308744487108 & 139.165795692041 \tabularnewline
81 & 100.227824346717 & 57.5894590054352 & 142.866189687999 \tabularnewline
82 & 103.430526869895 & 57.6802587134843 & 149.180795026305 \tabularnewline
83 & 106.370268849498 & 57.5516758196873 & 155.188861879309 \tabularnewline
84 & 113.42006787018 & 61.5650948075685 & 165.275040932792 \tabularnewline
85 & 119.324959201919 & 64.4565646619633 & 174.193353741875 \tabularnewline
\hline
\end{tabular}
%Source: https://freestatistics.org/blog/index.php?pk=122118&T=3

[TABLE]
[ROW][C]Extrapolation Forecasts of Exponential Smoothing[/C][/ROW]
[ROW][C]t[/C][C]Forecast[/C][C]95% Lower Bound[/C][C]95% Upper Bound[/C][/ROW]
[ROW][C]74[/C][C]124.329206562552[/C][C]107.542214573171[/C][C]141.116198551932[/C][/ROW]
[ROW][C]75[/C][C]122.0216662129[/C][C]100.518278024119[/C][C]143.525054401682[/C][/ROW]
[ROW][C]76[/C][C]117.644739961312[/C][C]92.046478264596[/C][C]143.243001658028[/C][/ROW]
[ROW][C]77[/C][C]114.244812640395[/C][C]84.904855922515[/C][C]143.584769358274[/C][/ROW]
[ROW][C]78[/C][C]114.278735724641[/C][C]81.423204321162[/C][C]147.13426712812[/C][/ROW]
[ROW][C]79[/C][C]106.70096432636[/C][C]70.484480262408[/C][C]142.917448390313[/C][/ROW]
[ROW][C]80[/C][C]99.698335070376[/C][C]60.2308744487108[/C][C]139.165795692041[/C][/ROW]
[ROW][C]81[/C][C]100.227824346717[/C][C]57.5894590054352[/C][C]142.866189687999[/C][/ROW]
[ROW][C]82[/C][C]103.430526869895[/C][C]57.6802587134843[/C][C]149.180795026305[/C][/ROW]
[ROW][C]83[/C][C]106.370268849498[/C][C]57.5516758196873[/C][C]155.188861879309[/C][/ROW]
[ROW][C]84[/C][C]113.42006787018[/C][C]61.5650948075685[/C][C]165.275040932792[/C][/ROW]
[ROW][C]85[/C][C]119.324959201919[/C][C]64.4565646619633[/C][C]174.193353741875[/C][/ROW]
[/TABLE]
Source: https://freestatistics.org/blog/index.php?pk=122118&T=3

Globally Unique Identifier (entire table): ba.freestatistics.org/blog/index.php?pk=122118&T=3

As an alternative you can also use a QR Code:  

The GUIDs for individual cells are displayed in the table below:

Extrapolation Forecasts of Exponential Smoothing
tForecast95% Lower Bound95% Upper Bound
74124.329206562552107.542214573171141.116198551932
75122.0216662129100.518278024119143.525054401682
76117.64473996131292.046478264596143.243001658028
77114.24481264039584.904855922515143.584769358274
78114.27873572464181.423204321162147.13426712812
79106.7009643263670.484480262408142.917448390313
8099.69833507037660.2308744487108139.165795692041
81100.22782434671757.5894590054352142.866189687999
82103.43052686989557.6802587134843149.180795026305
83106.37026884949857.5516758196873155.188861879309
84113.4200678701861.5650948075685165.275040932792
85119.32495920191964.4565646619633174.193353741875


Parameters (Session):
par1 = 12 ; par2 = Triple ; par3 = additive ;
Parameters (R input):
par1 = 12 ; par2 = Triple ; par3 = additive ;
R code (references can be found in the software module):
par1 <- as.numeric(par1)
if (par2 == 'Single') K <- 1
if (par2 == 'Double') K <- 2
if (par2 == 'Triple') K <- par1
nx <- length(x)
nxmK <- nx - K
x <- ts(x, frequency = par1)
if (par2 == 'Single') fit <- HoltWinters(x, gamma=F, beta=F)
if (par2 == 'Double') fit <- HoltWinters(x, gamma=F)
if (par2 == 'Triple') fit <- HoltWinters(x, seasonal=par3)
fit
myresid <- x - fit$fitted[,'xhat']
bitmap(file='test1.png')
op <- par(mfrow=c(2,1))
plot(fit,ylab='Observed (black) / Fitted (red)',main='Interpolation Fit of Exponential Smoothing')
plot(myresid,ylab='Residuals',main='Interpolation Prediction Errors')
par(op)
dev.off()
bitmap(file='test2.png')
p <- predict(fit, par1, prediction.interval=TRUE)
np <- length(p[,1])
plot(fit,p,ylab='Observed (black) / Fitted (red)',main='Extrapolation Fit of Exponential Smoothing')
dev.off()
bitmap(file='test3.png')
op <- par(mfrow = c(2,2))
acf(as.numeric(myresid),lag.max = nx/2,main='Residual ACF')
spectrum(myresid,main='Residals Periodogram')
cpgram(myresid,main='Residal Cumulative Periodogram')
qqnorm(myresid,main='Residual Normal QQ Plot')
qqline(myresid)
par(op)
dev.off()
load(file='createtable')
a<-table.start()
a<-table.row.start(a)
a<-table.element(a,'Estimated Parameters of Exponential Smoothing',2,TRUE)
a<-table.row.end(a)
a<-table.row.start(a)
a<-table.element(a,'Parameter',header=TRUE)
a<-table.element(a,'Value',header=TRUE)
a<-table.row.end(a)
a<-table.row.start(a)
a<-table.element(a,'alpha',header=TRUE)
a<-table.element(a,fit$alpha)
a<-table.row.end(a)
a<-table.row.start(a)
a<-table.element(a,'beta',header=TRUE)
a<-table.element(a,fit$beta)
a<-table.row.end(a)
a<-table.row.start(a)
a<-table.element(a,'gamma',header=TRUE)
a<-table.element(a,fit$gamma)
a<-table.row.end(a)
a<-table.end(a)
table.save(a,file='mytable.tab')
a<-table.start()
a<-table.row.start(a)
a<-table.element(a,'Interpolation Forecasts of Exponential Smoothing',4,TRUE)
a<-table.row.end(a)
a<-table.row.start(a)
a<-table.element(a,'t',header=TRUE)
a<-table.element(a,'Observed',header=TRUE)
a<-table.element(a,'Fitted',header=TRUE)
a<-table.element(a,'Residuals',header=TRUE)
a<-table.row.end(a)
for (i in 1:nxmK) {
a<-table.row.start(a)
a<-table.element(a,i+K,header=TRUE)
a<-table.element(a,x[i+K])
a<-table.element(a,fit$fitted[i,'xhat'])
a<-table.element(a,myresid[i])
a<-table.row.end(a)
}
a<-table.end(a)
table.save(a,file='mytable1.tab')
a<-table.start()
a<-table.row.start(a)
a<-table.element(a,'Extrapolation Forecasts of Exponential Smoothing',4,TRUE)
a<-table.row.end(a)
a<-table.row.start(a)
a<-table.element(a,'t',header=TRUE)
a<-table.element(a,'Forecast',header=TRUE)
a<-table.element(a,'95% Lower Bound',header=TRUE)
a<-table.element(a,'95% Upper Bound',header=TRUE)
a<-table.row.end(a)
for (i in 1:np) {
a<-table.row.start(a)
a<-table.element(a,nx+i,header=TRUE)
a<-table.element(a,p[i,'fit'])
a<-table.element(a,p[i,'lwr'])
a<-table.element(a,p[i,'upr'])
a<-table.row.end(a)
}
a<-table.end(a)
table.save(a,file='mytable2.tab')