Free Statistics

of Irreproducible Research!

Author's title

Author*Unverified author*
R Software Modulerwasp_autocorrelation.wasp
Title produced by software(Partial) Autocorrelation Function
Date of computationThu, 19 May 2011 09:43:36 +0000
Cite this page as followsStatistical Computations at FreeStatistics.org, Office for Research Development and Education, URL https://freestatistics.org/blog/index.php?v=date/2011/May/19/t13057980564hdi3wb9r3ijx5g.htm/, Retrieved Sun, 12 May 2024 07:35:51 +0000
Statistical Computations at FreeStatistics.org, Office for Research Development and Education, URL https://freestatistics.org/blog/index.php?pk=121972, Retrieved Sun, 12 May 2024 07:35:51 +0000
QR Codes:

Original text written by user:
IsPrivate?No (this computation is public)
User-defined keywordsKDGP2W12
Estimated Impact116
Family? (F = Feedback message, R = changed R code, M = changed R Module, P = changed Parameters, D = changed Data)
-       [(Partial) Autocorrelation Function] [IKO opdracht 6BIS...] [2011-05-19 09:43:36] [3f8170910ab21fde7eba151af40022ac] [Current]
Feedback Forum

Post a new message
Dataseries X:
3893.9
3799.2
3769.6
3768.6
3854.9
3778.5
3779.7
3803.2
3900.3
3792.6
3767.4
3752.6
3829.6
3722.6
3692.9
3681
3762.9
3661.7
3633.1
3621.5
3710
3619.4
3595.2
3573.2
3650.1
3554.2
3537
3528.6
3597.1
3521.9
3516.5
3515.7
3600.2
3517.1
3513.7
3528.2
3608.3
3502.5
3502.5
3495.3
3543.8
3425.3
3418.4
3406.4
3446.1
3341.1
3347
3354.9
3399
3288.9
3279
3275.2
3314
3227.1
3225.3
3228.6
3287.1
3210.1
3213.1
3228
3287
3211
3199.8
3166.3
3164
3156.7
3156
3165.5
3179.2
3182.5
3179.5
3193.5
3219.6
3221.9
3210.1


Summary of computational transaction
Raw Inputview raw input (R code)
Raw Outputview raw output of R engine
Computing time2 seconds
R Server'Gwilym Jenkins' @ www.wessa.org

\begin{tabular}{lllllllll}
\hline
Summary of computational transaction \tabularnewline
Raw Input & view raw input (R code)  \tabularnewline
Raw Output & view raw output of R engine  \tabularnewline
Computing time & 2 seconds \tabularnewline
R Server & 'Gwilym Jenkins' @ www.wessa.org \tabularnewline
\hline
\end{tabular}
%Source: https://freestatistics.org/blog/index.php?pk=121972&T=0

[TABLE]
[ROW][C]Summary of computational transaction[/C][/ROW]
[ROW][C]Raw Input[/C][C]view raw input (R code) [/C][/ROW]
[ROW][C]Raw Output[/C][C]view raw output of R engine [/C][/ROW]
[ROW][C]Computing time[/C][C]2 seconds[/C][/ROW]
[ROW][C]R Server[/C][C]'Gwilym Jenkins' @ www.wessa.org[/C][/ROW]
[/TABLE]
Source: https://freestatistics.org/blog/index.php?pk=121972&T=0

Globally Unique Identifier (entire table): ba.freestatistics.org/blog/index.php?pk=121972&T=0

As an alternative you can also use a QR Code:  

The GUIDs for individual cells are displayed in the table below:

Summary of computational transaction
Raw Inputview raw input (R code)
Raw Outputview raw output of R engine
Computing time2 seconds
R Server'Gwilym Jenkins' @ www.wessa.org


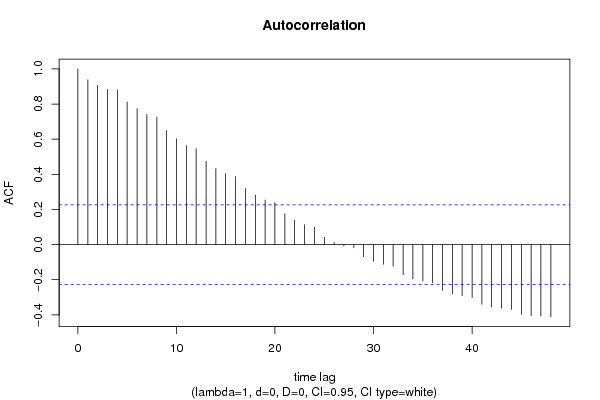
Autocorrelation Function
Time lag kACF(k)T-STATP-value
10.9377548.12120
20.9069097.85410
30.8833237.64980
40.8801697.62250
50.8120357.03240
60.7741886.70470
70.7409896.41710
80.7257276.2850
90.6482975.61440
100.6025135.21791e-06
110.5636954.88173e-06
120.5455564.72475e-06
130.4736054.10155.2e-05
140.4325323.74580.000175
150.4030313.49040.000406
160.3878413.35880.000616
170.3199052.77050.003527
180.2813682.43670.008597
190.2541422.20090.015409
200.2389222.06910.02099
210.1751351.51670.066771
220.1389771.20360.116269
230.1134570.98260.16449
240.0992440.85950.196407
250.0416630.36080.359626
260.0117220.10150.459706
27-0.006836-0.05920.476473
28-0.018196-0.15760.437604
29-0.06857-0.59380.277204
30-0.095278-0.82510.205957
31-0.112044-0.97030.167502
32-0.123546-1.06990.144038
33-0.170851-1.47960.071583
34-0.194065-1.68070.048496
35-0.206343-1.7870.03899
36-0.217112-1.88020.031979
37-0.260384-2.2550.013526
38-0.279845-2.42350.008891
39-0.290369-2.51470.007028
40-0.301198-2.60850.005486
41-0.339388-2.93920.002186
42-0.354816-3.07280.001478
43-0.361703-3.13240.001236
44-0.368893-3.19470.001024
45-0.396927-3.43750.000481
46-0.405455-3.51130.000379
47-0.406976-3.52450.000363
48-0.41015-3.5520.000332

\begin{tabular}{lllllllll}
\hline
Autocorrelation Function \tabularnewline
Time lag k & ACF(k) & T-STAT & P-value \tabularnewline
1 & 0.937754 & 8.1212 & 0 \tabularnewline
2 & 0.906909 & 7.8541 & 0 \tabularnewline
3 & 0.883323 & 7.6498 & 0 \tabularnewline
4 & 0.880169 & 7.6225 & 0 \tabularnewline
5 & 0.812035 & 7.0324 & 0 \tabularnewline
6 & 0.774188 & 6.7047 & 0 \tabularnewline
7 & 0.740989 & 6.4171 & 0 \tabularnewline
8 & 0.725727 & 6.285 & 0 \tabularnewline
9 & 0.648297 & 5.6144 & 0 \tabularnewline
10 & 0.602513 & 5.2179 & 1e-06 \tabularnewline
11 & 0.563695 & 4.8817 & 3e-06 \tabularnewline
12 & 0.545556 & 4.7247 & 5e-06 \tabularnewline
13 & 0.473605 & 4.1015 & 5.2e-05 \tabularnewline
14 & 0.432532 & 3.7458 & 0.000175 \tabularnewline
15 & 0.403031 & 3.4904 & 0.000406 \tabularnewline
16 & 0.387841 & 3.3588 & 0.000616 \tabularnewline
17 & 0.319905 & 2.7705 & 0.003527 \tabularnewline
18 & 0.281368 & 2.4367 & 0.008597 \tabularnewline
19 & 0.254142 & 2.2009 & 0.015409 \tabularnewline
20 & 0.238922 & 2.0691 & 0.02099 \tabularnewline
21 & 0.175135 & 1.5167 & 0.066771 \tabularnewline
22 & 0.138977 & 1.2036 & 0.116269 \tabularnewline
23 & 0.113457 & 0.9826 & 0.16449 \tabularnewline
24 & 0.099244 & 0.8595 & 0.196407 \tabularnewline
25 & 0.041663 & 0.3608 & 0.359626 \tabularnewline
26 & 0.011722 & 0.1015 & 0.459706 \tabularnewline
27 & -0.006836 & -0.0592 & 0.476473 \tabularnewline
28 & -0.018196 & -0.1576 & 0.437604 \tabularnewline
29 & -0.06857 & -0.5938 & 0.277204 \tabularnewline
30 & -0.095278 & -0.8251 & 0.205957 \tabularnewline
31 & -0.112044 & -0.9703 & 0.167502 \tabularnewline
32 & -0.123546 & -1.0699 & 0.144038 \tabularnewline
33 & -0.170851 & -1.4796 & 0.071583 \tabularnewline
34 & -0.194065 & -1.6807 & 0.048496 \tabularnewline
35 & -0.206343 & -1.787 & 0.03899 \tabularnewline
36 & -0.217112 & -1.8802 & 0.031979 \tabularnewline
37 & -0.260384 & -2.255 & 0.013526 \tabularnewline
38 & -0.279845 & -2.4235 & 0.008891 \tabularnewline
39 & -0.290369 & -2.5147 & 0.007028 \tabularnewline
40 & -0.301198 & -2.6085 & 0.005486 \tabularnewline
41 & -0.339388 & -2.9392 & 0.002186 \tabularnewline
42 & -0.354816 & -3.0728 & 0.001478 \tabularnewline
43 & -0.361703 & -3.1324 & 0.001236 \tabularnewline
44 & -0.368893 & -3.1947 & 0.001024 \tabularnewline
45 & -0.396927 & -3.4375 & 0.000481 \tabularnewline
46 & -0.405455 & -3.5113 & 0.000379 \tabularnewline
47 & -0.406976 & -3.5245 & 0.000363 \tabularnewline
48 & -0.41015 & -3.552 & 0.000332 \tabularnewline
\hline
\end{tabular}
%Source: https://freestatistics.org/blog/index.php?pk=121972&T=1

[TABLE]
[ROW][C]Autocorrelation Function[/C][/ROW]
[ROW][C]Time lag k[/C][C]ACF(k)[/C][C]T-STAT[/C][C]P-value[/C][/ROW]
[ROW][C]1[/C][C]0.937754[/C][C]8.1212[/C][C]0[/C][/ROW]
[ROW][C]2[/C][C]0.906909[/C][C]7.8541[/C][C]0[/C][/ROW]
[ROW][C]3[/C][C]0.883323[/C][C]7.6498[/C][C]0[/C][/ROW]
[ROW][C]4[/C][C]0.880169[/C][C]7.6225[/C][C]0[/C][/ROW]
[ROW][C]5[/C][C]0.812035[/C][C]7.0324[/C][C]0[/C][/ROW]
[ROW][C]6[/C][C]0.774188[/C][C]6.7047[/C][C]0[/C][/ROW]
[ROW][C]7[/C][C]0.740989[/C][C]6.4171[/C][C]0[/C][/ROW]
[ROW][C]8[/C][C]0.725727[/C][C]6.285[/C][C]0[/C][/ROW]
[ROW][C]9[/C][C]0.648297[/C][C]5.6144[/C][C]0[/C][/ROW]
[ROW][C]10[/C][C]0.602513[/C][C]5.2179[/C][C]1e-06[/C][/ROW]
[ROW][C]11[/C][C]0.563695[/C][C]4.8817[/C][C]3e-06[/C][/ROW]
[ROW][C]12[/C][C]0.545556[/C][C]4.7247[/C][C]5e-06[/C][/ROW]
[ROW][C]13[/C][C]0.473605[/C][C]4.1015[/C][C]5.2e-05[/C][/ROW]
[ROW][C]14[/C][C]0.432532[/C][C]3.7458[/C][C]0.000175[/C][/ROW]
[ROW][C]15[/C][C]0.403031[/C][C]3.4904[/C][C]0.000406[/C][/ROW]
[ROW][C]16[/C][C]0.387841[/C][C]3.3588[/C][C]0.000616[/C][/ROW]
[ROW][C]17[/C][C]0.319905[/C][C]2.7705[/C][C]0.003527[/C][/ROW]
[ROW][C]18[/C][C]0.281368[/C][C]2.4367[/C][C]0.008597[/C][/ROW]
[ROW][C]19[/C][C]0.254142[/C][C]2.2009[/C][C]0.015409[/C][/ROW]
[ROW][C]20[/C][C]0.238922[/C][C]2.0691[/C][C]0.02099[/C][/ROW]
[ROW][C]21[/C][C]0.175135[/C][C]1.5167[/C][C]0.066771[/C][/ROW]
[ROW][C]22[/C][C]0.138977[/C][C]1.2036[/C][C]0.116269[/C][/ROW]
[ROW][C]23[/C][C]0.113457[/C][C]0.9826[/C][C]0.16449[/C][/ROW]
[ROW][C]24[/C][C]0.099244[/C][C]0.8595[/C][C]0.196407[/C][/ROW]
[ROW][C]25[/C][C]0.041663[/C][C]0.3608[/C][C]0.359626[/C][/ROW]
[ROW][C]26[/C][C]0.011722[/C][C]0.1015[/C][C]0.459706[/C][/ROW]
[ROW][C]27[/C][C]-0.006836[/C][C]-0.0592[/C][C]0.476473[/C][/ROW]
[ROW][C]28[/C][C]-0.018196[/C][C]-0.1576[/C][C]0.437604[/C][/ROW]
[ROW][C]29[/C][C]-0.06857[/C][C]-0.5938[/C][C]0.277204[/C][/ROW]
[ROW][C]30[/C][C]-0.095278[/C][C]-0.8251[/C][C]0.205957[/C][/ROW]
[ROW][C]31[/C][C]-0.112044[/C][C]-0.9703[/C][C]0.167502[/C][/ROW]
[ROW][C]32[/C][C]-0.123546[/C][C]-1.0699[/C][C]0.144038[/C][/ROW]
[ROW][C]33[/C][C]-0.170851[/C][C]-1.4796[/C][C]0.071583[/C][/ROW]
[ROW][C]34[/C][C]-0.194065[/C][C]-1.6807[/C][C]0.048496[/C][/ROW]
[ROW][C]35[/C][C]-0.206343[/C][C]-1.787[/C][C]0.03899[/C][/ROW]
[ROW][C]36[/C][C]-0.217112[/C][C]-1.8802[/C][C]0.031979[/C][/ROW]
[ROW][C]37[/C][C]-0.260384[/C][C]-2.255[/C][C]0.013526[/C][/ROW]
[ROW][C]38[/C][C]-0.279845[/C][C]-2.4235[/C][C]0.008891[/C][/ROW]
[ROW][C]39[/C][C]-0.290369[/C][C]-2.5147[/C][C]0.007028[/C][/ROW]
[ROW][C]40[/C][C]-0.301198[/C][C]-2.6085[/C][C]0.005486[/C][/ROW]
[ROW][C]41[/C][C]-0.339388[/C][C]-2.9392[/C][C]0.002186[/C][/ROW]
[ROW][C]42[/C][C]-0.354816[/C][C]-3.0728[/C][C]0.001478[/C][/ROW]
[ROW][C]43[/C][C]-0.361703[/C][C]-3.1324[/C][C]0.001236[/C][/ROW]
[ROW][C]44[/C][C]-0.368893[/C][C]-3.1947[/C][C]0.001024[/C][/ROW]
[ROW][C]45[/C][C]-0.396927[/C][C]-3.4375[/C][C]0.000481[/C][/ROW]
[ROW][C]46[/C][C]-0.405455[/C][C]-3.5113[/C][C]0.000379[/C][/ROW]
[ROW][C]47[/C][C]-0.406976[/C][C]-3.5245[/C][C]0.000363[/C][/ROW]
[ROW][C]48[/C][C]-0.41015[/C][C]-3.552[/C][C]0.000332[/C][/ROW]
[/TABLE]
Source: https://freestatistics.org/blog/index.php?pk=121972&T=1

Globally Unique Identifier (entire table): ba.freestatistics.org/blog/index.php?pk=121972&T=1

As an alternative you can also use a QR Code:  

The GUIDs for individual cells are displayed in the table below:

Autocorrelation Function
Time lag kACF(k)T-STATP-value
10.9377548.12120
20.9069097.85410
30.8833237.64980
40.8801697.62250
50.8120357.03240
60.7741886.70470
70.7409896.41710
80.7257276.2850
90.6482975.61440
100.6025135.21791e-06
110.5636954.88173e-06
120.5455564.72475e-06
130.4736054.10155.2e-05
140.4325323.74580.000175
150.4030313.49040.000406
160.3878413.35880.000616
170.3199052.77050.003527
180.2813682.43670.008597
190.2541422.20090.015409
200.2389222.06910.02099
210.1751351.51670.066771
220.1389771.20360.116269
230.1134570.98260.16449
240.0992440.85950.196407
250.0416630.36080.359626
260.0117220.10150.459706
27-0.006836-0.05920.476473
28-0.018196-0.15760.437604
29-0.06857-0.59380.277204
30-0.095278-0.82510.205957
31-0.112044-0.97030.167502
32-0.123546-1.06990.144038
33-0.170851-1.47960.071583
34-0.194065-1.68070.048496
35-0.206343-1.7870.03899
36-0.217112-1.88020.031979
37-0.260384-2.2550.013526
38-0.279845-2.42350.008891
39-0.290369-2.51470.007028
40-0.301198-2.60850.005486
41-0.339388-2.93920.002186
42-0.354816-3.07280.001478
43-0.361703-3.13240.001236
44-0.368893-3.19470.001024
45-0.396927-3.43750.000481
46-0.405455-3.51130.000379
47-0.406976-3.52450.000363
48-0.41015-3.5520.000332


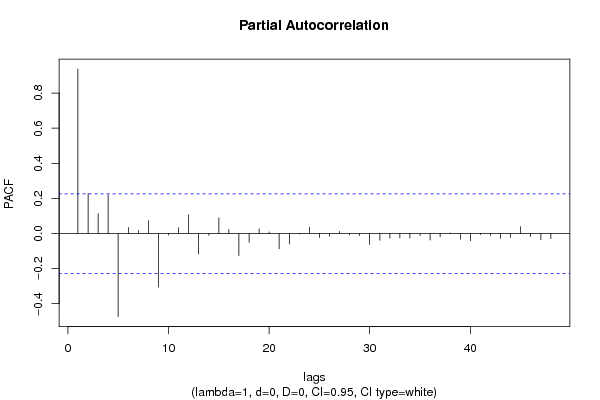
Partial Autocorrelation Function
Time lag kPACF(k)T-STATP-value
10.9377548.12120
20.2282111.97640.025896
30.1132030.98040.165029
40.2203011.90790.030119
5-0.473583-4.10135.2e-05
60.0345440.29920.382822
70.0171170.14820.441277
80.0733990.63570.263467
9-0.304222-2.63460.005114
10-0.008177-0.07080.471868
110.0326540.28280.389056
120.1063130.92070.18008
13-0.117108-1.01420.156877
14-0.009971-0.08640.465708
150.0890690.77140.221459
160.0234750.20330.419725
17-0.124813-1.08090.1416
18-0.051218-0.44360.329318
190.0265790.23020.409287
200.0089010.07710.469382
21-0.086712-0.7510.227516
22-0.059196-0.51270.304851
23-0.002708-0.02350.490675
240.0362620.3140.377182
25-0.022522-0.1950.422943
26-0.015175-0.13140.447897
270.0119550.10350.458909
28-0.007577-0.06560.473928
29-0.011332-0.09810.461041
30-0.061611-0.53360.29761
31-0.038571-0.3340.369642
32-0.026412-0.22870.40985
33-0.025152-0.21780.414079
34-0.025452-0.22040.413071
35-0.011746-0.10170.459625
36-0.036601-0.3170.376071
37-0.0187-0.16190.435891
380.0028940.02510.490034
39-0.03282-0.28420.38851
40-0.040312-0.34910.363992
41-0.006067-0.05250.479119
42-0.010603-0.09180.463542
43-0.028347-0.24550.403374
44-0.021664-0.18760.425841
450.0387270.33540.369135
46-0.017466-0.15130.440087
47-0.035203-0.30490.380657
48-0.028886-0.25020.401575

\begin{tabular}{lllllllll}
\hline
Partial Autocorrelation Function \tabularnewline
Time lag k & PACF(k) & T-STAT & P-value \tabularnewline
1 & 0.937754 & 8.1212 & 0 \tabularnewline
2 & 0.228211 & 1.9764 & 0.025896 \tabularnewline
3 & 0.113203 & 0.9804 & 0.165029 \tabularnewline
4 & 0.220301 & 1.9079 & 0.030119 \tabularnewline
5 & -0.473583 & -4.1013 & 5.2e-05 \tabularnewline
6 & 0.034544 & 0.2992 & 0.382822 \tabularnewline
7 & 0.017117 & 0.1482 & 0.441277 \tabularnewline
8 & 0.073399 & 0.6357 & 0.263467 \tabularnewline
9 & -0.304222 & -2.6346 & 0.005114 \tabularnewline
10 & -0.008177 & -0.0708 & 0.471868 \tabularnewline
11 & 0.032654 & 0.2828 & 0.389056 \tabularnewline
12 & 0.106313 & 0.9207 & 0.18008 \tabularnewline
13 & -0.117108 & -1.0142 & 0.156877 \tabularnewline
14 & -0.009971 & -0.0864 & 0.465708 \tabularnewline
15 & 0.089069 & 0.7714 & 0.221459 \tabularnewline
16 & 0.023475 & 0.2033 & 0.419725 \tabularnewline
17 & -0.124813 & -1.0809 & 0.1416 \tabularnewline
18 & -0.051218 & -0.4436 & 0.329318 \tabularnewline
19 & 0.026579 & 0.2302 & 0.409287 \tabularnewline
20 & 0.008901 & 0.0771 & 0.469382 \tabularnewline
21 & -0.086712 & -0.751 & 0.227516 \tabularnewline
22 & -0.059196 & -0.5127 & 0.304851 \tabularnewline
23 & -0.002708 & -0.0235 & 0.490675 \tabularnewline
24 & 0.036262 & 0.314 & 0.377182 \tabularnewline
25 & -0.022522 & -0.195 & 0.422943 \tabularnewline
26 & -0.015175 & -0.1314 & 0.447897 \tabularnewline
27 & 0.011955 & 0.1035 & 0.458909 \tabularnewline
28 & -0.007577 & -0.0656 & 0.473928 \tabularnewline
29 & -0.011332 & -0.0981 & 0.461041 \tabularnewline
30 & -0.061611 & -0.5336 & 0.29761 \tabularnewline
31 & -0.038571 & -0.334 & 0.369642 \tabularnewline
32 & -0.026412 & -0.2287 & 0.40985 \tabularnewline
33 & -0.025152 & -0.2178 & 0.414079 \tabularnewline
34 & -0.025452 & -0.2204 & 0.413071 \tabularnewline
35 & -0.011746 & -0.1017 & 0.459625 \tabularnewline
36 & -0.036601 & -0.317 & 0.376071 \tabularnewline
37 & -0.0187 & -0.1619 & 0.435891 \tabularnewline
38 & 0.002894 & 0.0251 & 0.490034 \tabularnewline
39 & -0.03282 & -0.2842 & 0.38851 \tabularnewline
40 & -0.040312 & -0.3491 & 0.363992 \tabularnewline
41 & -0.006067 & -0.0525 & 0.479119 \tabularnewline
42 & -0.010603 & -0.0918 & 0.463542 \tabularnewline
43 & -0.028347 & -0.2455 & 0.403374 \tabularnewline
44 & -0.021664 & -0.1876 & 0.425841 \tabularnewline
45 & 0.038727 & 0.3354 & 0.369135 \tabularnewline
46 & -0.017466 & -0.1513 & 0.440087 \tabularnewline
47 & -0.035203 & -0.3049 & 0.380657 \tabularnewline
48 & -0.028886 & -0.2502 & 0.401575 \tabularnewline
\hline
\end{tabular}
%Source: https://freestatistics.org/blog/index.php?pk=121972&T=2

[TABLE]
[ROW][C]Partial Autocorrelation Function[/C][/ROW]
[ROW][C]Time lag k[/C][C]PACF(k)[/C][C]T-STAT[/C][C]P-value[/C][/ROW]
[ROW][C]1[/C][C]0.937754[/C][C]8.1212[/C][C]0[/C][/ROW]
[ROW][C]2[/C][C]0.228211[/C][C]1.9764[/C][C]0.025896[/C][/ROW]
[ROW][C]3[/C][C]0.113203[/C][C]0.9804[/C][C]0.165029[/C][/ROW]
[ROW][C]4[/C][C]0.220301[/C][C]1.9079[/C][C]0.030119[/C][/ROW]
[ROW][C]5[/C][C]-0.473583[/C][C]-4.1013[/C][C]5.2e-05[/C][/ROW]
[ROW][C]6[/C][C]0.034544[/C][C]0.2992[/C][C]0.382822[/C][/ROW]
[ROW][C]7[/C][C]0.017117[/C][C]0.1482[/C][C]0.441277[/C][/ROW]
[ROW][C]8[/C][C]0.073399[/C][C]0.6357[/C][C]0.263467[/C][/ROW]
[ROW][C]9[/C][C]-0.304222[/C][C]-2.6346[/C][C]0.005114[/C][/ROW]
[ROW][C]10[/C][C]-0.008177[/C][C]-0.0708[/C][C]0.471868[/C][/ROW]
[ROW][C]11[/C][C]0.032654[/C][C]0.2828[/C][C]0.389056[/C][/ROW]
[ROW][C]12[/C][C]0.106313[/C][C]0.9207[/C][C]0.18008[/C][/ROW]
[ROW][C]13[/C][C]-0.117108[/C][C]-1.0142[/C][C]0.156877[/C][/ROW]
[ROW][C]14[/C][C]-0.009971[/C][C]-0.0864[/C][C]0.465708[/C][/ROW]
[ROW][C]15[/C][C]0.089069[/C][C]0.7714[/C][C]0.221459[/C][/ROW]
[ROW][C]16[/C][C]0.023475[/C][C]0.2033[/C][C]0.419725[/C][/ROW]
[ROW][C]17[/C][C]-0.124813[/C][C]-1.0809[/C][C]0.1416[/C][/ROW]
[ROW][C]18[/C][C]-0.051218[/C][C]-0.4436[/C][C]0.329318[/C][/ROW]
[ROW][C]19[/C][C]0.026579[/C][C]0.2302[/C][C]0.409287[/C][/ROW]
[ROW][C]20[/C][C]0.008901[/C][C]0.0771[/C][C]0.469382[/C][/ROW]
[ROW][C]21[/C][C]-0.086712[/C][C]-0.751[/C][C]0.227516[/C][/ROW]
[ROW][C]22[/C][C]-0.059196[/C][C]-0.5127[/C][C]0.304851[/C][/ROW]
[ROW][C]23[/C][C]-0.002708[/C][C]-0.0235[/C][C]0.490675[/C][/ROW]
[ROW][C]24[/C][C]0.036262[/C][C]0.314[/C][C]0.377182[/C][/ROW]
[ROW][C]25[/C][C]-0.022522[/C][C]-0.195[/C][C]0.422943[/C][/ROW]
[ROW][C]26[/C][C]-0.015175[/C][C]-0.1314[/C][C]0.447897[/C][/ROW]
[ROW][C]27[/C][C]0.011955[/C][C]0.1035[/C][C]0.458909[/C][/ROW]
[ROW][C]28[/C][C]-0.007577[/C][C]-0.0656[/C][C]0.473928[/C][/ROW]
[ROW][C]29[/C][C]-0.011332[/C][C]-0.0981[/C][C]0.461041[/C][/ROW]
[ROW][C]30[/C][C]-0.061611[/C][C]-0.5336[/C][C]0.29761[/C][/ROW]
[ROW][C]31[/C][C]-0.038571[/C][C]-0.334[/C][C]0.369642[/C][/ROW]
[ROW][C]32[/C][C]-0.026412[/C][C]-0.2287[/C][C]0.40985[/C][/ROW]
[ROW][C]33[/C][C]-0.025152[/C][C]-0.2178[/C][C]0.414079[/C][/ROW]
[ROW][C]34[/C][C]-0.025452[/C][C]-0.2204[/C][C]0.413071[/C][/ROW]
[ROW][C]35[/C][C]-0.011746[/C][C]-0.1017[/C][C]0.459625[/C][/ROW]
[ROW][C]36[/C][C]-0.036601[/C][C]-0.317[/C][C]0.376071[/C][/ROW]
[ROW][C]37[/C][C]-0.0187[/C][C]-0.1619[/C][C]0.435891[/C][/ROW]
[ROW][C]38[/C][C]0.002894[/C][C]0.0251[/C][C]0.490034[/C][/ROW]
[ROW][C]39[/C][C]-0.03282[/C][C]-0.2842[/C][C]0.38851[/C][/ROW]
[ROW][C]40[/C][C]-0.040312[/C][C]-0.3491[/C][C]0.363992[/C][/ROW]
[ROW][C]41[/C][C]-0.006067[/C][C]-0.0525[/C][C]0.479119[/C][/ROW]
[ROW][C]42[/C][C]-0.010603[/C][C]-0.0918[/C][C]0.463542[/C][/ROW]
[ROW][C]43[/C][C]-0.028347[/C][C]-0.2455[/C][C]0.403374[/C][/ROW]
[ROW][C]44[/C][C]-0.021664[/C][C]-0.1876[/C][C]0.425841[/C][/ROW]
[ROW][C]45[/C][C]0.038727[/C][C]0.3354[/C][C]0.369135[/C][/ROW]
[ROW][C]46[/C][C]-0.017466[/C][C]-0.1513[/C][C]0.440087[/C][/ROW]
[ROW][C]47[/C][C]-0.035203[/C][C]-0.3049[/C][C]0.380657[/C][/ROW]
[ROW][C]48[/C][C]-0.028886[/C][C]-0.2502[/C][C]0.401575[/C][/ROW]
[/TABLE]
Source: https://freestatistics.org/blog/index.php?pk=121972&T=2

Globally Unique Identifier (entire table): ba.freestatistics.org/blog/index.php?pk=121972&T=2

As an alternative you can also use a QR Code:  

The GUIDs for individual cells are displayed in the table below:

Partial Autocorrelation Function
Time lag kPACF(k)T-STATP-value
10.9377548.12120
20.2282111.97640.025896
30.1132030.98040.165029
40.2203011.90790.030119
5-0.473583-4.10135.2e-05
60.0345440.29920.382822
70.0171170.14820.441277
80.0733990.63570.263467
9-0.304222-2.63460.005114
10-0.008177-0.07080.471868
110.0326540.28280.389056
120.1063130.92070.18008
13-0.117108-1.01420.156877
14-0.009971-0.08640.465708
150.0890690.77140.221459
160.0234750.20330.419725
17-0.124813-1.08090.1416
18-0.051218-0.44360.329318
190.0265790.23020.409287
200.0089010.07710.469382
21-0.086712-0.7510.227516
22-0.059196-0.51270.304851
23-0.002708-0.02350.490675
240.0362620.3140.377182
25-0.022522-0.1950.422943
26-0.015175-0.13140.447897
270.0119550.10350.458909
28-0.007577-0.06560.473928
29-0.011332-0.09810.461041
30-0.061611-0.53360.29761
31-0.038571-0.3340.369642
32-0.026412-0.22870.40985
33-0.025152-0.21780.414079
34-0.025452-0.22040.413071
35-0.011746-0.10170.459625
36-0.036601-0.3170.376071
37-0.0187-0.16190.435891
380.0028940.02510.490034
39-0.03282-0.28420.38851
40-0.040312-0.34910.363992
41-0.006067-0.05250.479119
42-0.010603-0.09180.463542
43-0.028347-0.24550.403374
44-0.021664-0.18760.425841
450.0387270.33540.369135
46-0.017466-0.15130.440087
47-0.035203-0.30490.380657
48-0.028886-0.25020.401575


Parameters (Session):
par1 = 48 ; par2 = 1 ; par3 = 0 ; par4 = 0 ; par5 = 12 ; par6 = White Noise ; par7 = 0.95 ;
Parameters (R input):
par1 = 48 ; par2 = 1 ; par3 = 0 ; par4 = 0 ; par5 = 12 ; par6 = White Noise ; par7 = 0.95 ; par8 = ;
R code (references can be found in the software module):
if (par1 == 'Default') {
par1 = 10*log10(length(x))
} else {
par1 <- as.numeric(par1)
}
par2 <- as.numeric(par2)
par3 <- as.numeric(par3)
par4 <- as.numeric(par4)
par5 <- as.numeric(par5)
if (par6 == 'White Noise') par6 <- 'white' else par6 <- 'ma'
par7 <- as.numeric(par7)
if (par8 != '') par8 <- as.numeric(par8)
ox <- x
if (par8 == '') {
if (par2 == 0) {
x <- log(x)
} else {
x <- (x ^ par2 - 1) / par2
}
} else {
x <- log(x,base=par8)
}
if (par3 > 0) x <- diff(x,lag=1,difference=par3)
if (par4 > 0) x <- diff(x,lag=par5,difference=par4)
bitmap(file='picts.png')
op <- par(mfrow=c(2,1))
plot(ox,type='l',main='Original Time Series',xlab='time',ylab='value')
if (par8=='') {
mytitle <- paste('Working Time Series (lambda=',par2,', d=',par3,', D=',par4,')',sep='')
mysub <- paste('(lambda=',par2,', d=',par3,', D=',par4,', CI=', par7, ', CI type=',par6,')',sep='')
} else {
mytitle <- paste('Working Time Series (base=',par8,', d=',par3,', D=',par4,')',sep='')
mysub <- paste('(base=',par8,', d=',par3,', D=',par4,', CI=', par7, ', CI type=',par6,')',sep='')
}
plot(x,type='l', main=mytitle,xlab='time',ylab='value')
par(op)
dev.off()
bitmap(file='pic1.png')
racf <- acf(x, par1, main='Autocorrelation', xlab='time lag', ylab='ACF', ci.type=par6, ci=par7, sub=mysub)
dev.off()
bitmap(file='pic2.png')
rpacf <- pacf(x,par1,main='Partial Autocorrelation',xlab='lags',ylab='PACF',sub=mysub)
dev.off()
(myacf <- c(racf$acf))
(mypacf <- c(rpacf$acf))
lengthx <- length(x)
sqrtn <- sqrt(lengthx)
load(file='createtable')
a<-table.start()
a<-table.row.start(a)
a<-table.element(a,'Autocorrelation Function',4,TRUE)
a<-table.row.end(a)
a<-table.row.start(a)
a<-table.element(a,'Time lag k',header=TRUE)
a<-table.element(a,hyperlink('basics.htm','ACF(k)','click here for more information about the Autocorrelation Function'),header=TRUE)
a<-table.element(a,'T-STAT',header=TRUE)
a<-table.element(a,'P-value',header=TRUE)
a<-table.row.end(a)
for (i in 2:(par1+1)) {
a<-table.row.start(a)
a<-table.element(a,i-1,header=TRUE)
a<-table.element(a,round(myacf[i],6))
mytstat <- myacf[i]*sqrtn
a<-table.element(a,round(mytstat,4))
a<-table.element(a,round(1-pt(abs(mytstat),lengthx),6))
a<-table.row.end(a)
}
a<-table.end(a)
table.save(a,file='mytable.tab')
a<-table.start()
a<-table.row.start(a)
a<-table.element(a,'Partial Autocorrelation Function',4,TRUE)
a<-table.row.end(a)
a<-table.row.start(a)
a<-table.element(a,'Time lag k',header=TRUE)
a<-table.element(a,hyperlink('basics.htm','PACF(k)','click here for more information about the Partial Autocorrelation Function'),header=TRUE)
a<-table.element(a,'T-STAT',header=TRUE)
a<-table.element(a,'P-value',header=TRUE)
a<-table.row.end(a)
for (i in 1:par1) {
a<-table.row.start(a)
a<-table.element(a,i,header=TRUE)
a<-table.element(a,round(mypacf[i],6))
mytstat <- mypacf[i]*sqrtn
a<-table.element(a,round(mytstat,4))
a<-table.element(a,round(1-pt(abs(mytstat),lengthx),6))
a<-table.row.end(a)
}
a<-table.end(a)
table.save(a,file='mytable1.tab')