Free Statistics

of Irreproducible Research!

Author's title

Author*Unverified author*
R Software Modulerwasp_autocorrelation.wasp
Title produced by software(Partial) Autocorrelation Function
Date of computationThu, 19 May 2011 09:34:47 +0000
Cite this page as followsStatistical Computations at FreeStatistics.org, Office for Research Development and Education, URL https://freestatistics.org/blog/index.php?v=date/2011/May/19/t1305797494wbmneusv0evcai3.htm/, Retrieved Sat, 11 May 2024 22:02:33 +0000
Statistical Computations at FreeStatistics.org, Office for Research Development and Education, URL https://freestatistics.org/blog/index.php?pk=121971, Retrieved Sat, 11 May 2024 22:02:33 +0000
QR Codes:

Original text written by user:
IsPrivate?No (this computation is public)
User-defined keywordsKDGP2W12
Estimated Impact110
Family? (F = Feedback message, R = changed R code, M = changed R Module, P = changed Parameters, D = changed Data)
-       [(Partial) Autocorrelation Function] [IKO opdracht 6BIS...] [2011-05-19 09:34:47] [3f8170910ab21fde7eba151af40022ac] [Current]
Feedback Forum

Post a new message
Dataseries X:
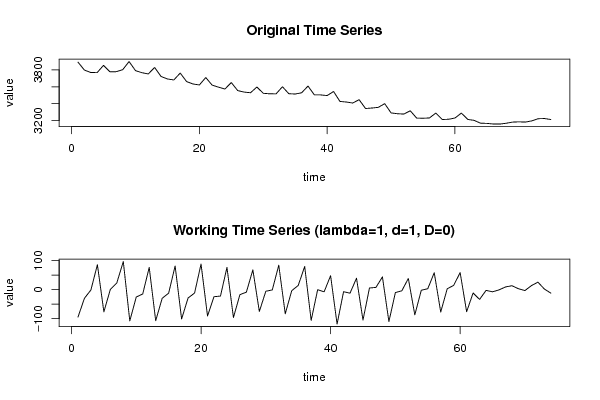
3893,9
3799,2
3769,6
3768,6
3854,9
3778,5
3779,7
3803,2
3900,3
3792,6
3767,4
3752,6
3829,6
3722,6
3692,9
3681
3762,9
3661,7
3633,1
3621,5
3710
3619,4
3595,2
3573,2
3650,1
3554,2
3537
3528,6
3597,1
3521,9
3516,5
3515,7
3600,2
3517,1
3513,7
3528,2
3608,3
3502,5
3502,5
3495,3
3543,8
3425,3
3418,4
3406,4
3446,1
3341,1
3347
3354,9
3399
3288,9
3279
3275,2
3314
3227,1
3225,3
3228,6
3287,1
3210,1
3213,1
3228
3287
3211
3199,8
3166,3
3164
3156,7
3156
3165,5
3179,2
3182,5
3179,5
3193,5
3219,6
3221,9
3210,1


Summary of computational transaction
Raw Inputview raw input (R code)
Raw Outputview raw output of R engine
Computing time3 seconds
R Server'Gwilym Jenkins' @ www.wessa.org

\begin{tabular}{lllllllll}
\hline
Summary of computational transaction \tabularnewline
Raw Input & view raw input (R code)  \tabularnewline
Raw Output & view raw output of R engine  \tabularnewline
Computing time & 3 seconds \tabularnewline
R Server & 'Gwilym Jenkins' @ www.wessa.org \tabularnewline
\hline
\end{tabular}
%Source: https://freestatistics.org/blog/index.php?pk=121971&T=0

[TABLE]
[ROW][C]Summary of computational transaction[/C][/ROW]
[ROW][C]Raw Input[/C][C]view raw input (R code) [/C][/ROW]
[ROW][C]Raw Output[/C][C]view raw output of R engine [/C][/ROW]
[ROW][C]Computing time[/C][C]3 seconds[/C][/ROW]
[ROW][C]R Server[/C][C]'Gwilym Jenkins' @ www.wessa.org[/C][/ROW]
[/TABLE]
Source: https://freestatistics.org/blog/index.php?pk=121971&T=0

Globally Unique Identifier (entire table): ba.freestatistics.org/blog/index.php?pk=121971&T=0

As an alternative you can also use a QR Code:  

The GUIDs for individual cells are displayed in the table below:

Summary of computational transaction
Raw Inputview raw input (R code)
Raw Outputview raw output of R engine
Computing time3 seconds
R Server'Gwilym Jenkins' @ www.wessa.org


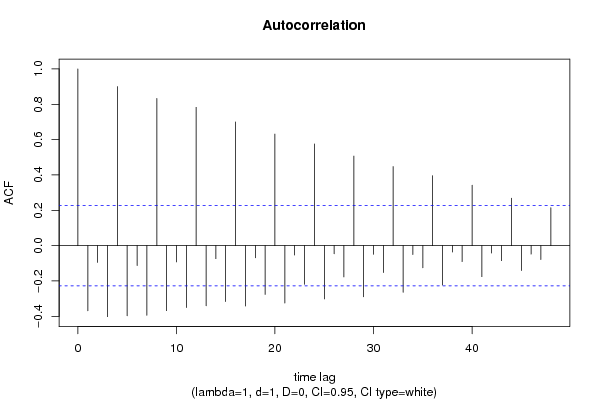
Autocorrelation Function
Time lag kACF(k)T-STATP-value
1-0.368936-3.17370.001097
2-0.094793-0.81540.208719
3-0.40189-3.45720.000454
40.9000997.74290
5-0.396702-3.41260.000523
6-0.112297-0.9660.168591
7-0.39423-3.39130.00056
80.8332077.16750
9-0.367669-3.16280.001133
10-0.09178-0.78950.216165
11-0.350177-3.01230.001773
120.7826516.73260
13-0.339798-2.92310.002298
14-0.073442-0.63180.264741
15-0.316155-2.71970.004069
160.699536.01760
17-0.341346-2.93640.002212
18-0.068885-0.59260.277638
19-0.275939-2.37370.010103
200.63115.42890
21-0.324229-2.78910.003358
22-0.052655-0.4530.325952
23-0.218907-1.88310.031807
240.5757334.95262e-06
25-0.301226-2.59120.005757
26-0.04633-0.39850.345689
27-0.176906-1.52180.066161
280.5067254.3592.1e-05
29-0.288859-2.48490.00761
30-0.048513-0.41730.338825
31-0.151683-1.30480.097998
320.4473263.8480.000125
33-0.264024-2.27120.013021
34-0.050455-0.4340.332764
35-0.125033-1.07560.142807
360.3952273.39990.000545
37-0.22309-1.91910.029415
38-0.036269-0.3120.37796
39-0.090319-0.77690.219833
400.3420742.94260.002172
41-0.175362-1.50850.067839
42-0.042147-0.36260.358982
43-0.085053-0.73170.233345
440.2683022.3080.011898
45-0.140471-1.20840.115374
46-0.047892-0.4120.340772
47-0.078812-0.6780.249955
480.2146381.84640.034418

\begin{tabular}{lllllllll}
\hline
Autocorrelation Function \tabularnewline
Time lag k & ACF(k) & T-STAT & P-value \tabularnewline
1 & -0.368936 & -3.1737 & 0.001097 \tabularnewline
2 & -0.094793 & -0.8154 & 0.208719 \tabularnewline
3 & -0.40189 & -3.4572 & 0.000454 \tabularnewline
4 & 0.900099 & 7.7429 & 0 \tabularnewline
5 & -0.396702 & -3.4126 & 0.000523 \tabularnewline
6 & -0.112297 & -0.966 & 0.168591 \tabularnewline
7 & -0.39423 & -3.3913 & 0.00056 \tabularnewline
8 & 0.833207 & 7.1675 & 0 \tabularnewline
9 & -0.367669 & -3.1628 & 0.001133 \tabularnewline
10 & -0.09178 & -0.7895 & 0.216165 \tabularnewline
11 & -0.350177 & -3.0123 & 0.001773 \tabularnewline
12 & 0.782651 & 6.7326 & 0 \tabularnewline
13 & -0.339798 & -2.9231 & 0.002298 \tabularnewline
14 & -0.073442 & -0.6318 & 0.264741 \tabularnewline
15 & -0.316155 & -2.7197 & 0.004069 \tabularnewline
16 & 0.69953 & 6.0176 & 0 \tabularnewline
17 & -0.341346 & -2.9364 & 0.002212 \tabularnewline
18 & -0.068885 & -0.5926 & 0.277638 \tabularnewline
19 & -0.275939 & -2.3737 & 0.010103 \tabularnewline
20 & 0.6311 & 5.4289 & 0 \tabularnewline
21 & -0.324229 & -2.7891 & 0.003358 \tabularnewline
22 & -0.052655 & -0.453 & 0.325952 \tabularnewline
23 & -0.218907 & -1.8831 & 0.031807 \tabularnewline
24 & 0.575733 & 4.9526 & 2e-06 \tabularnewline
25 & -0.301226 & -2.5912 & 0.005757 \tabularnewline
26 & -0.04633 & -0.3985 & 0.345689 \tabularnewline
27 & -0.176906 & -1.5218 & 0.066161 \tabularnewline
28 & 0.506725 & 4.359 & 2.1e-05 \tabularnewline
29 & -0.288859 & -2.4849 & 0.00761 \tabularnewline
30 & -0.048513 & -0.4173 & 0.338825 \tabularnewline
31 & -0.151683 & -1.3048 & 0.097998 \tabularnewline
32 & 0.447326 & 3.848 & 0.000125 \tabularnewline
33 & -0.264024 & -2.2712 & 0.013021 \tabularnewline
34 & -0.050455 & -0.434 & 0.332764 \tabularnewline
35 & -0.125033 & -1.0756 & 0.142807 \tabularnewline
36 & 0.395227 & 3.3999 & 0.000545 \tabularnewline
37 & -0.22309 & -1.9191 & 0.029415 \tabularnewline
38 & -0.036269 & -0.312 & 0.37796 \tabularnewline
39 & -0.090319 & -0.7769 & 0.219833 \tabularnewline
40 & 0.342074 & 2.9426 & 0.002172 \tabularnewline
41 & -0.175362 & -1.5085 & 0.067839 \tabularnewline
42 & -0.042147 & -0.3626 & 0.358982 \tabularnewline
43 & -0.085053 & -0.7317 & 0.233345 \tabularnewline
44 & 0.268302 & 2.308 & 0.011898 \tabularnewline
45 & -0.140471 & -1.2084 & 0.115374 \tabularnewline
46 & -0.047892 & -0.412 & 0.340772 \tabularnewline
47 & -0.078812 & -0.678 & 0.249955 \tabularnewline
48 & 0.214638 & 1.8464 & 0.034418 \tabularnewline
\hline
\end{tabular}
%Source: https://freestatistics.org/blog/index.php?pk=121971&T=1

[TABLE]
[ROW][C]Autocorrelation Function[/C][/ROW]
[ROW][C]Time lag k[/C][C]ACF(k)[/C][C]T-STAT[/C][C]P-value[/C][/ROW]
[ROW][C]1[/C][C]-0.368936[/C][C]-3.1737[/C][C]0.001097[/C][/ROW]
[ROW][C]2[/C][C]-0.094793[/C][C]-0.8154[/C][C]0.208719[/C][/ROW]
[ROW][C]3[/C][C]-0.40189[/C][C]-3.4572[/C][C]0.000454[/C][/ROW]
[ROW][C]4[/C][C]0.900099[/C][C]7.7429[/C][C]0[/C][/ROW]
[ROW][C]5[/C][C]-0.396702[/C][C]-3.4126[/C][C]0.000523[/C][/ROW]
[ROW][C]6[/C][C]-0.112297[/C][C]-0.966[/C][C]0.168591[/C][/ROW]
[ROW][C]7[/C][C]-0.39423[/C][C]-3.3913[/C][C]0.00056[/C][/ROW]
[ROW][C]8[/C][C]0.833207[/C][C]7.1675[/C][C]0[/C][/ROW]
[ROW][C]9[/C][C]-0.367669[/C][C]-3.1628[/C][C]0.001133[/C][/ROW]
[ROW][C]10[/C][C]-0.09178[/C][C]-0.7895[/C][C]0.216165[/C][/ROW]
[ROW][C]11[/C][C]-0.350177[/C][C]-3.0123[/C][C]0.001773[/C][/ROW]
[ROW][C]12[/C][C]0.782651[/C][C]6.7326[/C][C]0[/C][/ROW]
[ROW][C]13[/C][C]-0.339798[/C][C]-2.9231[/C][C]0.002298[/C][/ROW]
[ROW][C]14[/C][C]-0.073442[/C][C]-0.6318[/C][C]0.264741[/C][/ROW]
[ROW][C]15[/C][C]-0.316155[/C][C]-2.7197[/C][C]0.004069[/C][/ROW]
[ROW][C]16[/C][C]0.69953[/C][C]6.0176[/C][C]0[/C][/ROW]
[ROW][C]17[/C][C]-0.341346[/C][C]-2.9364[/C][C]0.002212[/C][/ROW]
[ROW][C]18[/C][C]-0.068885[/C][C]-0.5926[/C][C]0.277638[/C][/ROW]
[ROW][C]19[/C][C]-0.275939[/C][C]-2.3737[/C][C]0.010103[/C][/ROW]
[ROW][C]20[/C][C]0.6311[/C][C]5.4289[/C][C]0[/C][/ROW]
[ROW][C]21[/C][C]-0.324229[/C][C]-2.7891[/C][C]0.003358[/C][/ROW]
[ROW][C]22[/C][C]-0.052655[/C][C]-0.453[/C][C]0.325952[/C][/ROW]
[ROW][C]23[/C][C]-0.218907[/C][C]-1.8831[/C][C]0.031807[/C][/ROW]
[ROW][C]24[/C][C]0.575733[/C][C]4.9526[/C][C]2e-06[/C][/ROW]
[ROW][C]25[/C][C]-0.301226[/C][C]-2.5912[/C][C]0.005757[/C][/ROW]
[ROW][C]26[/C][C]-0.04633[/C][C]-0.3985[/C][C]0.345689[/C][/ROW]
[ROW][C]27[/C][C]-0.176906[/C][C]-1.5218[/C][C]0.066161[/C][/ROW]
[ROW][C]28[/C][C]0.506725[/C][C]4.359[/C][C]2.1e-05[/C][/ROW]
[ROW][C]29[/C][C]-0.288859[/C][C]-2.4849[/C][C]0.00761[/C][/ROW]
[ROW][C]30[/C][C]-0.048513[/C][C]-0.4173[/C][C]0.338825[/C][/ROW]
[ROW][C]31[/C][C]-0.151683[/C][C]-1.3048[/C][C]0.097998[/C][/ROW]
[ROW][C]32[/C][C]0.447326[/C][C]3.848[/C][C]0.000125[/C][/ROW]
[ROW][C]33[/C][C]-0.264024[/C][C]-2.2712[/C][C]0.013021[/C][/ROW]
[ROW][C]34[/C][C]-0.050455[/C][C]-0.434[/C][C]0.332764[/C][/ROW]
[ROW][C]35[/C][C]-0.125033[/C][C]-1.0756[/C][C]0.142807[/C][/ROW]
[ROW][C]36[/C][C]0.395227[/C][C]3.3999[/C][C]0.000545[/C][/ROW]
[ROW][C]37[/C][C]-0.22309[/C][C]-1.9191[/C][C]0.029415[/C][/ROW]
[ROW][C]38[/C][C]-0.036269[/C][C]-0.312[/C][C]0.37796[/C][/ROW]
[ROW][C]39[/C][C]-0.090319[/C][C]-0.7769[/C][C]0.219833[/C][/ROW]
[ROW][C]40[/C][C]0.342074[/C][C]2.9426[/C][C]0.002172[/C][/ROW]
[ROW][C]41[/C][C]-0.175362[/C][C]-1.5085[/C][C]0.067839[/C][/ROW]
[ROW][C]42[/C][C]-0.042147[/C][C]-0.3626[/C][C]0.358982[/C][/ROW]
[ROW][C]43[/C][C]-0.085053[/C][C]-0.7317[/C][C]0.233345[/C][/ROW]
[ROW][C]44[/C][C]0.268302[/C][C]2.308[/C][C]0.011898[/C][/ROW]
[ROW][C]45[/C][C]-0.140471[/C][C]-1.2084[/C][C]0.115374[/C][/ROW]
[ROW][C]46[/C][C]-0.047892[/C][C]-0.412[/C][C]0.340772[/C][/ROW]
[ROW][C]47[/C][C]-0.078812[/C][C]-0.678[/C][C]0.249955[/C][/ROW]
[ROW][C]48[/C][C]0.214638[/C][C]1.8464[/C][C]0.034418[/C][/ROW]
[/TABLE]
Source: https://freestatistics.org/blog/index.php?pk=121971&T=1

Globally Unique Identifier (entire table): ba.freestatistics.org/blog/index.php?pk=121971&T=1

As an alternative you can also use a QR Code:  

The GUIDs for individual cells are displayed in the table below:

Autocorrelation Function
Time lag kACF(k)T-STATP-value
1-0.368936-3.17370.001097
2-0.094793-0.81540.208719
3-0.40189-3.45720.000454
40.9000997.74290
5-0.396702-3.41260.000523
6-0.112297-0.9660.168591
7-0.39423-3.39130.00056
80.8332077.16750
9-0.367669-3.16280.001133
10-0.09178-0.78950.216165
11-0.350177-3.01230.001773
120.7826516.73260
13-0.339798-2.92310.002298
14-0.073442-0.63180.264741
15-0.316155-2.71970.004069
160.699536.01760
17-0.341346-2.93640.002212
18-0.068885-0.59260.277638
19-0.275939-2.37370.010103
200.63115.42890
21-0.324229-2.78910.003358
22-0.052655-0.4530.325952
23-0.218907-1.88310.031807
240.5757334.95262e-06
25-0.301226-2.59120.005757
26-0.04633-0.39850.345689
27-0.176906-1.52180.066161
280.5067254.3592.1e-05
29-0.288859-2.48490.00761
30-0.048513-0.41730.338825
31-0.151683-1.30480.097998
320.4473263.8480.000125
33-0.264024-2.27120.013021
34-0.050455-0.4340.332764
35-0.125033-1.07560.142807
360.3952273.39990.000545
37-0.22309-1.91910.029415
38-0.036269-0.3120.37796
39-0.090319-0.77690.219833
400.3420742.94260.002172
41-0.175362-1.50850.067839
42-0.042147-0.36260.358982
43-0.085053-0.73170.233345
440.2683022.3080.011898
45-0.140471-1.20840.115374
46-0.047892-0.4120.340772
47-0.078812-0.6780.249955
480.2146381.84640.034418


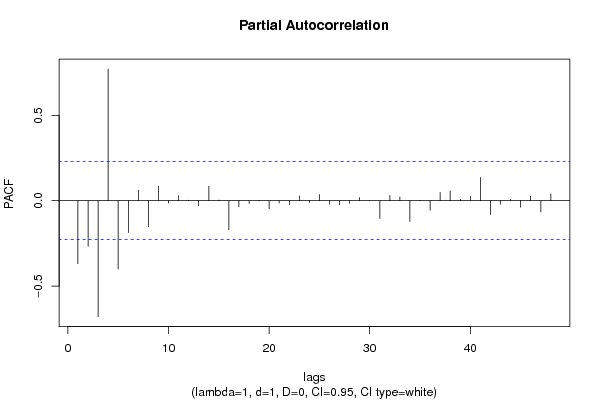
Partial Autocorrelation Function
Time lag kPACF(k)T-STATP-value
1-0.368936-3.17370.001097
2-0.267288-2.29930.012156
3-0.679187-5.84260
40.7711136.63340
5-0.400232-3.44290.000475
6-0.186221-1.60190.056715
70.0612730.52710.299855
8-0.15215-1.30880.097319
90.0839660.72230.236192
10-0.014017-0.12060.452175
110.0278630.23970.405618
120.0025350.02180.491332
13-0.029959-0.25770.39867
140.0834740.71810.237488
150.0033130.02850.488671
16-0.170852-1.46970.072937
17-0.03553-0.30560.380369
18-0.016113-0.13860.445067
19-0.001315-0.01130.495503
20-0.046938-0.40380.343772
21-0.013361-0.11490.454405
22-0.024416-0.210.417108
230.0270.23230.408489
24-0.010678-0.09190.463531
250.0355480.30580.38031
26-0.020574-0.1770.430002
27-0.023867-0.20530.418946
28-0.014982-0.12890.448901
290.0181140.15580.438298
300.0008280.00710.497167
31-0.105003-0.90330.184658
320.0300530.25850.39836
330.020570.17690.430017
34-0.121385-1.04420.149898
35-0.000804-0.00690.497251
36-0.056402-0.48520.314489
370.0474280.4080.342228
380.0567920.48850.313306
390.008440.07260.471158
400.024330.20930.417397
410.1352571.16350.124177
42-0.081027-0.6970.243987
43-0.020219-0.17390.431197
440.006810.05860.476723
45-0.038044-0.32730.372196
460.0257550.22160.412636
47-0.065902-0.56690.286245
480.0386590.33260.370203

\begin{tabular}{lllllllll}
\hline
Partial Autocorrelation Function \tabularnewline
Time lag k & PACF(k) & T-STAT & P-value \tabularnewline
1 & -0.368936 & -3.1737 & 0.001097 \tabularnewline
2 & -0.267288 & -2.2993 & 0.012156 \tabularnewline
3 & -0.679187 & -5.8426 & 0 \tabularnewline
4 & 0.771113 & 6.6334 & 0 \tabularnewline
5 & -0.400232 & -3.4429 & 0.000475 \tabularnewline
6 & -0.186221 & -1.6019 & 0.056715 \tabularnewline
7 & 0.061273 & 0.5271 & 0.299855 \tabularnewline
8 & -0.15215 & -1.3088 & 0.097319 \tabularnewline
9 & 0.083966 & 0.7223 & 0.236192 \tabularnewline
10 & -0.014017 & -0.1206 & 0.452175 \tabularnewline
11 & 0.027863 & 0.2397 & 0.405618 \tabularnewline
12 & 0.002535 & 0.0218 & 0.491332 \tabularnewline
13 & -0.029959 & -0.2577 & 0.39867 \tabularnewline
14 & 0.083474 & 0.7181 & 0.237488 \tabularnewline
15 & 0.003313 & 0.0285 & 0.488671 \tabularnewline
16 & -0.170852 & -1.4697 & 0.072937 \tabularnewline
17 & -0.03553 & -0.3056 & 0.380369 \tabularnewline
18 & -0.016113 & -0.1386 & 0.445067 \tabularnewline
19 & -0.001315 & -0.0113 & 0.495503 \tabularnewline
20 & -0.046938 & -0.4038 & 0.343772 \tabularnewline
21 & -0.013361 & -0.1149 & 0.454405 \tabularnewline
22 & -0.024416 & -0.21 & 0.417108 \tabularnewline
23 & 0.027 & 0.2323 & 0.408489 \tabularnewline
24 & -0.010678 & -0.0919 & 0.463531 \tabularnewline
25 & 0.035548 & 0.3058 & 0.38031 \tabularnewline
26 & -0.020574 & -0.177 & 0.430002 \tabularnewline
27 & -0.023867 & -0.2053 & 0.418946 \tabularnewline
28 & -0.014982 & -0.1289 & 0.448901 \tabularnewline
29 & 0.018114 & 0.1558 & 0.438298 \tabularnewline
30 & 0.000828 & 0.0071 & 0.497167 \tabularnewline
31 & -0.105003 & -0.9033 & 0.184658 \tabularnewline
32 & 0.030053 & 0.2585 & 0.39836 \tabularnewline
33 & 0.02057 & 0.1769 & 0.430017 \tabularnewline
34 & -0.121385 & -1.0442 & 0.149898 \tabularnewline
35 & -0.000804 & -0.0069 & 0.497251 \tabularnewline
36 & -0.056402 & -0.4852 & 0.314489 \tabularnewline
37 & 0.047428 & 0.408 & 0.342228 \tabularnewline
38 & 0.056792 & 0.4885 & 0.313306 \tabularnewline
39 & 0.00844 & 0.0726 & 0.471158 \tabularnewline
40 & 0.02433 & 0.2093 & 0.417397 \tabularnewline
41 & 0.135257 & 1.1635 & 0.124177 \tabularnewline
42 & -0.081027 & -0.697 & 0.243987 \tabularnewline
43 & -0.020219 & -0.1739 & 0.431197 \tabularnewline
44 & 0.00681 & 0.0586 & 0.476723 \tabularnewline
45 & -0.038044 & -0.3273 & 0.372196 \tabularnewline
46 & 0.025755 & 0.2216 & 0.412636 \tabularnewline
47 & -0.065902 & -0.5669 & 0.286245 \tabularnewline
48 & 0.038659 & 0.3326 & 0.370203 \tabularnewline
\hline
\end{tabular}
%Source: https://freestatistics.org/blog/index.php?pk=121971&T=2

[TABLE]
[ROW][C]Partial Autocorrelation Function[/C][/ROW]
[ROW][C]Time lag k[/C][C]PACF(k)[/C][C]T-STAT[/C][C]P-value[/C][/ROW]
[ROW][C]1[/C][C]-0.368936[/C][C]-3.1737[/C][C]0.001097[/C][/ROW]
[ROW][C]2[/C][C]-0.267288[/C][C]-2.2993[/C][C]0.012156[/C][/ROW]
[ROW][C]3[/C][C]-0.679187[/C][C]-5.8426[/C][C]0[/C][/ROW]
[ROW][C]4[/C][C]0.771113[/C][C]6.6334[/C][C]0[/C][/ROW]
[ROW][C]5[/C][C]-0.400232[/C][C]-3.4429[/C][C]0.000475[/C][/ROW]
[ROW][C]6[/C][C]-0.186221[/C][C]-1.6019[/C][C]0.056715[/C][/ROW]
[ROW][C]7[/C][C]0.061273[/C][C]0.5271[/C][C]0.299855[/C][/ROW]
[ROW][C]8[/C][C]-0.15215[/C][C]-1.3088[/C][C]0.097319[/C][/ROW]
[ROW][C]9[/C][C]0.083966[/C][C]0.7223[/C][C]0.236192[/C][/ROW]
[ROW][C]10[/C][C]-0.014017[/C][C]-0.1206[/C][C]0.452175[/C][/ROW]
[ROW][C]11[/C][C]0.027863[/C][C]0.2397[/C][C]0.405618[/C][/ROW]
[ROW][C]12[/C][C]0.002535[/C][C]0.0218[/C][C]0.491332[/C][/ROW]
[ROW][C]13[/C][C]-0.029959[/C][C]-0.2577[/C][C]0.39867[/C][/ROW]
[ROW][C]14[/C][C]0.083474[/C][C]0.7181[/C][C]0.237488[/C][/ROW]
[ROW][C]15[/C][C]0.003313[/C][C]0.0285[/C][C]0.488671[/C][/ROW]
[ROW][C]16[/C][C]-0.170852[/C][C]-1.4697[/C][C]0.072937[/C][/ROW]
[ROW][C]17[/C][C]-0.03553[/C][C]-0.3056[/C][C]0.380369[/C][/ROW]
[ROW][C]18[/C][C]-0.016113[/C][C]-0.1386[/C][C]0.445067[/C][/ROW]
[ROW][C]19[/C][C]-0.001315[/C][C]-0.0113[/C][C]0.495503[/C][/ROW]
[ROW][C]20[/C][C]-0.046938[/C][C]-0.4038[/C][C]0.343772[/C][/ROW]
[ROW][C]21[/C][C]-0.013361[/C][C]-0.1149[/C][C]0.454405[/C][/ROW]
[ROW][C]22[/C][C]-0.024416[/C][C]-0.21[/C][C]0.417108[/C][/ROW]
[ROW][C]23[/C][C]0.027[/C][C]0.2323[/C][C]0.408489[/C][/ROW]
[ROW][C]24[/C][C]-0.010678[/C][C]-0.0919[/C][C]0.463531[/C][/ROW]
[ROW][C]25[/C][C]0.035548[/C][C]0.3058[/C][C]0.38031[/C][/ROW]
[ROW][C]26[/C][C]-0.020574[/C][C]-0.177[/C][C]0.430002[/C][/ROW]
[ROW][C]27[/C][C]-0.023867[/C][C]-0.2053[/C][C]0.418946[/C][/ROW]
[ROW][C]28[/C][C]-0.014982[/C][C]-0.1289[/C][C]0.448901[/C][/ROW]
[ROW][C]29[/C][C]0.018114[/C][C]0.1558[/C][C]0.438298[/C][/ROW]
[ROW][C]30[/C][C]0.000828[/C][C]0.0071[/C][C]0.497167[/C][/ROW]
[ROW][C]31[/C][C]-0.105003[/C][C]-0.9033[/C][C]0.184658[/C][/ROW]
[ROW][C]32[/C][C]0.030053[/C][C]0.2585[/C][C]0.39836[/C][/ROW]
[ROW][C]33[/C][C]0.02057[/C][C]0.1769[/C][C]0.430017[/C][/ROW]
[ROW][C]34[/C][C]-0.121385[/C][C]-1.0442[/C][C]0.149898[/C][/ROW]
[ROW][C]35[/C][C]-0.000804[/C][C]-0.0069[/C][C]0.497251[/C][/ROW]
[ROW][C]36[/C][C]-0.056402[/C][C]-0.4852[/C][C]0.314489[/C][/ROW]
[ROW][C]37[/C][C]0.047428[/C][C]0.408[/C][C]0.342228[/C][/ROW]
[ROW][C]38[/C][C]0.056792[/C][C]0.4885[/C][C]0.313306[/C][/ROW]
[ROW][C]39[/C][C]0.00844[/C][C]0.0726[/C][C]0.471158[/C][/ROW]
[ROW][C]40[/C][C]0.02433[/C][C]0.2093[/C][C]0.417397[/C][/ROW]
[ROW][C]41[/C][C]0.135257[/C][C]1.1635[/C][C]0.124177[/C][/ROW]
[ROW][C]42[/C][C]-0.081027[/C][C]-0.697[/C][C]0.243987[/C][/ROW]
[ROW][C]43[/C][C]-0.020219[/C][C]-0.1739[/C][C]0.431197[/C][/ROW]
[ROW][C]44[/C][C]0.00681[/C][C]0.0586[/C][C]0.476723[/C][/ROW]
[ROW][C]45[/C][C]-0.038044[/C][C]-0.3273[/C][C]0.372196[/C][/ROW]
[ROW][C]46[/C][C]0.025755[/C][C]0.2216[/C][C]0.412636[/C][/ROW]
[ROW][C]47[/C][C]-0.065902[/C][C]-0.5669[/C][C]0.286245[/C][/ROW]
[ROW][C]48[/C][C]0.038659[/C][C]0.3326[/C][C]0.370203[/C][/ROW]
[/TABLE]
Source: https://freestatistics.org/blog/index.php?pk=121971&T=2

Globally Unique Identifier (entire table): ba.freestatistics.org/blog/index.php?pk=121971&T=2

As an alternative you can also use a QR Code:  

The GUIDs for individual cells are displayed in the table below:

Partial Autocorrelation Function
Time lag kPACF(k)T-STATP-value
1-0.368936-3.17370.001097
2-0.267288-2.29930.012156
3-0.679187-5.84260
40.7711136.63340
5-0.400232-3.44290.000475
6-0.186221-1.60190.056715
70.0612730.52710.299855
8-0.15215-1.30880.097319
90.0839660.72230.236192
10-0.014017-0.12060.452175
110.0278630.23970.405618
120.0025350.02180.491332
13-0.029959-0.25770.39867
140.0834740.71810.237488
150.0033130.02850.488671
16-0.170852-1.46970.072937
17-0.03553-0.30560.380369
18-0.016113-0.13860.445067
19-0.001315-0.01130.495503
20-0.046938-0.40380.343772
21-0.013361-0.11490.454405
22-0.024416-0.210.417108
230.0270.23230.408489
24-0.010678-0.09190.463531
250.0355480.30580.38031
26-0.020574-0.1770.430002
27-0.023867-0.20530.418946
28-0.014982-0.12890.448901
290.0181140.15580.438298
300.0008280.00710.497167
31-0.105003-0.90330.184658
320.0300530.25850.39836
330.020570.17690.430017
34-0.121385-1.04420.149898
35-0.000804-0.00690.497251
36-0.056402-0.48520.314489
370.0474280.4080.342228
380.0567920.48850.313306
390.008440.07260.471158
400.024330.20930.417397
410.1352571.16350.124177
42-0.081027-0.6970.243987
43-0.020219-0.17390.431197
440.006810.05860.476723
45-0.038044-0.32730.372196
460.0257550.22160.412636
47-0.065902-0.56690.286245
480.0386590.33260.370203


Parameters (Session):
par1 = 48 ; par2 = 1 ; par3 = 1 ; par4 = 0 ; par5 = 12 ; par6 = White Noise ; par7 = 0.95 ;
Parameters (R input):
par1 = 48 ; par2 = 1 ; par3 = 1 ; par4 = 0 ; par5 = 12 ; par6 = White Noise ; par7 = 0.95 ; par8 = ;
R code (references can be found in the software module):
if (par1 == 'Default') {
par1 = 10*log10(length(x))
} else {
par1 <- as.numeric(par1)
}
par2 <- as.numeric(par2)
par3 <- as.numeric(par3)
par4 <- as.numeric(par4)
par5 <- as.numeric(par5)
if (par6 == 'White Noise') par6 <- 'white' else par6 <- 'ma'
par7 <- as.numeric(par7)
if (par8 != '') par8 <- as.numeric(par8)
ox <- x
if (par8 == '') {
if (par2 == 0) {
x <- log(x)
} else {
x <- (x ^ par2 - 1) / par2
}
} else {
x <- log(x,base=par8)
}
if (par3 > 0) x <- diff(x,lag=1,difference=par3)
if (par4 > 0) x <- diff(x,lag=par5,difference=par4)
bitmap(file='picts.png')
op <- par(mfrow=c(2,1))
plot(ox,type='l',main='Original Time Series',xlab='time',ylab='value')
if (par8=='') {
mytitle <- paste('Working Time Series (lambda=',par2,', d=',par3,', D=',par4,')',sep='')
mysub <- paste('(lambda=',par2,', d=',par3,', D=',par4,', CI=', par7, ', CI type=',par6,')',sep='')
} else {
mytitle <- paste('Working Time Series (base=',par8,', d=',par3,', D=',par4,')',sep='')
mysub <- paste('(base=',par8,', d=',par3,', D=',par4,', CI=', par7, ', CI type=',par6,')',sep='')
}
plot(x,type='l', main=mytitle,xlab='time',ylab='value')
par(op)
dev.off()
bitmap(file='pic1.png')
racf <- acf(x, par1, main='Autocorrelation', xlab='time lag', ylab='ACF', ci.type=par6, ci=par7, sub=mysub)
dev.off()
bitmap(file='pic2.png')
rpacf <- pacf(x,par1,main='Partial Autocorrelation',xlab='lags',ylab='PACF',sub=mysub)
dev.off()
(myacf <- c(racf$acf))
(mypacf <- c(rpacf$acf))
lengthx <- length(x)
sqrtn <- sqrt(lengthx)
load(file='createtable')
a<-table.start()
a<-table.row.start(a)
a<-table.element(a,'Autocorrelation Function',4,TRUE)
a<-table.row.end(a)
a<-table.row.start(a)
a<-table.element(a,'Time lag k',header=TRUE)
a<-table.element(a,hyperlink('basics.htm','ACF(k)','click here for more information about the Autocorrelation Function'),header=TRUE)
a<-table.element(a,'T-STAT',header=TRUE)
a<-table.element(a,'P-value',header=TRUE)
a<-table.row.end(a)
for (i in 2:(par1+1)) {
a<-table.row.start(a)
a<-table.element(a,i-1,header=TRUE)
a<-table.element(a,round(myacf[i],6))
mytstat <- myacf[i]*sqrtn
a<-table.element(a,round(mytstat,4))
a<-table.element(a,round(1-pt(abs(mytstat),lengthx),6))
a<-table.row.end(a)
}
a<-table.end(a)
table.save(a,file='mytable.tab')
a<-table.start()
a<-table.row.start(a)
a<-table.element(a,'Partial Autocorrelation Function',4,TRUE)
a<-table.row.end(a)
a<-table.row.start(a)
a<-table.element(a,'Time lag k',header=TRUE)
a<-table.element(a,hyperlink('basics.htm','PACF(k)','click here for more information about the Partial Autocorrelation Function'),header=TRUE)
a<-table.element(a,'T-STAT',header=TRUE)
a<-table.element(a,'P-value',header=TRUE)
a<-table.row.end(a)
for (i in 1:par1) {
a<-table.row.start(a)
a<-table.element(a,i,header=TRUE)
a<-table.element(a,round(mypacf[i],6))
mytstat <- mypacf[i]*sqrtn
a<-table.element(a,round(mytstat,4))
a<-table.element(a,round(1-pt(abs(mytstat),lengthx),6))
a<-table.row.end(a)
}
a<-table.end(a)
table.save(a,file='mytable1.tab')