Free Statistics

of Irreproducible Research!

Author's title

Author*Unverified author*
R Software Modulerwasp_exponentialsmoothing.wasp
Title produced by softwareExponential Smoothing
Date of computationWed, 18 May 2011 19:19:34 +0000
Cite this page as followsStatistical Computations at FreeStatistics.org, Office for Research Development and Education, URL https://freestatistics.org/blog/index.php?v=date/2011/May/18/t1305746145jho1v4uzf977gdz.htm/, Retrieved Tue, 14 May 2024 19:43:23 +0000
Statistical Computations at FreeStatistics.org, Office for Research Development and Education, URL https://freestatistics.org/blog/index.php?pk=121919, Retrieved Tue, 14 May 2024 19:43:23 +0000
QR Codes:

Original text written by user:
IsPrivate?No (this computation is public)
User-defined keywordsKDGP2W102
Estimated Impact70
Family? (F = Feedback message, R = changed R code, M = changed R Module, P = changed Parameters, D = changed Data)
-       [Exponential Smoothing] [Inleiding kwantit...] [2011-05-18 19:19:34] [48e99ac80bea5c5cf1b062f9f0aed73c] [Current]
Feedback Forum

Post a new message
Dataseries X:
130
127
122
117
112
113
149
157
157
147
137
132
125
123
117
114
111
112
144
150
149
134
123
116
117
111
105
102
95
93
124
130
124
115
106
105
105
101
95
93
84
87
116
120
117
109
105
107
109
109
108
107
99
103
131
137
135
124
118
121
121
118
113
107
100
102
130
136
133
120
112
109
110


Summary of computational transaction
Raw Inputview raw input (R code)
Raw Outputview raw output of R engine
Computing time2 seconds
R Server'RServer@AstonUniversity' @ vre.aston.ac.uk

\begin{tabular}{lllllllll}
\hline
Summary of computational transaction \tabularnewline
Raw Input & view raw input (R code)  \tabularnewline
Raw Output & view raw output of R engine  \tabularnewline
Computing time & 2 seconds \tabularnewline
R Server & 'RServer@AstonUniversity' @ vre.aston.ac.uk \tabularnewline
\hline
\end{tabular}
%Source: https://freestatistics.org/blog/index.php?pk=121919&T=0

[TABLE]
[ROW][C]Summary of computational transaction[/C][/ROW]
[ROW][C]Raw Input[/C][C]view raw input (R code) [/C][/ROW]
[ROW][C]Raw Output[/C][C]view raw output of R engine [/C][/ROW]
[ROW][C]Computing time[/C][C]2 seconds[/C][/ROW]
[ROW][C]R Server[/C][C]'RServer@AstonUniversity' @ vre.aston.ac.uk[/C][/ROW]
[/TABLE]
Source: https://freestatistics.org/blog/index.php?pk=121919&T=0

Globally Unique Identifier (entire table): ba.freestatistics.org/blog/index.php?pk=121919&T=0

As an alternative you can also use a QR Code:  

The GUIDs for individual cells are displayed in the table below:

Summary of computational transaction
Raw Inputview raw input (R code)
Raw Outputview raw output of R engine
Computing time2 seconds
R Server'RServer@AstonUniversity' @ vre.aston.ac.uk


Estimated Parameters of Exponential Smoothing
ParameterValue
alpha0.731422447276466
beta0
gamma1

\begin{tabular}{lllllllll}
\hline
Estimated Parameters of Exponential Smoothing \tabularnewline
Parameter & Value \tabularnewline
alpha & 0.731422447276466 \tabularnewline
beta & 0 \tabularnewline
gamma & 1 \tabularnewline
\hline
\end{tabular}
%Source: https://freestatistics.org/blog/index.php?pk=121919&T=1

[TABLE]
[ROW][C]Estimated Parameters of Exponential Smoothing[/C][/ROW]
[ROW][C]Parameter[/C][C]Value[/C][/ROW]
[ROW][C]alpha[/C][C]0.731422447276466[/C][/ROW]
[ROW][C]beta[/C][C]0[/C][/ROW]
[ROW][C]gamma[/C][C]1[/C][/ROW]
[/TABLE]
Source: https://freestatistics.org/blog/index.php?pk=121919&T=1

Globally Unique Identifier (entire table): ba.freestatistics.org/blog/index.php?pk=121919&T=1

As an alternative you can also use a QR Code:  

The GUIDs for individual cells are displayed in the table below:

Estimated Parameters of Exponential Smoothing
ParameterValue
alpha0.731422447276466
beta0
gamma1


Interpolation Forecasts of Exponential Smoothing
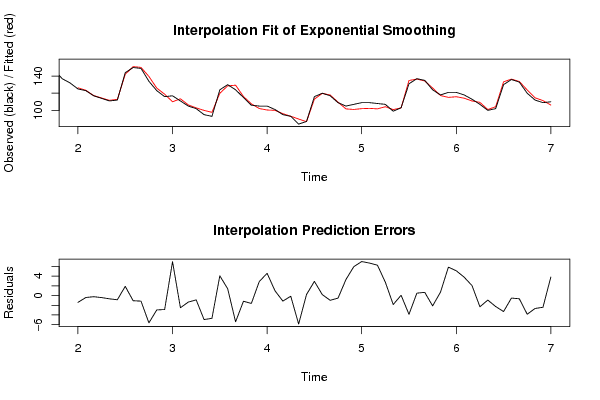
tObservedFittedResiduals
13125126.406914906761-1.40691490676097
14123123.400619436619-0.40061943661911
15117117.241149784032-0.241149784032359
16114114.419213819381-0.419213819381284
17111111.676037121651-0.67603712165095
18112112.871247286712-0.87124728671185
19144142.1015347584371.89846524156337
20150151.064547224493-1.0645472244926
21149150.153237817933-1.15323781793316
22134139.628310569989-5.62831056998888
23123125.963644656578-2.9636446565778
24116118.881714793646-2.88171479364642
25117110.0115981436776.98840185632255
26111113.515846692458-2.51584669245803
27105106.349292431963-1.34929243196316
28102102.895468586704-0.895468586704055
299599.9507895082191-4.95078950821915
309397.6946890861727-4.69468908617269
31124119.9360062831094.06399371689115
32130128.6116099040081.38839009599161
33124129.414670483044-5.41467048304415
34115116.170198190924-1.17019819092415
35106107.633831960806-1.63383196080576
36105102.1301100118982.86988998810186
37105100.4140579664414.58594203355922
38101100.0194008283540.980599171645864
399596.1450804252167-1.14508042521666
409393.1394583879027-0.139458387902749
418489.8746695676071-5.87466956760709
428786.78752951345180.212470486548156
43116113.0855874704052.91441252959457
44120119.8065168456550.193483154345017
45117117.981204792318-0.98120479231791
46109109.531589993709-0.531589993708678
47105101.7059949526863.29400504731413
48107101.0476669388395.95233306116117
49109101.9960428293967.00395717060398
50109102.3134352887876.686564711213
51108101.7474519396926.2525480603076
52107104.2456781496592.75432185034096
5399100.852089847908-1.85208984790813
54103102.9420850374290.057914962571374
55131134.870828556147-3.87082855614662
56137136.5086554740.491344526000177
57135134.3403018914560.659698108544177
58124126.130263846303-2.13026384630341
59118117.2935074163550.706492583644916
60121115.1537861102035.84621388979744
61121115.8980264618895.10197353811108
62118114.2157900835963.78420991640445
63113110.9558588922812.04414110771935
64107109.314705583708-2.31470558370788
65100100.933190007623-0.933190007623054
66102104.263424413169-2.26342441316901
67130133.297513719389-3.29751371938923
68136136.520500071832-0.52050007183189
69133133.668778768009-0.66877876800865
70120123.851070132863-3.85107013286331
71112114.660921670236-2.66092167023643
72109111.420327436684-2.42032743668361
73110106.1853655128123.81463448718789

\begin{tabular}{lllllllll}
\hline
Interpolation Forecasts of Exponential Smoothing \tabularnewline
t & Observed & Fitted & Residuals \tabularnewline
13 & 125 & 126.406914906761 & -1.40691490676097 \tabularnewline
14 & 123 & 123.400619436619 & -0.40061943661911 \tabularnewline
15 & 117 & 117.241149784032 & -0.241149784032359 \tabularnewline
16 & 114 & 114.419213819381 & -0.419213819381284 \tabularnewline
17 & 111 & 111.676037121651 & -0.67603712165095 \tabularnewline
18 & 112 & 112.871247286712 & -0.87124728671185 \tabularnewline
19 & 144 & 142.101534758437 & 1.89846524156337 \tabularnewline
20 & 150 & 151.064547224493 & -1.0645472244926 \tabularnewline
21 & 149 & 150.153237817933 & -1.15323781793316 \tabularnewline
22 & 134 & 139.628310569989 & -5.62831056998888 \tabularnewline
23 & 123 & 125.963644656578 & -2.9636446565778 \tabularnewline
24 & 116 & 118.881714793646 & -2.88171479364642 \tabularnewline
25 & 117 & 110.011598143677 & 6.98840185632255 \tabularnewline
26 & 111 & 113.515846692458 & -2.51584669245803 \tabularnewline
27 & 105 & 106.349292431963 & -1.34929243196316 \tabularnewline
28 & 102 & 102.895468586704 & -0.895468586704055 \tabularnewline
29 & 95 & 99.9507895082191 & -4.95078950821915 \tabularnewline
30 & 93 & 97.6946890861727 & -4.69468908617269 \tabularnewline
31 & 124 & 119.936006283109 & 4.06399371689115 \tabularnewline
32 & 130 & 128.611609904008 & 1.38839009599161 \tabularnewline
33 & 124 & 129.414670483044 & -5.41467048304415 \tabularnewline
34 & 115 & 116.170198190924 & -1.17019819092415 \tabularnewline
35 & 106 & 107.633831960806 & -1.63383196080576 \tabularnewline
36 & 105 & 102.130110011898 & 2.86988998810186 \tabularnewline
37 & 105 & 100.414057966441 & 4.58594203355922 \tabularnewline
38 & 101 & 100.019400828354 & 0.980599171645864 \tabularnewline
39 & 95 & 96.1450804252167 & -1.14508042521666 \tabularnewline
40 & 93 & 93.1394583879027 & -0.139458387902749 \tabularnewline
41 & 84 & 89.8746695676071 & -5.87466956760709 \tabularnewline
42 & 87 & 86.7875295134518 & 0.212470486548156 \tabularnewline
43 & 116 & 113.085587470405 & 2.91441252959457 \tabularnewline
44 & 120 & 119.806516845655 & 0.193483154345017 \tabularnewline
45 & 117 & 117.981204792318 & -0.98120479231791 \tabularnewline
46 & 109 & 109.531589993709 & -0.531589993708678 \tabularnewline
47 & 105 & 101.705994952686 & 3.29400504731413 \tabularnewline
48 & 107 & 101.047666938839 & 5.95233306116117 \tabularnewline
49 & 109 & 101.996042829396 & 7.00395717060398 \tabularnewline
50 & 109 & 102.313435288787 & 6.686564711213 \tabularnewline
51 & 108 & 101.747451939692 & 6.2525480603076 \tabularnewline
52 & 107 & 104.245678149659 & 2.75432185034096 \tabularnewline
53 & 99 & 100.852089847908 & -1.85208984790813 \tabularnewline
54 & 103 & 102.942085037429 & 0.057914962571374 \tabularnewline
55 & 131 & 134.870828556147 & -3.87082855614662 \tabularnewline
56 & 137 & 136.508655474 & 0.491344526000177 \tabularnewline
57 & 135 & 134.340301891456 & 0.659698108544177 \tabularnewline
58 & 124 & 126.130263846303 & -2.13026384630341 \tabularnewline
59 & 118 & 117.293507416355 & 0.706492583644916 \tabularnewline
60 & 121 & 115.153786110203 & 5.84621388979744 \tabularnewline
61 & 121 & 115.898026461889 & 5.10197353811108 \tabularnewline
62 & 118 & 114.215790083596 & 3.78420991640445 \tabularnewline
63 & 113 & 110.955858892281 & 2.04414110771935 \tabularnewline
64 & 107 & 109.314705583708 & -2.31470558370788 \tabularnewline
65 & 100 & 100.933190007623 & -0.933190007623054 \tabularnewline
66 & 102 & 104.263424413169 & -2.26342441316901 \tabularnewline
67 & 130 & 133.297513719389 & -3.29751371938923 \tabularnewline
68 & 136 & 136.520500071832 & -0.52050007183189 \tabularnewline
69 & 133 & 133.668778768009 & -0.66877876800865 \tabularnewline
70 & 120 & 123.851070132863 & -3.85107013286331 \tabularnewline
71 & 112 & 114.660921670236 & -2.66092167023643 \tabularnewline
72 & 109 & 111.420327436684 & -2.42032743668361 \tabularnewline
73 & 110 & 106.185365512812 & 3.81463448718789 \tabularnewline
\hline
\end{tabular}
%Source: https://freestatistics.org/blog/index.php?pk=121919&T=2

[TABLE]
[ROW][C]Interpolation Forecasts of Exponential Smoothing[/C][/ROW]
[ROW][C]t[/C][C]Observed[/C][C]Fitted[/C][C]Residuals[/C][/ROW]
[ROW][C]13[/C][C]125[/C][C]126.406914906761[/C][C]-1.40691490676097[/C][/ROW]
[ROW][C]14[/C][C]123[/C][C]123.400619436619[/C][C]-0.40061943661911[/C][/ROW]
[ROW][C]15[/C][C]117[/C][C]117.241149784032[/C][C]-0.241149784032359[/C][/ROW]
[ROW][C]16[/C][C]114[/C][C]114.419213819381[/C][C]-0.419213819381284[/C][/ROW]
[ROW][C]17[/C][C]111[/C][C]111.676037121651[/C][C]-0.67603712165095[/C][/ROW]
[ROW][C]18[/C][C]112[/C][C]112.871247286712[/C][C]-0.87124728671185[/C][/ROW]
[ROW][C]19[/C][C]144[/C][C]142.101534758437[/C][C]1.89846524156337[/C][/ROW]
[ROW][C]20[/C][C]150[/C][C]151.064547224493[/C][C]-1.0645472244926[/C][/ROW]
[ROW][C]21[/C][C]149[/C][C]150.153237817933[/C][C]-1.15323781793316[/C][/ROW]
[ROW][C]22[/C][C]134[/C][C]139.628310569989[/C][C]-5.62831056998888[/C][/ROW]
[ROW][C]23[/C][C]123[/C][C]125.963644656578[/C][C]-2.9636446565778[/C][/ROW]
[ROW][C]24[/C][C]116[/C][C]118.881714793646[/C][C]-2.88171479364642[/C][/ROW]
[ROW][C]25[/C][C]117[/C][C]110.011598143677[/C][C]6.98840185632255[/C][/ROW]
[ROW][C]26[/C][C]111[/C][C]113.515846692458[/C][C]-2.51584669245803[/C][/ROW]
[ROW][C]27[/C][C]105[/C][C]106.349292431963[/C][C]-1.34929243196316[/C][/ROW]
[ROW][C]28[/C][C]102[/C][C]102.895468586704[/C][C]-0.895468586704055[/C][/ROW]
[ROW][C]29[/C][C]95[/C][C]99.9507895082191[/C][C]-4.95078950821915[/C][/ROW]
[ROW][C]30[/C][C]93[/C][C]97.6946890861727[/C][C]-4.69468908617269[/C][/ROW]
[ROW][C]31[/C][C]124[/C][C]119.936006283109[/C][C]4.06399371689115[/C][/ROW]
[ROW][C]32[/C][C]130[/C][C]128.611609904008[/C][C]1.38839009599161[/C][/ROW]
[ROW][C]33[/C][C]124[/C][C]129.414670483044[/C][C]-5.41467048304415[/C][/ROW]
[ROW][C]34[/C][C]115[/C][C]116.170198190924[/C][C]-1.17019819092415[/C][/ROW]
[ROW][C]35[/C][C]106[/C][C]107.633831960806[/C][C]-1.63383196080576[/C][/ROW]
[ROW][C]36[/C][C]105[/C][C]102.130110011898[/C][C]2.86988998810186[/C][/ROW]
[ROW][C]37[/C][C]105[/C][C]100.414057966441[/C][C]4.58594203355922[/C][/ROW]
[ROW][C]38[/C][C]101[/C][C]100.019400828354[/C][C]0.980599171645864[/C][/ROW]
[ROW][C]39[/C][C]95[/C][C]96.1450804252167[/C][C]-1.14508042521666[/C][/ROW]
[ROW][C]40[/C][C]93[/C][C]93.1394583879027[/C][C]-0.139458387902749[/C][/ROW]
[ROW][C]41[/C][C]84[/C][C]89.8746695676071[/C][C]-5.87466956760709[/C][/ROW]
[ROW][C]42[/C][C]87[/C][C]86.7875295134518[/C][C]0.212470486548156[/C][/ROW]
[ROW][C]43[/C][C]116[/C][C]113.085587470405[/C][C]2.91441252959457[/C][/ROW]
[ROW][C]44[/C][C]120[/C][C]119.806516845655[/C][C]0.193483154345017[/C][/ROW]
[ROW][C]45[/C][C]117[/C][C]117.981204792318[/C][C]-0.98120479231791[/C][/ROW]
[ROW][C]46[/C][C]109[/C][C]109.531589993709[/C][C]-0.531589993708678[/C][/ROW]
[ROW][C]47[/C][C]105[/C][C]101.705994952686[/C][C]3.29400504731413[/C][/ROW]
[ROW][C]48[/C][C]107[/C][C]101.047666938839[/C][C]5.95233306116117[/C][/ROW]
[ROW][C]49[/C][C]109[/C][C]101.996042829396[/C][C]7.00395717060398[/C][/ROW]
[ROW][C]50[/C][C]109[/C][C]102.313435288787[/C][C]6.686564711213[/C][/ROW]
[ROW][C]51[/C][C]108[/C][C]101.747451939692[/C][C]6.2525480603076[/C][/ROW]
[ROW][C]52[/C][C]107[/C][C]104.245678149659[/C][C]2.75432185034096[/C][/ROW]
[ROW][C]53[/C][C]99[/C][C]100.852089847908[/C][C]-1.85208984790813[/C][/ROW]
[ROW][C]54[/C][C]103[/C][C]102.942085037429[/C][C]0.057914962571374[/C][/ROW]
[ROW][C]55[/C][C]131[/C][C]134.870828556147[/C][C]-3.87082855614662[/C][/ROW]
[ROW][C]56[/C][C]137[/C][C]136.508655474[/C][C]0.491344526000177[/C][/ROW]
[ROW][C]57[/C][C]135[/C][C]134.340301891456[/C][C]0.659698108544177[/C][/ROW]
[ROW][C]58[/C][C]124[/C][C]126.130263846303[/C][C]-2.13026384630341[/C][/ROW]
[ROW][C]59[/C][C]118[/C][C]117.293507416355[/C][C]0.706492583644916[/C][/ROW]
[ROW][C]60[/C][C]121[/C][C]115.153786110203[/C][C]5.84621388979744[/C][/ROW]
[ROW][C]61[/C][C]121[/C][C]115.898026461889[/C][C]5.10197353811108[/C][/ROW]
[ROW][C]62[/C][C]118[/C][C]114.215790083596[/C][C]3.78420991640445[/C][/ROW]
[ROW][C]63[/C][C]113[/C][C]110.955858892281[/C][C]2.04414110771935[/C][/ROW]
[ROW][C]64[/C][C]107[/C][C]109.314705583708[/C][C]-2.31470558370788[/C][/ROW]
[ROW][C]65[/C][C]100[/C][C]100.933190007623[/C][C]-0.933190007623054[/C][/ROW]
[ROW][C]66[/C][C]102[/C][C]104.263424413169[/C][C]-2.26342441316901[/C][/ROW]
[ROW][C]67[/C][C]130[/C][C]133.297513719389[/C][C]-3.29751371938923[/C][/ROW]
[ROW][C]68[/C][C]136[/C][C]136.520500071832[/C][C]-0.52050007183189[/C][/ROW]
[ROW][C]69[/C][C]133[/C][C]133.668778768009[/C][C]-0.66877876800865[/C][/ROW]
[ROW][C]70[/C][C]120[/C][C]123.851070132863[/C][C]-3.85107013286331[/C][/ROW]
[ROW][C]71[/C][C]112[/C][C]114.660921670236[/C][C]-2.66092167023643[/C][/ROW]
[ROW][C]72[/C][C]109[/C][C]111.420327436684[/C][C]-2.42032743668361[/C][/ROW]
[ROW][C]73[/C][C]110[/C][C]106.185365512812[/C][C]3.81463448718789[/C][/ROW]
[/TABLE]
Source: https://freestatistics.org/blog/index.php?pk=121919&T=2

Globally Unique Identifier (entire table): ba.freestatistics.org/blog/index.php?pk=121919&T=2

As an alternative you can also use a QR Code:  

The GUIDs for individual cells are displayed in the table below:

Interpolation Forecasts of Exponential Smoothing
tObservedFittedResiduals
13125126.406914906761-1.40691490676097
14123123.400619436619-0.40061943661911
15117117.241149784032-0.241149784032359
16114114.419213819381-0.419213819381284
17111111.676037121651-0.67603712165095
18112112.871247286712-0.87124728671185
19144142.1015347584371.89846524156337
20150151.064547224493-1.0645472244926
21149150.153237817933-1.15323781793316
22134139.628310569989-5.62831056998888
23123125.963644656578-2.9636446565778
24116118.881714793646-2.88171479364642
25117110.0115981436776.98840185632255
26111113.515846692458-2.51584669245803
27105106.349292431963-1.34929243196316
28102102.895468586704-0.895468586704055
299599.9507895082191-4.95078950821915
309397.6946890861727-4.69468908617269
31124119.9360062831094.06399371689115
32130128.6116099040081.38839009599161
33124129.414670483044-5.41467048304415
34115116.170198190924-1.17019819092415
35106107.633831960806-1.63383196080576
36105102.1301100118982.86988998810186
37105100.4140579664414.58594203355922
38101100.0194008283540.980599171645864
399596.1450804252167-1.14508042521666
409393.1394583879027-0.139458387902749
418489.8746695676071-5.87466956760709
428786.78752951345180.212470486548156
43116113.0855874704052.91441252959457
44120119.8065168456550.193483154345017
45117117.981204792318-0.98120479231791
46109109.531589993709-0.531589993708678
47105101.7059949526863.29400504731413
48107101.0476669388395.95233306116117
49109101.9960428293967.00395717060398
50109102.3134352887876.686564711213
51108101.7474519396926.2525480603076
52107104.2456781496592.75432185034096
5399100.852089847908-1.85208984790813
54103102.9420850374290.057914962571374
55131134.870828556147-3.87082855614662
56137136.5086554740.491344526000177
57135134.3403018914560.659698108544177
58124126.130263846303-2.13026384630341
59118117.2935074163550.706492583644916
60121115.1537861102035.84621388979744
61121115.8980264618895.10197353811108
62118114.2157900835963.78420991640445
63113110.9558588922812.04414110771935
64107109.314705583708-2.31470558370788
65100100.933190007623-0.933190007623054
66102104.263424413169-2.26342441316901
67130133.297513719389-3.29751371938923
68136136.520500071832-0.52050007183189
69133133.668778768009-0.66877876800865
70120123.851070132863-3.85107013286331
71112114.660921670236-2.66092167023643
72109111.420327436684-2.42032743668361
73110106.1853655128123.81463448718789


Extrapolation Forecasts of Exponential Smoothing
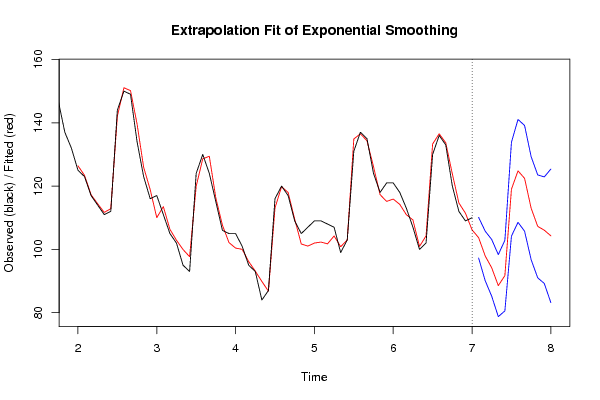
tForecast95% Lower Bound95% Upper Bound
74103.71430233025997.2885573919377110.14004726858
7597.947268083390690.1265334675071105.768002699274
7694.150499433741785.1836611309646103.117337736519
7788.54332955228278.750525246547398.3361338580168
7891.72482848807980.5745020353838102.875154940774
79119.005104323971104.178444754129133.831763893814
80124.798638399853108.553480367754141.043796431953
81122.448731374129105.745882306906139.151580441352
82113.01077711158996.745143761764129.276410461415
83107.26971140630791.0102477370051123.529175075609
84106.06150053808889.2343369665997122.888664109576
85104.28127897877983.1862081267717125.376349830786

\begin{tabular}{lllllllll}
\hline
Extrapolation Forecasts of Exponential Smoothing \tabularnewline
t & Forecast & 95% Lower Bound & 95% Upper Bound \tabularnewline
74 & 103.714302330259 & 97.2885573919377 & 110.14004726858 \tabularnewline
75 & 97.9472680833906 & 90.1265334675071 & 105.768002699274 \tabularnewline
76 & 94.1504994337417 & 85.1836611309646 & 103.117337736519 \tabularnewline
77 & 88.543329552282 & 78.7505252465473 & 98.3361338580168 \tabularnewline
78 & 91.724828488079 & 80.5745020353838 & 102.875154940774 \tabularnewline
79 & 119.005104323971 & 104.178444754129 & 133.831763893814 \tabularnewline
80 & 124.798638399853 & 108.553480367754 & 141.043796431953 \tabularnewline
81 & 122.448731374129 & 105.745882306906 & 139.151580441352 \tabularnewline
82 & 113.010777111589 & 96.745143761764 & 129.276410461415 \tabularnewline
83 & 107.269711406307 & 91.0102477370051 & 123.529175075609 \tabularnewline
84 & 106.061500538088 & 89.2343369665997 & 122.888664109576 \tabularnewline
85 & 104.281278978779 & 83.1862081267717 & 125.376349830786 \tabularnewline
\hline
\end{tabular}
%Source: https://freestatistics.org/blog/index.php?pk=121919&T=3

[TABLE]
[ROW][C]Extrapolation Forecasts of Exponential Smoothing[/C][/ROW]
[ROW][C]t[/C][C]Forecast[/C][C]95% Lower Bound[/C][C]95% Upper Bound[/C][/ROW]
[ROW][C]74[/C][C]103.714302330259[/C][C]97.2885573919377[/C][C]110.14004726858[/C][/ROW]
[ROW][C]75[/C][C]97.9472680833906[/C][C]90.1265334675071[/C][C]105.768002699274[/C][/ROW]
[ROW][C]76[/C][C]94.1504994337417[/C][C]85.1836611309646[/C][C]103.117337736519[/C][/ROW]
[ROW][C]77[/C][C]88.543329552282[/C][C]78.7505252465473[/C][C]98.3361338580168[/C][/ROW]
[ROW][C]78[/C][C]91.724828488079[/C][C]80.5745020353838[/C][C]102.875154940774[/C][/ROW]
[ROW][C]79[/C][C]119.005104323971[/C][C]104.178444754129[/C][C]133.831763893814[/C][/ROW]
[ROW][C]80[/C][C]124.798638399853[/C][C]108.553480367754[/C][C]141.043796431953[/C][/ROW]
[ROW][C]81[/C][C]122.448731374129[/C][C]105.745882306906[/C][C]139.151580441352[/C][/ROW]
[ROW][C]82[/C][C]113.010777111589[/C][C]96.745143761764[/C][C]129.276410461415[/C][/ROW]
[ROW][C]83[/C][C]107.269711406307[/C][C]91.0102477370051[/C][C]123.529175075609[/C][/ROW]
[ROW][C]84[/C][C]106.061500538088[/C][C]89.2343369665997[/C][C]122.888664109576[/C][/ROW]
[ROW][C]85[/C][C]104.281278978779[/C][C]83.1862081267717[/C][C]125.376349830786[/C][/ROW]
[/TABLE]
Source: https://freestatistics.org/blog/index.php?pk=121919&T=3

Globally Unique Identifier (entire table): ba.freestatistics.org/blog/index.php?pk=121919&T=3

As an alternative you can also use a QR Code:  

The GUIDs for individual cells are displayed in the table below:

Extrapolation Forecasts of Exponential Smoothing
tForecast95% Lower Bound95% Upper Bound
74103.71430233025997.2885573919377110.14004726858
7597.947268083390690.1265334675071105.768002699274
7694.150499433741785.1836611309646103.117337736519
7788.54332955228278.750525246547398.3361338580168
7891.72482848807980.5745020353838102.875154940774
79119.005104323971104.178444754129133.831763893814
80124.798638399853108.553480367754141.043796431953
81122.448731374129105.745882306906139.151580441352
82113.01077711158996.745143761764129.276410461415
83107.26971140630791.0102477370051123.529175075609
84106.06150053808889.2343369665997122.888664109576
85104.28127897877983.1862081267717125.376349830786


Parameters (Session):
par1 = 12 ; par2 = Triple ; par3 = multiplicative ;
Parameters (R input):
par1 = 12 ; par2 = Triple ; par3 = multiplicative ;
R code (references can be found in the software module):
par1 <- as.numeric(par1)
if (par2 == 'Single') K <- 1
if (par2 == 'Double') K <- 2
if (par2 == 'Triple') K <- par1
nx <- length(x)
nxmK <- nx - K
x <- ts(x, frequency = par1)
if (par2 == 'Single') fit <- HoltWinters(x, gamma=F, beta=F)
if (par2 == 'Double') fit <- HoltWinters(x, gamma=F)
if (par2 == 'Triple') fit <- HoltWinters(x, seasonal=par3)
fit
myresid <- x - fit$fitted[,'xhat']
bitmap(file='test1.png')
op <- par(mfrow=c(2,1))
plot(fit,ylab='Observed (black) / Fitted (red)',main='Interpolation Fit of Exponential Smoothing')
plot(myresid,ylab='Residuals',main='Interpolation Prediction Errors')
par(op)
dev.off()
bitmap(file='test2.png')
p <- predict(fit, par1, prediction.interval=TRUE)
np <- length(p[,1])
plot(fit,p,ylab='Observed (black) / Fitted (red)',main='Extrapolation Fit of Exponential Smoothing')
dev.off()
bitmap(file='test3.png')
op <- par(mfrow = c(2,2))
acf(as.numeric(myresid),lag.max = nx/2,main='Residual ACF')
spectrum(myresid,main='Residals Periodogram')
cpgram(myresid,main='Residal Cumulative Periodogram')
qqnorm(myresid,main='Residual Normal QQ Plot')
qqline(myresid)
par(op)
dev.off()
load(file='createtable')
a<-table.start()
a<-table.row.start(a)
a<-table.element(a,'Estimated Parameters of Exponential Smoothing',2,TRUE)
a<-table.row.end(a)
a<-table.row.start(a)
a<-table.element(a,'Parameter',header=TRUE)
a<-table.element(a,'Value',header=TRUE)
a<-table.row.end(a)
a<-table.row.start(a)
a<-table.element(a,'alpha',header=TRUE)
a<-table.element(a,fit$alpha)
a<-table.row.end(a)
a<-table.row.start(a)
a<-table.element(a,'beta',header=TRUE)
a<-table.element(a,fit$beta)
a<-table.row.end(a)
a<-table.row.start(a)
a<-table.element(a,'gamma',header=TRUE)
a<-table.element(a,fit$gamma)
a<-table.row.end(a)
a<-table.end(a)
table.save(a,file='mytable.tab')
a<-table.start()
a<-table.row.start(a)
a<-table.element(a,'Interpolation Forecasts of Exponential Smoothing',4,TRUE)
a<-table.row.end(a)
a<-table.row.start(a)
a<-table.element(a,'t',header=TRUE)
a<-table.element(a,'Observed',header=TRUE)
a<-table.element(a,'Fitted',header=TRUE)
a<-table.element(a,'Residuals',header=TRUE)
a<-table.row.end(a)
for (i in 1:nxmK) {
a<-table.row.start(a)
a<-table.element(a,i+K,header=TRUE)
a<-table.element(a,x[i+K])
a<-table.element(a,fit$fitted[i,'xhat'])
a<-table.element(a,myresid[i])
a<-table.row.end(a)
}
a<-table.end(a)
table.save(a,file='mytable1.tab')
a<-table.start()
a<-table.row.start(a)
a<-table.element(a,'Extrapolation Forecasts of Exponential Smoothing',4,TRUE)
a<-table.row.end(a)
a<-table.row.start(a)
a<-table.element(a,'t',header=TRUE)
a<-table.element(a,'Forecast',header=TRUE)
a<-table.element(a,'95% Lower Bound',header=TRUE)
a<-table.element(a,'95% Upper Bound',header=TRUE)
a<-table.row.end(a)
for (i in 1:np) {
a<-table.row.start(a)
a<-table.element(a,nx+i,header=TRUE)
a<-table.element(a,p[i,'fit'])
a<-table.element(a,p[i,'lwr'])
a<-table.element(a,p[i,'upr'])
a<-table.row.end(a)
}
a<-table.end(a)
table.save(a,file='mytable2.tab')