Free Statistics

of Irreproducible Research!

Author's title

Author*Unverified author*
R Software Modulerwasp_exponentialsmoothing.wasp
Title produced by softwareExponential Smoothing
Date of computationWed, 18 May 2011 14:38:04 +0000
Cite this page as followsStatistical Computations at FreeStatistics.org, Office for Research Development and Education, URL https://freestatistics.org/blog/index.php?v=date/2011/May/18/t1305729297rs2ks4y3242fly3.htm/, Retrieved Tue, 14 May 2024 23:26:33 +0000
Statistical Computations at FreeStatistics.org, Office for Research Development and Education, URL https://freestatistics.org/blog/index.php?pk=121873, Retrieved Tue, 14 May 2024 23:26:33 +0000
QR Codes:

Original text written by user:
IsPrivate?No (this computation is public)
User-defined keywordsKDGP2W102
Estimated Impact61
Family? (F = Feedback message, R = changed R code, M = changed R Module, P = changed Parameters, D = changed Data)
-       [Exponential Smoothing] [Double exonential...] [2011-05-18 14:38:04] [d41d8cd98f00b204e9800998ecf8427e] [Current]
Feedback Forum

Post a new message
Dataseries X:
266
145.9
183.1
119.3
180.3
168.5
231.8
224.5
192.8
122.9
336.5
185.9
194.3
149.5
210.1
273.3
191.4
287
226
303.6
289.9
421.6
264.5
342.3
339.7
440.4
315.9
439.3
401.3
437.4
575.5
407.6
682
475.3
581.3
646.9


Summary of computational transaction
Raw Inputview raw input (R code)
Raw Outputview raw output of R engine
Computing time3 seconds
R Server'Gwilym Jenkins' @ www.wessa.org

\begin{tabular}{lllllllll}
\hline
Summary of computational transaction \tabularnewline
Raw Input & view raw input (R code)  \tabularnewline
Raw Output & view raw output of R engine  \tabularnewline
Computing time & 3 seconds \tabularnewline
R Server & 'Gwilym Jenkins' @ www.wessa.org \tabularnewline
\hline
\end{tabular}
%Source: https://freestatistics.org/blog/index.php?pk=121873&T=0

[TABLE]
[ROW][C]Summary of computational transaction[/C][/ROW]
[ROW][C]Raw Input[/C][C]view raw input (R code) [/C][/ROW]
[ROW][C]Raw Output[/C][C]view raw output of R engine [/C][/ROW]
[ROW][C]Computing time[/C][C]3 seconds[/C][/ROW]
[ROW][C]R Server[/C][C]'Gwilym Jenkins' @ www.wessa.org[/C][/ROW]
[/TABLE]
Source: https://freestatistics.org/blog/index.php?pk=121873&T=0

Globally Unique Identifier (entire table): ba.freestatistics.org/blog/index.php?pk=121873&T=0

As an alternative you can also use a QR Code:  

The GUIDs for individual cells are displayed in the table below:

Summary of computational transaction
Raw Inputview raw input (R code)
Raw Outputview raw output of R engine
Computing time3 seconds
R Server'Gwilym Jenkins' @ www.wessa.org


Estimated Parameters of Exponential Smoothing
ParameterValue
alpha0.356390612621213
beta1
gammaFALSE

\begin{tabular}{lllllllll}
\hline
Estimated Parameters of Exponential Smoothing \tabularnewline
Parameter & Value \tabularnewline
alpha & 0.356390612621213 \tabularnewline
beta & 1 \tabularnewline
gamma & FALSE \tabularnewline
\hline
\end{tabular}
%Source: https://freestatistics.org/blog/index.php?pk=121873&T=1

[TABLE]
[ROW][C]Estimated Parameters of Exponential Smoothing[/C][/ROW]
[ROW][C]Parameter[/C][C]Value[/C][/ROW]
[ROW][C]alpha[/C][C]0.356390612621213[/C][/ROW]
[ROW][C]beta[/C][C]1[/C][/ROW]
[ROW][C]gamma[/C][C]FALSE[/C][/ROW]
[/TABLE]
Source: https://freestatistics.org/blog/index.php?pk=121873&T=1

Globally Unique Identifier (entire table): ba.freestatistics.org/blog/index.php?pk=121873&T=1

As an alternative you can also use a QR Code:  

The GUIDs for individual cells are displayed in the table below:

Estimated Parameters of Exponential Smoothing
ParameterValue
alpha0.356390612621213
beta1
gammaFALSE


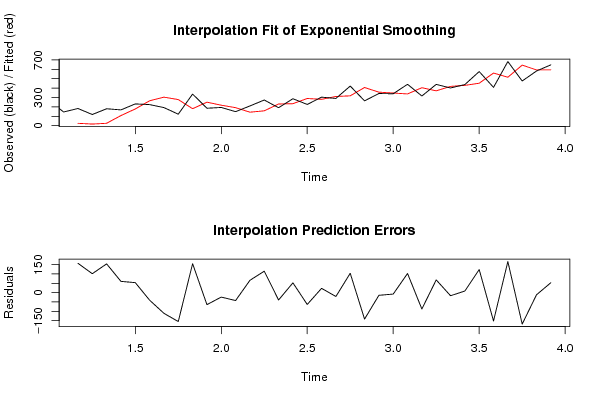
Interpolation Forecasts of Exponential Smoothing
tObservedFittedResiduals
3183.125.8157.3
4119.317.8204867306336101.479513269366
5180.326.1134219010944154.186578098906
6168.5108.14130922225860.3586907777418
7231.8178.24108908337253.5589109166281
8224.5265.005384306996-40.505384306996
9192.8303.810309002462-111.010309002462
10122.9277.924908360241-155.024908360241
11336.5181.10369562657155.39630437343
12185.9250.295473184391-64.395473184391
13194.3218.205582351057-23.905582351057
14149.5192.026183377621-42.5261833776208
15210.1144.0546444505666.04535554944
16273.3158.314927519993114.985072480007
17191.4230.996466711264-39.5964667112639
18287234.47478742136552.5252125786351
19226289.503902538247-63.5039025382471
20303.6280.54913550728323.0508644927174
21289.9310.656786641778-20.7567866417782
22421.6317.754278243643103.845721756357
23264.5406.2685745425-141.7685745425
24342.3356.723252183241-14.4232521832407
25339.7347.422295592469-7.72229559246858
26440.4337.757343369188102.642656630812
27315.9404.006303358397-88.1063033583969
28439.3370.87386521050368.4261347894971
29401.3417.91455068616-16.6145506861596
30437.4428.7262642699528.67373573004761
31575.5451.641723732304123.858276267696
32407.6559.749799118613-152.149799118613
33682515.266427311516166.733572688484
34475.3643.852375852441-168.552375852441
35581.3592.875075300769-11.575075300769
36646.9593.71776288275453.1822371172464

\begin{tabular}{lllllllll}
\hline
Interpolation Forecasts of Exponential Smoothing \tabularnewline
t & Observed & Fitted & Residuals \tabularnewline
3 & 183.1 & 25.8 & 157.3 \tabularnewline
4 & 119.3 & 17.8204867306336 & 101.479513269366 \tabularnewline
5 & 180.3 & 26.1134219010944 & 154.186578098906 \tabularnewline
6 & 168.5 & 108.141309222258 & 60.3586907777418 \tabularnewline
7 & 231.8 & 178.241089083372 & 53.5589109166281 \tabularnewline
8 & 224.5 & 265.005384306996 & -40.505384306996 \tabularnewline
9 & 192.8 & 303.810309002462 & -111.010309002462 \tabularnewline
10 & 122.9 & 277.924908360241 & -155.024908360241 \tabularnewline
11 & 336.5 & 181.10369562657 & 155.39630437343 \tabularnewline
12 & 185.9 & 250.295473184391 & -64.395473184391 \tabularnewline
13 & 194.3 & 218.205582351057 & -23.905582351057 \tabularnewline
14 & 149.5 & 192.026183377621 & -42.5261833776208 \tabularnewline
15 & 210.1 & 144.05464445056 & 66.04535554944 \tabularnewline
16 & 273.3 & 158.314927519993 & 114.985072480007 \tabularnewline
17 & 191.4 & 230.996466711264 & -39.5964667112639 \tabularnewline
18 & 287 & 234.474787421365 & 52.5252125786351 \tabularnewline
19 & 226 & 289.503902538247 & -63.5039025382471 \tabularnewline
20 & 303.6 & 280.549135507283 & 23.0508644927174 \tabularnewline
21 & 289.9 & 310.656786641778 & -20.7567866417782 \tabularnewline
22 & 421.6 & 317.754278243643 & 103.845721756357 \tabularnewline
23 & 264.5 & 406.2685745425 & -141.7685745425 \tabularnewline
24 & 342.3 & 356.723252183241 & -14.4232521832407 \tabularnewline
25 & 339.7 & 347.422295592469 & -7.72229559246858 \tabularnewline
26 & 440.4 & 337.757343369188 & 102.642656630812 \tabularnewline
27 & 315.9 & 404.006303358397 & -88.1063033583969 \tabularnewline
28 & 439.3 & 370.873865210503 & 68.4261347894971 \tabularnewline
29 & 401.3 & 417.91455068616 & -16.6145506861596 \tabularnewline
30 & 437.4 & 428.726264269952 & 8.67373573004761 \tabularnewline
31 & 575.5 & 451.641723732304 & 123.858276267696 \tabularnewline
32 & 407.6 & 559.749799118613 & -152.149799118613 \tabularnewline
33 & 682 & 515.266427311516 & 166.733572688484 \tabularnewline
34 & 475.3 & 643.852375852441 & -168.552375852441 \tabularnewline
35 & 581.3 & 592.875075300769 & -11.575075300769 \tabularnewline
36 & 646.9 & 593.717762882754 & 53.1822371172464 \tabularnewline
\hline
\end{tabular}
%Source: https://freestatistics.org/blog/index.php?pk=121873&T=2

[TABLE]
[ROW][C]Interpolation Forecasts of Exponential Smoothing[/C][/ROW]
[ROW][C]t[/C][C]Observed[/C][C]Fitted[/C][C]Residuals[/C][/ROW]
[ROW][C]3[/C][C]183.1[/C][C]25.8[/C][C]157.3[/C][/ROW]
[ROW][C]4[/C][C]119.3[/C][C]17.8204867306336[/C][C]101.479513269366[/C][/ROW]
[ROW][C]5[/C][C]180.3[/C][C]26.1134219010944[/C][C]154.186578098906[/C][/ROW]
[ROW][C]6[/C][C]168.5[/C][C]108.141309222258[/C][C]60.3586907777418[/C][/ROW]
[ROW][C]7[/C][C]231.8[/C][C]178.241089083372[/C][C]53.5589109166281[/C][/ROW]
[ROW][C]8[/C][C]224.5[/C][C]265.005384306996[/C][C]-40.505384306996[/C][/ROW]
[ROW][C]9[/C][C]192.8[/C][C]303.810309002462[/C][C]-111.010309002462[/C][/ROW]
[ROW][C]10[/C][C]122.9[/C][C]277.924908360241[/C][C]-155.024908360241[/C][/ROW]
[ROW][C]11[/C][C]336.5[/C][C]181.10369562657[/C][C]155.39630437343[/C][/ROW]
[ROW][C]12[/C][C]185.9[/C][C]250.295473184391[/C][C]-64.395473184391[/C][/ROW]
[ROW][C]13[/C][C]194.3[/C][C]218.205582351057[/C][C]-23.905582351057[/C][/ROW]
[ROW][C]14[/C][C]149.5[/C][C]192.026183377621[/C][C]-42.5261833776208[/C][/ROW]
[ROW][C]15[/C][C]210.1[/C][C]144.05464445056[/C][C]66.04535554944[/C][/ROW]
[ROW][C]16[/C][C]273.3[/C][C]158.314927519993[/C][C]114.985072480007[/C][/ROW]
[ROW][C]17[/C][C]191.4[/C][C]230.996466711264[/C][C]-39.5964667112639[/C][/ROW]
[ROW][C]18[/C][C]287[/C][C]234.474787421365[/C][C]52.5252125786351[/C][/ROW]
[ROW][C]19[/C][C]226[/C][C]289.503902538247[/C][C]-63.5039025382471[/C][/ROW]
[ROW][C]20[/C][C]303.6[/C][C]280.549135507283[/C][C]23.0508644927174[/C][/ROW]
[ROW][C]21[/C][C]289.9[/C][C]310.656786641778[/C][C]-20.7567866417782[/C][/ROW]
[ROW][C]22[/C][C]421.6[/C][C]317.754278243643[/C][C]103.845721756357[/C][/ROW]
[ROW][C]23[/C][C]264.5[/C][C]406.2685745425[/C][C]-141.7685745425[/C][/ROW]
[ROW][C]24[/C][C]342.3[/C][C]356.723252183241[/C][C]-14.4232521832407[/C][/ROW]
[ROW][C]25[/C][C]339.7[/C][C]347.422295592469[/C][C]-7.72229559246858[/C][/ROW]
[ROW][C]26[/C][C]440.4[/C][C]337.757343369188[/C][C]102.642656630812[/C][/ROW]
[ROW][C]27[/C][C]315.9[/C][C]404.006303358397[/C][C]-88.1063033583969[/C][/ROW]
[ROW][C]28[/C][C]439.3[/C][C]370.873865210503[/C][C]68.4261347894971[/C][/ROW]
[ROW][C]29[/C][C]401.3[/C][C]417.91455068616[/C][C]-16.6145506861596[/C][/ROW]
[ROW][C]30[/C][C]437.4[/C][C]428.726264269952[/C][C]8.67373573004761[/C][/ROW]
[ROW][C]31[/C][C]575.5[/C][C]451.641723732304[/C][C]123.858276267696[/C][/ROW]
[ROW][C]32[/C][C]407.6[/C][C]559.749799118613[/C][C]-152.149799118613[/C][/ROW]
[ROW][C]33[/C][C]682[/C][C]515.266427311516[/C][C]166.733572688484[/C][/ROW]
[ROW][C]34[/C][C]475.3[/C][C]643.852375852441[/C][C]-168.552375852441[/C][/ROW]
[ROW][C]35[/C][C]581.3[/C][C]592.875075300769[/C][C]-11.575075300769[/C][/ROW]
[ROW][C]36[/C][C]646.9[/C][C]593.717762882754[/C][C]53.1822371172464[/C][/ROW]
[/TABLE]
Source: https://freestatistics.org/blog/index.php?pk=121873&T=2

Globally Unique Identifier (entire table): ba.freestatistics.org/blog/index.php?pk=121873&T=2

As an alternative you can also use a QR Code:  

The GUIDs for individual cells are displayed in the table below:

Interpolation Forecasts of Exponential Smoothing
tObservedFittedResiduals
3183.125.8157.3
4119.317.8204867306336101.479513269366
5180.326.1134219010944154.186578098906
6168.5108.14130922225860.3586907777418
7231.8178.24108908337253.5589109166281
8224.5265.005384306996-40.505384306996
9192.8303.810309002462-111.010309002462
10122.9277.924908360241-155.024908360241
11336.5181.10369562657155.39630437343
12185.9250.295473184391-64.395473184391
13194.3218.205582351057-23.905582351057
14149.5192.026183377621-42.5261833776208
15210.1144.0546444505666.04535554944
16273.3158.314927519993114.985072480007
17191.4230.996466711264-39.5964667112639
18287234.47478742136552.5252125786351
19226289.503902538247-63.5039025382471
20303.6280.54913550728323.0508644927174
21289.9310.656786641778-20.7567866417782
22421.6317.754278243643103.845721756357
23264.5406.2685745425-141.7685745425
24342.3356.723252183241-14.4232521832407
25339.7347.422295592469-7.72229559246858
26440.4337.757343369188102.642656630812
27315.9404.006303358397-88.1063033583969
28439.3370.87386521050368.4261347894971
29401.3417.91455068616-16.6145506861596
30437.4428.7262642699528.67373573004761
31575.5451.641723732304123.858276267696
32407.6559.749799118613-152.149799118613
33682515.266427311516166.733572688484
34475.3643.852375852441-168.552375852441
35581.3592.875075300769-11.575075300769
36646.9593.71776288275453.1822371172464


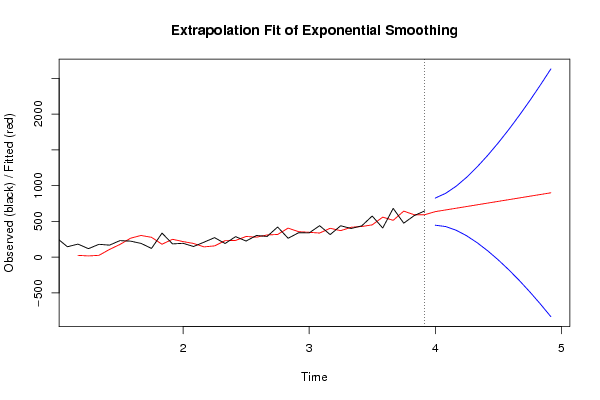
Extrapolation Forecasts of Exponential Smoothing
tForecast95% Lower Bound95% Upper Bound
37636.59299877588447.167340714609826.018656837151
38660.514584602224427.894240459304893.134928745145
39684.436170428569376.004573785282992.867767071855
40708.357756254913298.4179702901611118.29754221967
41732.279342081258201.2529475164641263.30573664605
42756.20092790760288.32344444262631424.07841137258
43780.122513733947-38.03370850635171598.27873597424
44804.044099560291-176.2935551414531784.38175426204
45827.965685386635-325.3869687980781981.31833957135
46851.88727121298-484.51684407012188.29138649606
47875.808857039324-653.059297121332404.67701119998
48899.730442865669-830.5074129179552629.96829864929

\begin{tabular}{lllllllll}
\hline
Extrapolation Forecasts of Exponential Smoothing \tabularnewline
t & Forecast & 95% Lower Bound & 95% Upper Bound \tabularnewline
37 & 636.59299877588 & 447.167340714609 & 826.018656837151 \tabularnewline
38 & 660.514584602224 & 427.894240459304 & 893.134928745145 \tabularnewline
39 & 684.436170428569 & 376.004573785282 & 992.867767071855 \tabularnewline
40 & 708.357756254913 & 298.417970290161 & 1118.29754221967 \tabularnewline
41 & 732.279342081258 & 201.252947516464 & 1263.30573664605 \tabularnewline
42 & 756.200927907602 & 88.3234444426263 & 1424.07841137258 \tabularnewline
43 & 780.122513733947 & -38.0337085063517 & 1598.27873597424 \tabularnewline
44 & 804.044099560291 & -176.293555141453 & 1784.38175426204 \tabularnewline
45 & 827.965685386635 & -325.386968798078 & 1981.31833957135 \tabularnewline
46 & 851.88727121298 & -484.5168440701 & 2188.29138649606 \tabularnewline
47 & 875.808857039324 & -653.05929712133 & 2404.67701119998 \tabularnewline
48 & 899.730442865669 & -830.507412917955 & 2629.96829864929 \tabularnewline
\hline
\end{tabular}
%Source: https://freestatistics.org/blog/index.php?pk=121873&T=3

[TABLE]
[ROW][C]Extrapolation Forecasts of Exponential Smoothing[/C][/ROW]
[ROW][C]t[/C][C]Forecast[/C][C]95% Lower Bound[/C][C]95% Upper Bound[/C][/ROW]
[ROW][C]37[/C][C]636.59299877588[/C][C]447.167340714609[/C][C]826.018656837151[/C][/ROW]
[ROW][C]38[/C][C]660.514584602224[/C][C]427.894240459304[/C][C]893.134928745145[/C][/ROW]
[ROW][C]39[/C][C]684.436170428569[/C][C]376.004573785282[/C][C]992.867767071855[/C][/ROW]
[ROW][C]40[/C][C]708.357756254913[/C][C]298.417970290161[/C][C]1118.29754221967[/C][/ROW]
[ROW][C]41[/C][C]732.279342081258[/C][C]201.252947516464[/C][C]1263.30573664605[/C][/ROW]
[ROW][C]42[/C][C]756.200927907602[/C][C]88.3234444426263[/C][C]1424.07841137258[/C][/ROW]
[ROW][C]43[/C][C]780.122513733947[/C][C]-38.0337085063517[/C][C]1598.27873597424[/C][/ROW]
[ROW][C]44[/C][C]804.044099560291[/C][C]-176.293555141453[/C][C]1784.38175426204[/C][/ROW]
[ROW][C]45[/C][C]827.965685386635[/C][C]-325.386968798078[/C][C]1981.31833957135[/C][/ROW]
[ROW][C]46[/C][C]851.88727121298[/C][C]-484.5168440701[/C][C]2188.29138649606[/C][/ROW]
[ROW][C]47[/C][C]875.808857039324[/C][C]-653.05929712133[/C][C]2404.67701119998[/C][/ROW]
[ROW][C]48[/C][C]899.730442865669[/C][C]-830.507412917955[/C][C]2629.96829864929[/C][/ROW]
[/TABLE]
Source: https://freestatistics.org/blog/index.php?pk=121873&T=3

Globally Unique Identifier (entire table): ba.freestatistics.org/blog/index.php?pk=121873&T=3

As an alternative you can also use a QR Code:  

The GUIDs for individual cells are displayed in the table below:

Extrapolation Forecasts of Exponential Smoothing
tForecast95% Lower Bound95% Upper Bound
37636.59299877588447.167340714609826.018656837151
38660.514584602224427.894240459304893.134928745145
39684.436170428569376.004573785282992.867767071855
40708.357756254913298.4179702901611118.29754221967
41732.279342081258201.2529475164641263.30573664605
42756.20092790760288.32344444262631424.07841137258
43780.122513733947-38.03370850635171598.27873597424
44804.044099560291-176.2935551414531784.38175426204
45827.965685386635-325.3869687980781981.31833957135
46851.88727121298-484.51684407012188.29138649606
47875.808857039324-653.059297121332404.67701119998
48899.730442865669-830.5074129179552629.96829864929


Parameters (Session):
par1 = 12 ; par2 = Double ; par3 = multiplicative ;
Parameters (R input):
par1 = 12 ; par2 = Double ; par3 = multiplicative ;
R code (references can be found in the software module):
par1 <- as.numeric(par1)
if (par2 == 'Single') K <- 1
if (par2 == 'Double') K <- 2
if (par2 == 'Triple') K <- par1
nx <- length(x)
nxmK <- nx - K
x <- ts(x, frequency = par1)
if (par2 == 'Single') fit <- HoltWinters(x, gamma=F, beta=F)
if (par2 == 'Double') fit <- HoltWinters(x, gamma=F)
if (par2 == 'Triple') fit <- HoltWinters(x, seasonal=par3)
fit
myresid <- x - fit$fitted[,'xhat']
bitmap(file='test1.png')
op <- par(mfrow=c(2,1))
plot(fit,ylab='Observed (black) / Fitted (red)',main='Interpolation Fit of Exponential Smoothing')
plot(myresid,ylab='Residuals',main='Interpolation Prediction Errors')
par(op)
dev.off()
bitmap(file='test2.png')
p <- predict(fit, par1, prediction.interval=TRUE)
np <- length(p[,1])
plot(fit,p,ylab='Observed (black) / Fitted (red)',main='Extrapolation Fit of Exponential Smoothing')
dev.off()
bitmap(file='test3.png')
op <- par(mfrow = c(2,2))
acf(as.numeric(myresid),lag.max = nx/2,main='Residual ACF')
spectrum(myresid,main='Residals Periodogram')
cpgram(myresid,main='Residal Cumulative Periodogram')
qqnorm(myresid,main='Residual Normal QQ Plot')
qqline(myresid)
par(op)
dev.off()
load(file='createtable')
a<-table.start()
a<-table.row.start(a)
a<-table.element(a,'Estimated Parameters of Exponential Smoothing',2,TRUE)
a<-table.row.end(a)
a<-table.row.start(a)
a<-table.element(a,'Parameter',header=TRUE)
a<-table.element(a,'Value',header=TRUE)
a<-table.row.end(a)
a<-table.row.start(a)
a<-table.element(a,'alpha',header=TRUE)
a<-table.element(a,fit$alpha)
a<-table.row.end(a)
a<-table.row.start(a)
a<-table.element(a,'beta',header=TRUE)
a<-table.element(a,fit$beta)
a<-table.row.end(a)
a<-table.row.start(a)
a<-table.element(a,'gamma',header=TRUE)
a<-table.element(a,fit$gamma)
a<-table.row.end(a)
a<-table.end(a)
table.save(a,file='mytable.tab')
a<-table.start()
a<-table.row.start(a)
a<-table.element(a,'Interpolation Forecasts of Exponential Smoothing',4,TRUE)
a<-table.row.end(a)
a<-table.row.start(a)
a<-table.element(a,'t',header=TRUE)
a<-table.element(a,'Observed',header=TRUE)
a<-table.element(a,'Fitted',header=TRUE)
a<-table.element(a,'Residuals',header=TRUE)
a<-table.row.end(a)
for (i in 1:nxmK) {
a<-table.row.start(a)
a<-table.element(a,i+K,header=TRUE)
a<-table.element(a,x[i+K])
a<-table.element(a,fit$fitted[i,'xhat'])
a<-table.element(a,myresid[i])
a<-table.row.end(a)
}
a<-table.end(a)
table.save(a,file='mytable1.tab')
a<-table.start()
a<-table.row.start(a)
a<-table.element(a,'Extrapolation Forecasts of Exponential Smoothing',4,TRUE)
a<-table.row.end(a)
a<-table.row.start(a)
a<-table.element(a,'t',header=TRUE)
a<-table.element(a,'Forecast',header=TRUE)
a<-table.element(a,'95% Lower Bound',header=TRUE)
a<-table.element(a,'95% Upper Bound',header=TRUE)
a<-table.row.end(a)
for (i in 1:np) {
a<-table.row.start(a)
a<-table.element(a,nx+i,header=TRUE)
a<-table.element(a,p[i,'fit'])
a<-table.element(a,p[i,'lwr'])
a<-table.element(a,p[i,'upr'])
a<-table.row.end(a)
}
a<-table.end(a)
table.save(a,file='mytable2.tab')