\begin{tabular}{lllllllll}
\hline
Summary of computational transaction \tabularnewline
Raw Input & view raw input (R code)  \tabularnewline
Raw Output & view raw output of R engine  \tabularnewline
Computing time & 1 seconds \tabularnewline
R Server & 'Gwilym Jenkins' @ www.wessa.org \tabularnewline
\hline
\end{tabular}
%Source: https://freestatistics.org/blog/index.php?pk=121763&T=0
[TABLE]
[ROW][C]Summary of computational transaction[/C][/ROW]
[ROW][C]Raw Input[/C][C]view raw input (R code) [/C][/ROW]
[ROW][C]Raw Output[/C][C]view raw output of R engine [/C][/ROW]
[ROW][C]Computing time[/C][C]1 seconds[/C][/ROW]
[ROW][C]R Server[/C][C]'Gwilym Jenkins' @ www.wessa.org[/C][/ROW]
[/TABLE]
Source: https://freestatistics.org/blog/index.php?pk=121763&T=0
If you paste this QR Code into your document, anyone with a smartphone or tablet will be able to scan it and view this table in a browser.
If you paste this QR Code into your document, anyone with a smartphone or tablet will be able to scan it and view this table in a browser.
If you paste this QR Code into your document, anyone with a smartphone or tablet will be able to scan it and view this table in a browser.
If you paste this QR Code into your document, anyone with a smartphone or tablet will be able to scan it and view this table in a browser.
If you paste this QR Code into your document, anyone with a smartphone or tablet will be able to scan it and view this table in a browser.
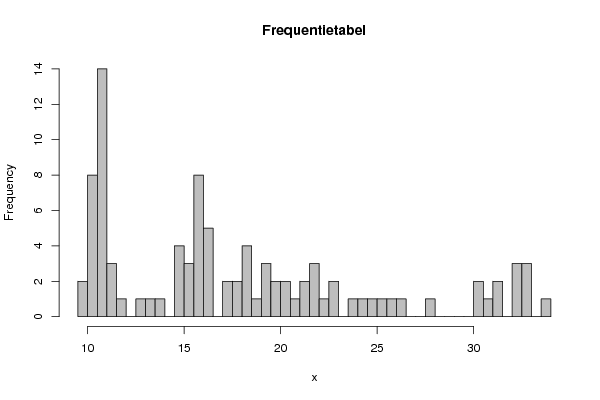
| Frequency Table (Histogram) | | Bins | Midpoint | Abs. Frequency | Rel. Frequency | Cumul. Rel. Freq. | Density | | [9.5,10[ | 9.75 | 2 | 0.021053 | 0.021053 | 0.042105 | | [10,10.5[ | 10.25 | 8 | 0.084211 | 0.105263 | 0.168421 | | [10.5,11[ | 10.75 | 14 | 0.147368 | 0.252632 | 0.294737 | | [11,11.5[ | 11.25 | 3 | 0.031579 | 0.284211 | 0.063158 | | [11.5,12[ | 11.75 | 1 | 0.010526 | 0.294737 | 0.021053 | | [12,12.5[ | 12.25 | 0 | 0 | 0.294737 | 0 | | [12.5,13[ | 12.75 | 1 | 0.010526 | 0.305263 | 0.021053 | | [13,13.5[ | 13.25 | 1 | 0.010526 | 0.315789 | 0.021053 | | [13.5,14[ | 13.75 | 1 | 0.010526 | 0.326316 | 0.021053 | | [14,14.5[ | 14.25 | 0 | 0 | 0.326316 | 0 | | [14.5,15[ | 14.75 | 4 | 0.042105 | 0.368421 | 0.084211 | | [15,15.5[ | 15.25 | 3 | 0.031579 | 0.4 | 0.063158 | | [15.5,16[ | 15.75 | 8 | 0.084211 | 0.484211 | 0.168421 | | [16,16.5[ | 16.25 | 5 | 0.052632 | 0.536842 | 0.105263 | | [16.5,17[ | 16.75 | 0 | 0 | 0.536842 | 0 | | [17,17.5[ | 17.25 | 2 | 0.021053 | 0.557895 | 0.042105 | | [17.5,18[ | 17.75 | 2 | 0.021053 | 0.578947 | 0.042105 | | [18,18.5[ | 18.25 | 4 | 0.042105 | 0.621053 | 0.084211 | | [18.5,19[ | 18.75 | 1 | 0.010526 | 0.631579 | 0.021053 | | [19,19.5[ | 19.25 | 3 | 0.031579 | 0.663158 | 0.063158 | | [19.5,20[ | 19.75 | 2 | 0.021053 | 0.684211 | 0.042105 | | [20,20.5[ | 20.25 | 2 | 0.021053 | 0.705263 | 0.042105 | | [20.5,21[ | 20.75 | 1 | 0.010526 | 0.715789 | 0.021053 | | [21,21.5[ | 21.25 | 2 | 0.021053 | 0.736842 | 0.042105 | | [21.5,22[ | 21.75 | 3 | 0.031579 | 0.768421 | 0.063158 | | [22,22.5[ | 22.25 | 1 | 0.010526 | 0.778947 | 0.021053 | | [22.5,23[ | 22.75 | 2 | 0.021053 | 0.8 | 0.042105 | | [23,23.5[ | 23.25 | 0 | 0 | 0.8 | 0 | | [23.5,24[ | 23.75 | 1 | 0.010526 | 0.810526 | 0.021053 | | [24,24.5[ | 24.25 | 1 | 0.010526 | 0.821053 | 0.021053 | | [24.5,25[ | 24.75 | 1 | 0.010526 | 0.831579 | 0.021053 | | [25,25.5[ | 25.25 | 1 | 0.010526 | 0.842105 | 0.021053 | | [25.5,26[ | 25.75 | 1 | 0.010526 | 0.852632 | 0.021053 | | [26,26.5[ | 26.25 | 1 | 0.010526 | 0.863158 | 0.021053 | | [26.5,27[ | 26.75 | 0 | 0 | 0.863158 | 0 | | [27,27.5[ | 27.25 | 0 | 0 | 0.863158 | 0 | | [27.5,28[ | 27.75 | 1 | 0.010526 | 0.873684 | 0.021053 | | [28,28.5[ | 28.25 | 0 | 0 | 0.873684 | 0 | | [28.5,29[ | 28.75 | 0 | 0 | 0.873684 | 0 | | [29,29.5[ | 29.25 | 0 | 0 | 0.873684 | 0 | | [29.5,30[ | 29.75 | 0 | 0 | 0.873684 | 0 | | [30,30.5[ | 30.25 | 2 | 0.021053 | 0.894737 | 0.042105 | | [30.5,31[ | 30.75 | 1 | 0.010526 | 0.905263 | 0.021053 | | [31,31.5[ | 31.25 | 2 | 0.021053 | 0.926316 | 0.042105 | | [31.5,32[ | 31.75 | 0 | 0 | 0.926316 | 0 | | [32,32.5[ | 32.25 | 3 | 0.031579 | 0.957895 | 0.063158 | | [32.5,33[ | 32.75 | 3 | 0.031579 | 0.989474 | 0.063158 | | [33,33.5[ | 33.25 | 0 | 0 | 0.989474 | 0 | | [33.5,34] | 33.75 | 1 | 0.010526 | 1 | 0.021053 |
\begin{tabular}{lllllllll}
\hline
Frequency Table (Histogram) \tabularnewline
Bins & Midpoint & Abs. Frequency & Rel. Frequency & Cumul. Rel. Freq. & Density \tabularnewline
[9.5,10[ & 9.75 & 2 & 0.021053 & 0.021053 & 0.042105 \tabularnewline
[10,10.5[ & 10.25 & 8 & 0.084211 & 0.105263 & 0.168421 \tabularnewline
[10.5,11[ & 10.75 & 14 & 0.147368 & 0.252632 & 0.294737 \tabularnewline
[11,11.5[ & 11.25 & 3 & 0.031579 & 0.284211 & 0.063158 \tabularnewline
[11.5,12[ & 11.75 & 1 & 0.010526 & 0.294737 & 0.021053 \tabularnewline
[12,12.5[ & 12.25 & 0 & 0 & 0.294737 & 0 \tabularnewline
[12.5,13[ & 12.75 & 1 & 0.010526 & 0.305263 & 0.021053 \tabularnewline
[13,13.5[ & 13.25 & 1 & 0.010526 & 0.315789 & 0.021053 \tabularnewline
[13.5,14[ & 13.75 & 1 & 0.010526 & 0.326316 & 0.021053 \tabularnewline
[14,14.5[ & 14.25 & 0 & 0 & 0.326316 & 0 \tabularnewline
[14.5,15[ & 14.75 & 4 & 0.042105 & 0.368421 & 0.084211 \tabularnewline
[15,15.5[ & 15.25 & 3 & 0.031579 & 0.4 & 0.063158 \tabularnewline
[15.5,16[ & 15.75 & 8 & 0.084211 & 0.484211 & 0.168421 \tabularnewline
[16,16.5[ & 16.25 & 5 & 0.052632 & 0.536842 & 0.105263 \tabularnewline
[16.5,17[ & 16.75 & 0 & 0 & 0.536842 & 0 \tabularnewline
[17,17.5[ & 17.25 & 2 & 0.021053 & 0.557895 & 0.042105 \tabularnewline
[17.5,18[ & 17.75 & 2 & 0.021053 & 0.578947 & 0.042105 \tabularnewline
[18,18.5[ & 18.25 & 4 & 0.042105 & 0.621053 & 0.084211 \tabularnewline
[18.5,19[ & 18.75 & 1 & 0.010526 & 0.631579 & 0.021053 \tabularnewline
[19,19.5[ & 19.25 & 3 & 0.031579 & 0.663158 & 0.063158 \tabularnewline
[19.5,20[ & 19.75 & 2 & 0.021053 & 0.684211 & 0.042105 \tabularnewline
[20,20.5[ & 20.25 & 2 & 0.021053 & 0.705263 & 0.042105 \tabularnewline
[20.5,21[ & 20.75 & 1 & 0.010526 & 0.715789 & 0.021053 \tabularnewline
[21,21.5[ & 21.25 & 2 & 0.021053 & 0.736842 & 0.042105 \tabularnewline
[21.5,22[ & 21.75 & 3 & 0.031579 & 0.768421 & 0.063158 \tabularnewline
[22,22.5[ & 22.25 & 1 & 0.010526 & 0.778947 & 0.021053 \tabularnewline
[22.5,23[ & 22.75 & 2 & 0.021053 & 0.8 & 0.042105 \tabularnewline
[23,23.5[ & 23.25 & 0 & 0 & 0.8 & 0 \tabularnewline
[23.5,24[ & 23.75 & 1 & 0.010526 & 0.810526 & 0.021053 \tabularnewline
[24,24.5[ & 24.25 & 1 & 0.010526 & 0.821053 & 0.021053 \tabularnewline
[24.5,25[ & 24.75 & 1 & 0.010526 & 0.831579 & 0.021053 \tabularnewline
[25,25.5[ & 25.25 & 1 & 0.010526 & 0.842105 & 0.021053 \tabularnewline
[25.5,26[ & 25.75 & 1 & 0.010526 & 0.852632 & 0.021053 \tabularnewline
[26,26.5[ & 26.25 & 1 & 0.010526 & 0.863158 & 0.021053 \tabularnewline
[26.5,27[ & 26.75 & 0 & 0 & 0.863158 & 0 \tabularnewline
[27,27.5[ & 27.25 & 0 & 0 & 0.863158 & 0 \tabularnewline
[27.5,28[ & 27.75 & 1 & 0.010526 & 0.873684 & 0.021053 \tabularnewline
[28,28.5[ & 28.25 & 0 & 0 & 0.873684 & 0 \tabularnewline
[28.5,29[ & 28.75 & 0 & 0 & 0.873684 & 0 \tabularnewline
[29,29.5[ & 29.25 & 0 & 0 & 0.873684 & 0 \tabularnewline
[29.5,30[ & 29.75 & 0 & 0 & 0.873684 & 0 \tabularnewline
[30,30.5[ & 30.25 & 2 & 0.021053 & 0.894737 & 0.042105 \tabularnewline
[30.5,31[ & 30.75 & 1 & 0.010526 & 0.905263 & 0.021053 \tabularnewline
[31,31.5[ & 31.25 & 2 & 0.021053 & 0.926316 & 0.042105 \tabularnewline
[31.5,32[ & 31.75 & 0 & 0 & 0.926316 & 0 \tabularnewline
[32,32.5[ & 32.25 & 3 & 0.031579 & 0.957895 & 0.063158 \tabularnewline
[32.5,33[ & 32.75 & 3 & 0.031579 & 0.989474 & 0.063158 \tabularnewline
[33,33.5[ & 33.25 & 0 & 0 & 0.989474 & 0 \tabularnewline
[33.5,34] & 33.75 & 1 & 0.010526 & 1 & 0.021053 \tabularnewline
\hline
\end{tabular}
%Source: https://freestatistics.org/blog/index.php?pk=121763&T=1
[TABLE]
[ROW][C]Frequency Table (Histogram)[/C][/ROW]
[ROW][C]Bins[/C][C]Midpoint[/C][C]Abs. Frequency[/C][C]Rel. Frequency[/C][C]Cumul. Rel. Freq.[/C][C]Density[/C][/ROW]
[ROW][C][9.5,10[[/C][C]9.75[/C][C]2[/C][C]0.021053[/C][C]0.021053[/C][C]0.042105[/C][/ROW]
[ROW][C][10,10.5[[/C][C]10.25[/C][C]8[/C][C]0.084211[/C][C]0.105263[/C][C]0.168421[/C][/ROW]
[ROW][C][10.5,11[[/C][C]10.75[/C][C]14[/C][C]0.147368[/C][C]0.252632[/C][C]0.294737[/C][/ROW]
[ROW][C][11,11.5[[/C][C]11.25[/C][C]3[/C][C]0.031579[/C][C]0.284211[/C][C]0.063158[/C][/ROW]
[ROW][C][11.5,12[[/C][C]11.75[/C][C]1[/C][C]0.010526[/C][C]0.294737[/C][C]0.021053[/C][/ROW]
[ROW][C][12,12.5[[/C][C]12.25[/C][C]0[/C][C]0[/C][C]0.294737[/C][C]0[/C][/ROW]
[ROW][C][12.5,13[[/C][C]12.75[/C][C]1[/C][C]0.010526[/C][C]0.305263[/C][C]0.021053[/C][/ROW]
[ROW][C][13,13.5[[/C][C]13.25[/C][C]1[/C][C]0.010526[/C][C]0.315789[/C][C]0.021053[/C][/ROW]
[ROW][C][13.5,14[[/C][C]13.75[/C][C]1[/C][C]0.010526[/C][C]0.326316[/C][C]0.021053[/C][/ROW]
[ROW][C][14,14.5[[/C][C]14.25[/C][C]0[/C][C]0[/C][C]0.326316[/C][C]0[/C][/ROW]
[ROW][C][14.5,15[[/C][C]14.75[/C][C]4[/C][C]0.042105[/C][C]0.368421[/C][C]0.084211[/C][/ROW]
[ROW][C][15,15.5[[/C][C]15.25[/C][C]3[/C][C]0.031579[/C][C]0.4[/C][C]0.063158[/C][/ROW]
[ROW][C][15.5,16[[/C][C]15.75[/C][C]8[/C][C]0.084211[/C][C]0.484211[/C][C]0.168421[/C][/ROW]
[ROW][C][16,16.5[[/C][C]16.25[/C][C]5[/C][C]0.052632[/C][C]0.536842[/C][C]0.105263[/C][/ROW]
[ROW][C][16.5,17[[/C][C]16.75[/C][C]0[/C][C]0[/C][C]0.536842[/C][C]0[/C][/ROW]
[ROW][C][17,17.5[[/C][C]17.25[/C][C]2[/C][C]0.021053[/C][C]0.557895[/C][C]0.042105[/C][/ROW]
[ROW][C][17.5,18[[/C][C]17.75[/C][C]2[/C][C]0.021053[/C][C]0.578947[/C][C]0.042105[/C][/ROW]
[ROW][C][18,18.5[[/C][C]18.25[/C][C]4[/C][C]0.042105[/C][C]0.621053[/C][C]0.084211[/C][/ROW]
[ROW][C][18.5,19[[/C][C]18.75[/C][C]1[/C][C]0.010526[/C][C]0.631579[/C][C]0.021053[/C][/ROW]
[ROW][C][19,19.5[[/C][C]19.25[/C][C]3[/C][C]0.031579[/C][C]0.663158[/C][C]0.063158[/C][/ROW]
[ROW][C][19.5,20[[/C][C]19.75[/C][C]2[/C][C]0.021053[/C][C]0.684211[/C][C]0.042105[/C][/ROW]
[ROW][C][20,20.5[[/C][C]20.25[/C][C]2[/C][C]0.021053[/C][C]0.705263[/C][C]0.042105[/C][/ROW]
[ROW][C][20.5,21[[/C][C]20.75[/C][C]1[/C][C]0.010526[/C][C]0.715789[/C][C]0.021053[/C][/ROW]
[ROW][C][21,21.5[[/C][C]21.25[/C][C]2[/C][C]0.021053[/C][C]0.736842[/C][C]0.042105[/C][/ROW]
[ROW][C][21.5,22[[/C][C]21.75[/C][C]3[/C][C]0.031579[/C][C]0.768421[/C][C]0.063158[/C][/ROW]
[ROW][C][22,22.5[[/C][C]22.25[/C][C]1[/C][C]0.010526[/C][C]0.778947[/C][C]0.021053[/C][/ROW]
[ROW][C][22.5,23[[/C][C]22.75[/C][C]2[/C][C]0.021053[/C][C]0.8[/C][C]0.042105[/C][/ROW]
[ROW][C][23,23.5[[/C][C]23.25[/C][C]0[/C][C]0[/C][C]0.8[/C][C]0[/C][/ROW]
[ROW][C][23.5,24[[/C][C]23.75[/C][C]1[/C][C]0.010526[/C][C]0.810526[/C][C]0.021053[/C][/ROW]
[ROW][C][24,24.5[[/C][C]24.25[/C][C]1[/C][C]0.010526[/C][C]0.821053[/C][C]0.021053[/C][/ROW]
[ROW][C][24.5,25[[/C][C]24.75[/C][C]1[/C][C]0.010526[/C][C]0.831579[/C][C]0.021053[/C][/ROW]
[ROW][C][25,25.5[[/C][C]25.25[/C][C]1[/C][C]0.010526[/C][C]0.842105[/C][C]0.021053[/C][/ROW]
[ROW][C][25.5,26[[/C][C]25.75[/C][C]1[/C][C]0.010526[/C][C]0.852632[/C][C]0.021053[/C][/ROW]
[ROW][C][26,26.5[[/C][C]26.25[/C][C]1[/C][C]0.010526[/C][C]0.863158[/C][C]0.021053[/C][/ROW]
[ROW][C][26.5,27[[/C][C]26.75[/C][C]0[/C][C]0[/C][C]0.863158[/C][C]0[/C][/ROW]
[ROW][C][27,27.5[[/C][C]27.25[/C][C]0[/C][C]0[/C][C]0.863158[/C][C]0[/C][/ROW]
[ROW][C][27.5,28[[/C][C]27.75[/C][C]1[/C][C]0.010526[/C][C]0.873684[/C][C]0.021053[/C][/ROW]
[ROW][C][28,28.5[[/C][C]28.25[/C][C]0[/C][C]0[/C][C]0.873684[/C][C]0[/C][/ROW]
[ROW][C][28.5,29[[/C][C]28.75[/C][C]0[/C][C]0[/C][C]0.873684[/C][C]0[/C][/ROW]
[ROW][C][29,29.5[[/C][C]29.25[/C][C]0[/C][C]0[/C][C]0.873684[/C][C]0[/C][/ROW]
[ROW][C][29.5,30[[/C][C]29.75[/C][C]0[/C][C]0[/C][C]0.873684[/C][C]0[/C][/ROW]
[ROW][C][30,30.5[[/C][C]30.25[/C][C]2[/C][C]0.021053[/C][C]0.894737[/C][C]0.042105[/C][/ROW]
[ROW][C][30.5,31[[/C][C]30.75[/C][C]1[/C][C]0.010526[/C][C]0.905263[/C][C]0.021053[/C][/ROW]
[ROW][C][31,31.5[[/C][C]31.25[/C][C]2[/C][C]0.021053[/C][C]0.926316[/C][C]0.042105[/C][/ROW]
[ROW][C][31.5,32[[/C][C]31.75[/C][C]0[/C][C]0[/C][C]0.926316[/C][C]0[/C][/ROW]
[ROW][C][32,32.5[[/C][C]32.25[/C][C]3[/C][C]0.031579[/C][C]0.957895[/C][C]0.063158[/C][/ROW]
[ROW][C][32.5,33[[/C][C]32.75[/C][C]3[/C][C]0.031579[/C][C]0.989474[/C][C]0.063158[/C][/ROW]
[ROW][C][33,33.5[[/C][C]33.25[/C][C]0[/C][C]0[/C][C]0.989474[/C][C]0[/C][/ROW]
[ROW][C][33.5,34][/C][C]33.75[/C][C]1[/C][C]0.010526[/C][C]1[/C][C]0.021053[/C][/ROW]
[/TABLE]
Source: https://freestatistics.org/blog/index.php?pk=121763&T=1
Globally Unique Identifier (entire table): ba.freestatistics.org/blog/index.php?pk=121763&T=1
As an alternative you can also use a QR Code:
The GUIDs for individual cells are displayed in the table below:
| Frequency Table (Histogram) | | Bins | Midpoint | Abs. Frequency | Rel. Frequency | Cumul. Rel. Freq. | Density | | [9.5,10[ | 9.75 | 2 | 0.021053 | 0.021053 | 0.042105 | | [10,10.5[ | 10.25 | 8 | 0.084211 | 0.105263 | 0.168421 | | [10.5,11[ | 10.75 | 14 | 0.147368 | 0.252632 | 0.294737 | | [11,11.5[ | 11.25 | 3 | 0.031579 | 0.284211 | 0.063158 | | [11.5,12[ | 11.75 | 1 | 0.010526 | 0.294737 | 0.021053 | | [12,12.5[ | 12.25 | 0 | 0 | 0.294737 | 0 | | [12.5,13[ | 12.75 | 1 | 0.010526 | 0.305263 | 0.021053 | | [13,13.5[ | 13.25 | 1 | 0.010526 | 0.315789 | 0.021053 | | [13.5,14[ | 13.75 | 1 | 0.010526 | 0.326316 | 0.021053 | | [14,14.5[ | 14.25 | 0 | 0 | 0.326316 | 0 | | [14.5,15[ | 14.75 | 4 | 0.042105 | 0.368421 | 0.084211 | | [15,15.5[ | 15.25 | 3 | 0.031579 | 0.4 | 0.063158 | | [15.5,16[ | 15.75 | 8 | 0.084211 | 0.484211 | 0.168421 | | [16,16.5[ | 16.25 | 5 | 0.052632 | 0.536842 | 0.105263 | | [16.5,17[ | 16.75 | 0 | 0 | 0.536842 | 0 | | [17,17.5[ | 17.25 | 2 | 0.021053 | 0.557895 | 0.042105 | | [17.5,18[ | 17.75 | 2 | 0.021053 | 0.578947 | 0.042105 | | [18,18.5[ | 18.25 | 4 | 0.042105 | 0.621053 | 0.084211 | | [18.5,19[ | 18.75 | 1 | 0.010526 | 0.631579 | 0.021053 | | [19,19.5[ | 19.25 | 3 | 0.031579 | 0.663158 | 0.063158 | | [19.5,20[ | 19.75 | 2 | 0.021053 | 0.684211 | 0.042105 | | [20,20.5[ | 20.25 | 2 | 0.021053 | 0.705263 | 0.042105 | | [20.5,21[ | 20.75 | 1 | 0.010526 | 0.715789 | 0.021053 | | [21,21.5[ | 21.25 | 2 | 0.021053 | 0.736842 | 0.042105 | | [21.5,22[ | 21.75 | 3 | 0.031579 | 0.768421 | 0.063158 | | [22,22.5[ | 22.25 | 1 | 0.010526 | 0.778947 | 0.021053 | | [22.5,23[ | 22.75 | 2 | 0.021053 | 0.8 | 0.042105 | | [23,23.5[ | 23.25 | 0 | 0 | 0.8 | 0 | | [23.5,24[ | 23.75 | 1 | 0.010526 | 0.810526 | 0.021053 | | [24,24.5[ | 24.25 | 1 | 0.010526 | 0.821053 | 0.021053 | | [24.5,25[ | 24.75 | 1 | 0.010526 | 0.831579 | 0.021053 | | [25,25.5[ | 25.25 | 1 | 0.010526 | 0.842105 | 0.021053 | | [25.5,26[ | 25.75 | 1 | 0.010526 | 0.852632 | 0.021053 | | [26,26.5[ | 26.25 | 1 | 0.010526 | 0.863158 | 0.021053 | | [26.5,27[ | 26.75 | 0 | 0 | 0.863158 | 0 | | [27,27.5[ | 27.25 | 0 | 0 | 0.863158 | 0 | | [27.5,28[ | 27.75 | 1 | 0.010526 | 0.873684 | 0.021053 | | [28,28.5[ | 28.25 | 0 | 0 | 0.873684 | 0 | | [28.5,29[ | 28.75 | 0 | 0 | 0.873684 | 0 | | [29,29.5[ | 29.25 | 0 | 0 | 0.873684 | 0 | | [29.5,30[ | 29.75 | 0 | 0 | 0.873684 | 0 | | [30,30.5[ | 30.25 | 2 | 0.021053 | 0.894737 | 0.042105 | | [30.5,31[ | 30.75 | 1 | 0.010526 | 0.905263 | 0.021053 | | [31,31.5[ | 31.25 | 2 | 0.021053 | 0.926316 | 0.042105 | | [31.5,32[ | 31.75 | 0 | 0 | 0.926316 | 0 | | [32,32.5[ | 32.25 | 3 | 0.031579 | 0.957895 | 0.063158 | | [32.5,33[ | 32.75 | 3 | 0.031579 | 0.989474 | 0.063158 | | [33,33.5[ | 33.25 | 0 | 0 | 0.989474 | 0 | | [33.5,34] | 33.75 | 1 | 0.010526 | 1 | 0.021053 |
If you paste this QR Code into your document, anyone with a smartphone or tablet will be able to scan it and view this table in a browser.
If you paste this QR Code into your document, anyone with a smartphone or tablet will be able to scan it and view this table in a browser.
If you paste this QR Code into your document, anyone with a smartphone or tablet will be able to scan it and view this table in a browser.
If you paste this QR Code into your document, anyone with a smartphone or tablet will be able to scan it and view this table in a browser.
If you paste this QR Code into your document, anyone with a smartphone or tablet will be able to scan it and view this table in a browser.
|