Free Statistics

of Irreproducible Research!

Author's title

Author*Unverified author*
R Software Modulerwasp_correlation.wasp
Title produced by softwarePearson Correlation
Date of computationMon, 16 May 2011 14:57:13 +0000
Cite this page as followsStatistical Computations at FreeStatistics.org, Office for Research Development and Education, URL https://freestatistics.org/blog/index.php?v=date/2011/May/16/t1305557581zqqacvnec4jiaqj.htm/, Retrieved Sun, 12 May 2024 22:05:55 +0000
Statistical Computations at FreeStatistics.org, Office for Research Development and Education, URL https://freestatistics.org/blog/index.php?pk=121626, Retrieved Sun, 12 May 2024 22:05:55 +0000
QR Codes:

Original text written by user:
IsPrivate?No (this computation is public)
User-defined keywords
Estimated Impact89
Family? (F = Feedback message, R = changed R code, M = changed R Module, P = changed Parameters, D = changed Data)
-       [Pearson Correlation] [3rd grade wkce an...] [2011-05-16 14:57:13] [d41d8cd98f00b204e9800998ecf8427e] [Current]
Feedback Forum

Post a new message
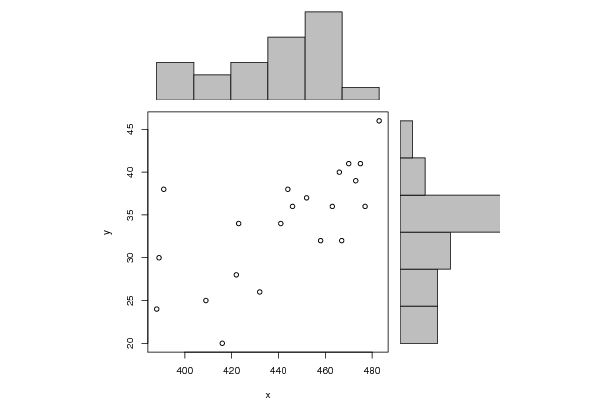
Dataseries X:
475
470
458
441
466
409
483
389
473
463
446
423
467
444
416
391
452
477
432
388
422
Dataseries Y:
41
41
32
34
40
25
46
30
39
36
36
34
32
38
20
38
37
36
26
24
28


Summary of computational transaction
Raw Inputview raw input (R code)
Raw Outputview raw output of R engine
Computing time1 seconds
R Server'Herman Ole Andreas Wold' @ www.yougetit.org

\begin{tabular}{lllllllll}
\hline
Summary of computational transaction \tabularnewline
Raw Input & view raw input (R code)  \tabularnewline
Raw Output & view raw output of R engine  \tabularnewline
Computing time & 1 seconds \tabularnewline
R Server & 'Herman Ole Andreas Wold' @ www.yougetit.org \tabularnewline
\hline
\end{tabular}
%Source: https://freestatistics.org/blog/index.php?pk=121626&T=0

[TABLE]
[ROW][C]Summary of computational transaction[/C][/ROW]
[ROW][C]Raw Input[/C][C]view raw input (R code) [/C][/ROW]
[ROW][C]Raw Output[/C][C]view raw output of R engine [/C][/ROW]
[ROW][C]Computing time[/C][C]1 seconds[/C][/ROW]
[ROW][C]R Server[/C][C]'Herman Ole Andreas Wold' @ www.yougetit.org[/C][/ROW]
[/TABLE]
Source: https://freestatistics.org/blog/index.php?pk=121626&T=0

Globally Unique Identifier (entire table): ba.freestatistics.org/blog/index.php?pk=121626&T=0

As an alternative you can also use a QR Code:  

The GUIDs for individual cells are displayed in the table below:

Summary of computational transaction
Raw Inputview raw input (R code)
Raw Outputview raw output of R engine
Computing time1 seconds
R Server'Herman Ole Andreas Wold' @ www.yougetit.org


Pearson Product Moment Correlation - Ungrouped Data
StatisticVariable XVariable Y
Mean442.14285714285733.9523809523809
Biased Variance890.97959183673540.8072562358277
Biased Standard Deviation29.84928126164416.38805574770819
Covariance135.157142857143
Correlation0.67506738734878
Determination0.455715977461908
T-Test3.98851413243924
p-value (2 sided)0.000786560905980505
p-value (1 sided)0.000393280452990252
Degrees of Freedom19
Number of Observations21

\begin{tabular}{lllllllll}
\hline
Pearson Product Moment Correlation - Ungrouped Data \tabularnewline
Statistic & Variable X & Variable Y \tabularnewline
Mean & 442.142857142857 & 33.9523809523809 \tabularnewline
Biased Variance & 890.979591836735 & 40.8072562358277 \tabularnewline
Biased Standard Deviation & 29.8492812616441 & 6.38805574770819 \tabularnewline
Covariance & 135.157142857143 \tabularnewline
Correlation & 0.67506738734878 \tabularnewline
Determination & 0.455715977461908 \tabularnewline
T-Test & 3.98851413243924 \tabularnewline
p-value (2 sided) & 0.000786560905980505 \tabularnewline
p-value (1 sided) & 0.000393280452990252 \tabularnewline
Degrees of Freedom & 19 \tabularnewline
Number of Observations & 21 \tabularnewline
\hline
\end{tabular}
%Source: https://freestatistics.org/blog/index.php?pk=121626&T=1

[TABLE]
[ROW][C]Pearson Product Moment Correlation - Ungrouped Data[/C][/ROW]
[ROW][C]Statistic[/C][C]Variable X[/C][C]Variable Y[/C][/ROW]
[ROW][C]Mean[/C][C]442.142857142857[/C][C]33.9523809523809[/C][/ROW]
[ROW][C]Biased Variance[/C][C]890.979591836735[/C][C]40.8072562358277[/C][/ROW]
[ROW][C]Biased Standard Deviation[/C][C]29.8492812616441[/C][C]6.38805574770819[/C][/ROW]
[ROW][C]Covariance[/C][C]135.157142857143[/C][/ROW]
[ROW][C]Correlation[/C][C]0.67506738734878[/C][/ROW]
[ROW][C]Determination[/C][C]0.455715977461908[/C][/ROW]
[ROW][C]T-Test[/C][C]3.98851413243924[/C][/ROW]
[ROW][C]p-value (2 sided)[/C][C]0.000786560905980505[/C][/ROW]
[ROW][C]p-value (1 sided)[/C][C]0.000393280452990252[/C][/ROW]
[ROW][C]Degrees of Freedom[/C][C]19[/C][/ROW]
[ROW][C]Number of Observations[/C][C]21[/C][/ROW]
[/TABLE]
Source: https://freestatistics.org/blog/index.php?pk=121626&T=1

Globally Unique Identifier (entire table): ba.freestatistics.org/blog/index.php?pk=121626&T=1

As an alternative you can also use a QR Code:  

The GUIDs for individual cells are displayed in the table below:

Pearson Product Moment Correlation - Ungrouped Data
StatisticVariable XVariable Y
Mean442.14285714285733.9523809523809
Biased Variance890.97959183673540.8072562358277
Biased Standard Deviation29.84928126164416.38805574770819
Covariance135.157142857143
Correlation0.67506738734878
Determination0.455715977461908
T-Test3.98851413243924
p-value (2 sided)0.000786560905980505
p-value (1 sided)0.000393280452990252
Degrees of Freedom19
Number of Observations21


Parameters (Session):
Parameters (R input):
R code (references can be found in the software module):
bitmap(file='test1.png')
histx <- hist(x, plot=FALSE)
histy <- hist(y, plot=FALSE)
maxcounts <- max(c(histx$counts, histx$counts))
xrange <- c(min(x),max(x))
yrange <- c(min(y),max(y))
nf <- layout(matrix(c(2,0,1,3),2,2,byrow=TRUE), c(3,1), c(1,3), TRUE)
par(mar=c(4,4,1,1))
plot(x, y, xlim=xrange, ylim=yrange, xlab=xlab, ylab=ylab)
par(mar=c(0,4,1,1))
barplot(histx$counts, axes=FALSE, ylim=c(0, maxcounts), space=0)
par(mar=c(4,0,1,1))
barplot(histy$counts, axes=FALSE, xlim=c(0, maxcounts), space=0, horiz=TRUE)
dev.off()
lx = length(x)
makebiased = (lx-1)/lx
varx = var(x)*makebiased
vary = var(y)*makebiased
corxy <- cor.test(x,y,method='pearson')
cxy <- as.matrix(corxy$estimate)[1,1]
load(file='createtable')
a<-table.start()
a<-table.row.start(a)
a<-table.element(a,'Pearson Product Moment Correlation - Ungrouped Data',3,TRUE)
a<-table.row.end(a)
a<-table.row.start(a)
a<-table.element(a,'Statistic',1,TRUE)
a<-table.element(a,'Variable X',1,TRUE)
a<-table.element(a,'Variable Y',1,TRUE)
a<-table.row.end(a)
a<-table.row.start(a)
a<-table.element(a,hyperlink('arithmetic_mean.htm','Mean',''),header=TRUE)
a<-table.element(a,mean(x))
a<-table.element(a,mean(y))
a<-table.row.end(a)
a<-table.row.start(a)
a<-table.element(a,hyperlink('biased.htm','Biased Variance',''),header=TRUE)
a<-table.element(a,varx)
a<-table.element(a,vary)
a<-table.row.end(a)
a<-table.row.start(a)
a<-table.element(a,hyperlink('biased1.htm','Biased Standard Deviation',''),header=TRUE)
a<-table.element(a,sqrt(varx))
a<-table.element(a,sqrt(vary))
a<-table.row.end(a)
a<-table.row.start(a)
a<-table.element(a,hyperlink('covariance.htm','Covariance',''),header=TRUE)
a<-table.element(a,cov(x,y),2)
a<-table.row.end(a)
a<-table.row.start(a)
a<-table.element(a,hyperlink('pearson_correlation.htm','Correlation',''),header=TRUE)
a<-table.element(a,cxy,2)
a<-table.row.end(a)
a<-table.row.start(a)
a<-table.element(a,hyperlink('coeff_of_determination.htm','Determination',''),header=TRUE)
a<-table.element(a,cxy*cxy,2)
a<-table.row.end(a)
a<-table.row.start(a)
a<-table.element(a,hyperlink('ttest_statistic.htm','T-Test',''),header=TRUE)
a<-table.element(a,as.matrix(corxy$statistic)[1,1],2)
a<-table.row.end(a)
a<-table.row.start(a)
a<-table.element(a,'p-value (2 sided)',header=TRUE)
a<-table.element(a,(p2 <- as.matrix(corxy$p.value)[1,1]),2)
a<-table.row.end(a)
a<-table.row.start(a)
a<-table.element(a,'p-value (1 sided)',header=TRUE)
a<-table.element(a,p2/2,2)
a<-table.row.end(a)
a<-table.row.start(a)
a<-table.element(a,'Degrees of Freedom',header=TRUE)
a<-table.element(a,lx-2,2)
a<-table.row.end(a)
a<-table.row.start(a)
a<-table.element(a,'Number of Observations',header=TRUE)
a<-table.element(a,lx,2)
a<-table.row.end(a)
a<-table.end(a)
table.save(a,file='mytable.tab')