Free Statistics

of Irreproducible Research!

Author's title

Author*Unverified author*
R Software Modulerwasp_smp.wasp
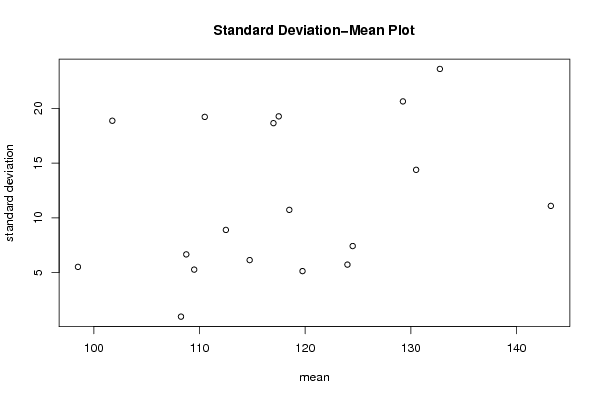
Title produced by softwareStandard Deviation-Mean Plot
Date of computationMon, 16 May 2011 13:46:54 +0000
Cite this page as followsStatistical Computations at FreeStatistics.org, Office for Research Development and Education, URL https://freestatistics.org/blog/index.php?v=date/2011/May/16/t1305553378ivft1s3tiil5311.htm/, Retrieved Sun, 12 May 2024 23:40:13 +0000
Statistical Computations at FreeStatistics.org, Office for Research Development and Education, URL https://freestatistics.org/blog/index.php?pk=121601, Retrieved Sun, 12 May 2024 23:40:13 +0000
QR Codes:

Original text written by user:
IsPrivate?No (this computation is public)
User-defined keywordsKDGP2W83
Estimated Impact115
Family? (F = Feedback message, R = changed R code, M = changed R Module, P = changed Parameters, D = changed Data)
-       [Standard Deviation-Mean Plot] [Inleiding kwantit...] [2011-05-16 13:46:54] [764118764852521a1756ded753a212d7] [Current]
Feedback Forum

Post a new message
Dataseries X:
130
127
122
117
112
113
149
157
157
147
137
132
125
123
117
114
111
112
144
150
149
134
123
116
117
111
105
102
95
93
124
130
124
115
106
105
105
101
95
93
84
87
116
120
117
109
105
107
109
109
108
107
99
103
131
137
135
124
118
121
121
118
113
107
100
102
130
136
133
120
112
109
110


Summary of computational transaction
Raw Inputview raw input (R code)
Raw Outputview raw output of R engine
Computing time2 seconds
R Server'George Udny Yule' @ 216.218.223.82

\begin{tabular}{lllllllll}
\hline
Summary of computational transaction \tabularnewline
Raw Input & view raw input (R code)  \tabularnewline
Raw Output & view raw output of R engine  \tabularnewline
Computing time & 2 seconds \tabularnewline
R Server & 'George Udny Yule' @ 216.218.223.82 \tabularnewline
\hline
\end{tabular}
%Source: https://freestatistics.org/blog/index.php?pk=121601&T=0

[TABLE]
[ROW][C]Summary of computational transaction[/C][/ROW]
[ROW][C]Raw Input[/C][C]view raw input (R code) [/C][/ROW]
[ROW][C]Raw Output[/C][C]view raw output of R engine [/C][/ROW]
[ROW][C]Computing time[/C][C]2 seconds[/C][/ROW]
[ROW][C]R Server[/C][C]'George Udny Yule' @ 216.218.223.82[/C][/ROW]
[/TABLE]
Source: https://freestatistics.org/blog/index.php?pk=121601&T=0

Globally Unique Identifier (entire table): ba.freestatistics.org/blog/index.php?pk=121601&T=0

As an alternative you can also use a QR Code:  

The GUIDs for individual cells are displayed in the table below:

Summary of computational transaction
Raw Inputview raw input (R code)
Raw Outputview raw output of R engine
Computing time2 seconds
R Server'George Udny Yule' @ 216.218.223.82


Standard Deviation-Mean Plot
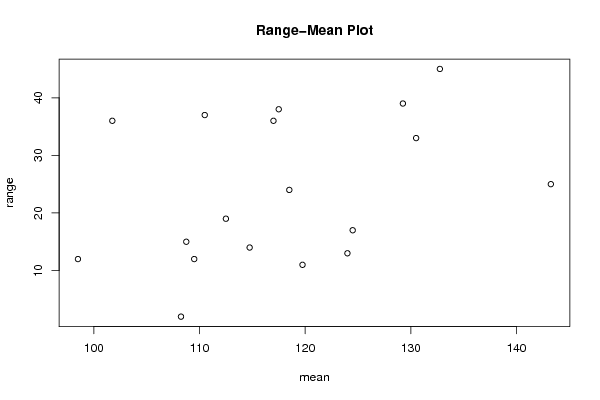
SectionMeanStandard DeviationRange
11245.7154760664940813
2132.7523.613202521753245
3143.2511.086778913041725
4119.755.123475382979811
5129.2520.645822822062639
6130.514.387494569938233
7108.756.6520673478250415
8110.519.22671752189337
9112.58.8881944173155919
1098.55.507570547286112
11101.7518.874586088176936
12109.55.2599112793531712
13108.250.9574271077563382
14117.519.278658321228338
15124.57.4161984870956617
16114.756.1305247192498414
1711718.654758106177636
18118.510.723805294763624

\begin{tabular}{lllllllll}
\hline
Standard Deviation-Mean Plot \tabularnewline
Section & Mean & Standard Deviation & Range \tabularnewline
1 & 124 & 5.71547606649408 & 13 \tabularnewline
2 & 132.75 & 23.6132025217532 & 45 \tabularnewline
3 & 143.25 & 11.0867789130417 & 25 \tabularnewline
4 & 119.75 & 5.1234753829798 & 11 \tabularnewline
5 & 129.25 & 20.6458228220626 & 39 \tabularnewline
6 & 130.5 & 14.3874945699382 & 33 \tabularnewline
7 & 108.75 & 6.65206734782504 & 15 \tabularnewline
8 & 110.5 & 19.226717521893 & 37 \tabularnewline
9 & 112.5 & 8.88819441731559 & 19 \tabularnewline
10 & 98.5 & 5.5075705472861 & 12 \tabularnewline
11 & 101.75 & 18.8745860881769 & 36 \tabularnewline
12 & 109.5 & 5.25991127935317 & 12 \tabularnewline
13 & 108.25 & 0.957427107756338 & 2 \tabularnewline
14 & 117.5 & 19.2786583212283 & 38 \tabularnewline
15 & 124.5 & 7.41619848709566 & 17 \tabularnewline
16 & 114.75 & 6.13052471924984 & 14 \tabularnewline
17 & 117 & 18.6547581061776 & 36 \tabularnewline
18 & 118.5 & 10.7238052947636 & 24 \tabularnewline
\hline
\end{tabular}
%Source: https://freestatistics.org/blog/index.php?pk=121601&T=1

[TABLE]
[ROW][C]Standard Deviation-Mean Plot[/C][/ROW]
[ROW][C]Section[/C][C]Mean[/C][C]Standard Deviation[/C][C]Range[/C][/ROW]
[ROW][C]1[/C][C]124[/C][C]5.71547606649408[/C][C]13[/C][/ROW]
[ROW][C]2[/C][C]132.75[/C][C]23.6132025217532[/C][C]45[/C][/ROW]
[ROW][C]3[/C][C]143.25[/C][C]11.0867789130417[/C][C]25[/C][/ROW]
[ROW][C]4[/C][C]119.75[/C][C]5.1234753829798[/C][C]11[/C][/ROW]
[ROW][C]5[/C][C]129.25[/C][C]20.6458228220626[/C][C]39[/C][/ROW]
[ROW][C]6[/C][C]130.5[/C][C]14.3874945699382[/C][C]33[/C][/ROW]
[ROW][C]7[/C][C]108.75[/C][C]6.65206734782504[/C][C]15[/C][/ROW]
[ROW][C]8[/C][C]110.5[/C][C]19.226717521893[/C][C]37[/C][/ROW]
[ROW][C]9[/C][C]112.5[/C][C]8.88819441731559[/C][C]19[/C][/ROW]
[ROW][C]10[/C][C]98.5[/C][C]5.5075705472861[/C][C]12[/C][/ROW]
[ROW][C]11[/C][C]101.75[/C][C]18.8745860881769[/C][C]36[/C][/ROW]
[ROW][C]12[/C][C]109.5[/C][C]5.25991127935317[/C][C]12[/C][/ROW]
[ROW][C]13[/C][C]108.25[/C][C]0.957427107756338[/C][C]2[/C][/ROW]
[ROW][C]14[/C][C]117.5[/C][C]19.2786583212283[/C][C]38[/C][/ROW]
[ROW][C]15[/C][C]124.5[/C][C]7.41619848709566[/C][C]17[/C][/ROW]
[ROW][C]16[/C][C]114.75[/C][C]6.13052471924984[/C][C]14[/C][/ROW]
[ROW][C]17[/C][C]117[/C][C]18.6547581061776[/C][C]36[/C][/ROW]
[ROW][C]18[/C][C]118.5[/C][C]10.7238052947636[/C][C]24[/C][/ROW]
[/TABLE]
Source: https://freestatistics.org/blog/index.php?pk=121601&T=1

Globally Unique Identifier (entire table): ba.freestatistics.org/blog/index.php?pk=121601&T=1

As an alternative you can also use a QR Code:  

The GUIDs for individual cells are displayed in the table below:

Standard Deviation-Mean Plot
SectionMeanStandard DeviationRange
11245.7154760664940813
2132.7523.613202521753245
3143.2511.086778913041725
4119.755.123475382979811
5129.2520.645822822062639
6130.514.387494569938233
7108.756.6520673478250415
8110.519.22671752189337
9112.58.8881944173155919
1098.55.507570547286112
11101.7518.874586088176936
12109.55.2599112793531712
13108.250.9574271077563382
14117.519.278658321228338
15124.57.4161984870956617
16114.756.1305247192498414
1711718.654758106177636
18118.510.723805294763624


Regression: S.E.(k) = alpha + beta * Mean(k)
alpha-9.46276481356506
beta0.178398508677144
S.D.0.143597071736551
T-STAT1.24235478147104
p-value0.232007021759737

\begin{tabular}{lllllllll}
\hline
Regression: S.E.(k) = alpha + beta * Mean(k) \tabularnewline
alpha & -9.46276481356506 \tabularnewline
beta & 0.178398508677144 \tabularnewline
S.D. & 0.143597071736551 \tabularnewline
T-STAT & 1.24235478147104 \tabularnewline
p-value & 0.232007021759737 \tabularnewline
\hline
\end{tabular}
%Source: https://freestatistics.org/blog/index.php?pk=121601&T=2

[TABLE]
[ROW][C]Regression: S.E.(k) = alpha + beta * Mean(k)[/C][/ROW]
[ROW][C]alpha[/C][C]-9.46276481356506[/C][/ROW]
[ROW][C]beta[/C][C]0.178398508677144[/C][/ROW]
[ROW][C]S.D.[/C][C]0.143597071736551[/C][/ROW]
[ROW][C]T-STAT[/C][C]1.24235478147104[/C][/ROW]
[ROW][C]p-value[/C][C]0.232007021759737[/C][/ROW]
[/TABLE]
Source: https://freestatistics.org/blog/index.php?pk=121601&T=2

Globally Unique Identifier (entire table): ba.freestatistics.org/blog/index.php?pk=121601&T=2

As an alternative you can also use a QR Code:  

The GUIDs for individual cells are displayed in the table below:

Regression: S.E.(k) = alpha + beta * Mean(k)
alpha-9.46276481356506
beta0.178398508677144
S.D.0.143597071736551
T-STAT1.24235478147104
p-value0.232007021759737


Regression: ln S.E.(k) = alpha + beta * ln Mean(k)
alpha-10.7988973416831
beta2.73269205741713
S.D.1.92826469551685
T-STAT1.41717683457595
p-value0.17560955812925
Lambda-1.73269205741713

\begin{tabular}{lllllllll}
\hline
Regression: ln S.E.(k) = alpha + beta * ln Mean(k) \tabularnewline
alpha & -10.7988973416831 \tabularnewline
beta & 2.73269205741713 \tabularnewline
S.D. & 1.92826469551685 \tabularnewline
T-STAT & 1.41717683457595 \tabularnewline
p-value & 0.17560955812925 \tabularnewline
Lambda & -1.73269205741713 \tabularnewline
\hline
\end{tabular}
%Source: https://freestatistics.org/blog/index.php?pk=121601&T=3

[TABLE]
[ROW][C]Regression: ln S.E.(k) = alpha + beta * ln Mean(k)[/C][/ROW]
[ROW][C]alpha[/C][C]-10.7988973416831[/C][/ROW]
[ROW][C]beta[/C][C]2.73269205741713[/C][/ROW]
[ROW][C]S.D.[/C][C]1.92826469551685[/C][/ROW]
[ROW][C]T-STAT[/C][C]1.41717683457595[/C][/ROW]
[ROW][C]p-value[/C][C]0.17560955812925[/C][/ROW]
[ROW][C]Lambda[/C][C]-1.73269205741713[/C][/ROW]
[/TABLE]
Source: https://freestatistics.org/blog/index.php?pk=121601&T=3

Globally Unique Identifier (entire table): ba.freestatistics.org/blog/index.php?pk=121601&T=3

As an alternative you can also use a QR Code:  

The GUIDs for individual cells are displayed in the table below:

Regression: ln S.E.(k) = alpha + beta * ln Mean(k)
alpha-10.7988973416831
beta2.73269205741713
S.D.1.92826469551685
T-STAT1.41717683457595
p-value0.17560955812925
Lambda-1.73269205741713


Parameters (Session):
par1 = 4 ;
Parameters (R input):
par1 = 4 ;
R code (references can be found in the software module):
par1 <- as.numeric(par1)
(n <- length(x))
(np <- floor(n / par1))
arr <- array(NA,dim=c(par1,np))
j <- 0
k <- 1
for (i in 1:(np*par1))
{
j = j + 1
arr[j,k] <- x[i]
if (j == par1) {
j = 0
k=k+1
}
}
arr
arr.mean <- array(NA,dim=np)
arr.sd <- array(NA,dim=np)
arr.range <- array(NA,dim=np)
for (j in 1:np)
{
arr.mean[j] <- mean(arr[,j],na.rm=TRUE)
arr.sd[j] <- sd(arr[,j],na.rm=TRUE)
arr.range[j] <- max(arr[,j],na.rm=TRUE) - min(arr[,j],na.rm=TRUE)
}
arr.mean
arr.sd
arr.range
(lm1 <- lm(arr.sd~arr.mean))
(lnlm1 <- lm(log(arr.sd)~log(arr.mean)))
(lm2 <- lm(arr.range~arr.mean))
bitmap(file='test1.png')
plot(arr.mean,arr.sd,main='Standard Deviation-Mean Plot',xlab='mean',ylab='standard deviation')
dev.off()
bitmap(file='test2.png')
plot(arr.mean,arr.range,main='Range-Mean Plot',xlab='mean',ylab='range')
dev.off()
load(file='createtable')
a<-table.start()
a<-table.row.start(a)
a<-table.element(a,'Standard Deviation-Mean Plot',4,TRUE)
a<-table.row.end(a)
a<-table.row.start(a)
a<-table.element(a,'Section',header=TRUE)
a<-table.element(a,'Mean',header=TRUE)
a<-table.element(a,'Standard Deviation',header=TRUE)
a<-table.element(a,'Range',header=TRUE)
a<-table.row.end(a)
for (j in 1:np) {
a<-table.row.start(a)
a<-table.element(a,j,header=TRUE)
a<-table.element(a,arr.mean[j])
a<-table.element(a,arr.sd[j] )
a<-table.element(a,arr.range[j] )
a<-table.row.end(a)
}
a<-table.end(a)
table.save(a,file='mytable.tab')
a<-table.start()
a<-table.row.start(a)
a<-table.element(a,'Regression: S.E.(k) = alpha + beta * Mean(k)',2,TRUE)
a<-table.row.end(a)
a<-table.row.start(a)
a<-table.element(a,'alpha',header=TRUE)
a<-table.element(a,lm1$coefficients[[1]])
a<-table.row.end(a)
a<-table.row.start(a)
a<-table.element(a,'beta',header=TRUE)
a<-table.element(a,lm1$coefficients[[2]])
a<-table.row.end(a)
a<-table.row.start(a)
a<-table.element(a,'S.D.',header=TRUE)
a<-table.element(a,summary(lm1)$coefficients[2,2])
a<-table.row.end(a)
a<-table.row.start(a)
a<-table.element(a,'T-STAT',header=TRUE)
a<-table.element(a,summary(lm1)$coefficients[2,3])
a<-table.row.end(a)
a<-table.row.start(a)
a<-table.element(a,'p-value',header=TRUE)
a<-table.element(a,summary(lm1)$coefficients[2,4])
a<-table.row.end(a)
a<-table.end(a)
table.save(a,file='mytable1.tab')
a<-table.start()
a<-table.row.start(a)
a<-table.element(a,'Regression: ln S.E.(k) = alpha + beta * ln Mean(k)',2,TRUE)
a<-table.row.end(a)
a<-table.row.start(a)
a<-table.element(a,'alpha',header=TRUE)
a<-table.element(a,lnlm1$coefficients[[1]])
a<-table.row.end(a)
a<-table.row.start(a)
a<-table.element(a,'beta',header=TRUE)
a<-table.element(a,lnlm1$coefficients[[2]])
a<-table.row.end(a)
a<-table.row.start(a)
a<-table.element(a,'S.D.',header=TRUE)
a<-table.element(a,summary(lnlm1)$coefficients[2,2])
a<-table.row.end(a)
a<-table.row.start(a)
a<-table.element(a,'T-STAT',header=TRUE)
a<-table.element(a,summary(lnlm1)$coefficients[2,3])
a<-table.row.end(a)
a<-table.row.start(a)
a<-table.element(a,'p-value',header=TRUE)
a<-table.element(a,summary(lnlm1)$coefficients[2,4])
a<-table.row.end(a)
a<-table.row.start(a)
a<-table.element(a,'Lambda',header=TRUE)
a<-table.element(a,1-lnlm1$coefficients[[2]])
a<-table.row.end(a)
a<-table.end(a)
table.save(a,file='mytable2.tab')