Free Statistics

of Irreproducible Research!

Author's title

Author*Unverified author*
R Software Modulerwasp_decompose.wasp
Title produced by softwareClassical Decomposition
Date of computationThu, 12 May 2011 16:02:53 +0000
Cite this page as followsStatistical Computations at FreeStatistics.org, Office for Research Development and Education, URL https://freestatistics.org/blog/index.php?v=date/2011/May/12/t130521599816p3zjru5slpj3d.htm/, Retrieved Fri, 10 May 2024 08:34:34 +0000
Statistical Computations at FreeStatistics.org, Office for Research Development and Education, URL https://freestatistics.org/blog/index.php?pk=121515, Retrieved Fri, 10 May 2024 08:34:34 +0000
QR Codes:

Original text written by user:
IsPrivate?No (this computation is public)
User-defined keywordsKDGP2W92
Estimated Impact159
Family? (F = Feedback message, R = changed R code, M = changed R Module, P = changed Parameters, D = changed Data)
-       [Classical Decomposition] [Decomposition sha...] [2011-05-12 16:02:53] [d41d8cd98f00b204e9800998ecf8427e] [Current]
Feedback Forum

Post a new message
Dataseries X:
266
145.9
183.1
119.3
180.3
168.5
231.8
224.5
192.8
122.9
336.5
185.9
194.3
149.5
210.1
273.3
191.4
287
226
303.6
289.9
421.6
264.5
342.3
339.7
440.4
315.9
439.3
401.3
437.4
575.5
407.6
682
475.3
581.3
646.9


Summary of computational transaction
Raw Inputview raw input (R code)
Raw Outputview raw output of R engine
Computing time3 seconds
R Server'RServer@AstonUniversity' @ vre.aston.ac.uk

\begin{tabular}{lllllllll}
\hline
Summary of computational transaction \tabularnewline
Raw Input & view raw input (R code)  \tabularnewline
Raw Output & view raw output of R engine  \tabularnewline
Computing time & 3 seconds \tabularnewline
R Server & 'RServer@AstonUniversity' @ vre.aston.ac.uk \tabularnewline
\hline
\end{tabular}
%Source: https://freestatistics.org/blog/index.php?pk=121515&T=0

[TABLE]
[ROW][C]Summary of computational transaction[/C][/ROW]
[ROW][C]Raw Input[/C][C]view raw input (R code) [/C][/ROW]
[ROW][C]Raw Output[/C][C]view raw output of R engine [/C][/ROW]
[ROW][C]Computing time[/C][C]3 seconds[/C][/ROW]
[ROW][C]R Server[/C][C]'RServer@AstonUniversity' @ vre.aston.ac.uk[/C][/ROW]
[/TABLE]
Source: https://freestatistics.org/blog/index.php?pk=121515&T=0

Globally Unique Identifier (entire table): ba.freestatistics.org/blog/index.php?pk=121515&T=0

As an alternative you can also use a QR Code:  

The GUIDs for individual cells are displayed in the table below:

Summary of computational transaction
Raw Inputview raw input (R code)
Raw Outputview raw output of R engine
Computing time3 seconds
R Server'RServer@AstonUniversity' @ vre.aston.ac.uk


Classical Decomposition by Moving Averages
tObservationsFitTrendSeasonalRandom
1266NANA0.922912622562754NA
2145.9NANA0.922549460321224NA
3183.1NANA0.861981590999753NA
4119.3NANA1.0913741878167NA
5180.3NANA0.84423631722417NA
6168.5NANA1.04118732996762NA
7231.8199.47548302647193.4708333333331.031036459551461.16204756836829
8224.5215.50900931004190.6333333333331.130489644920651.04171979036396
9192.8190.189687269425191.9083333333330.9910444427604781.01372478586011
10122.9197.20496180718199.450.988743854636150.623209471373074
11336.5253.672936856295206.3291666666671.22945747784711.32651123202246
12185.9200.081227741173211.7291666666670.9449866113919420.929122647330423
13194.3199.741364338144216.4250.9229126225627540.972757949480448
14149.5202.480386760085219.4791666666670.9225494603212240.738343117534339
15210.1195.515382788556226.8208333333330.8619815909997531.0745957530473
16273.3265.54498207315243.31251.09137418781671.02920415918352
17191.4213.387764481052252.7583333333330.844236317224170.896958644585244
18287266.830282987453256.2751.041187329967621.07559005966911
19226277.194152150409268.851.031036459551460.815313015252103
20303.6324.48350070687287.0291666666671.130489644920650.935640793256433
21289.9300.839799303633303.5583333333330.9910444427604780.963635797760284
22421.6311.33896076068314.8833333333330.988743854636151.35415111224732
23264.5406.392046562869330.5458333333331.22945747784710.650849351597932
24342.3326.547998454914345.5583333333330.9449866113919421.04823793628997
25339.7338.143648499211366.38750.9229126225627541.00460263413995
26440.4355.442931237429385.2833333333330.9225494603212241.23901746608606
27315.9349.925018456312405.9541666666670.8619815909997530.902764830573096
28439.3463.320174475333424.5291666666671.09137418781670.948156424436874
29401.3371.43583836806439.9666666666670.844236317224171.08040193903515
30437.4485.045794226501465.8583333333331.041187329967620.901770523951287
31575.5NANA1.03103645955146NA
32407.6NANA1.13048964492065NA
33682NANA0.991044442760478NA
34475.3NANA0.98874385463615NA
35581.3NANA1.2294574778471NA
36646.9NANA0.944986611391942NA

\begin{tabular}{lllllllll}
\hline
Classical Decomposition by Moving Averages \tabularnewline
t & Observations & Fit & Trend & Seasonal & Random \tabularnewline
1 & 266 & NA & NA & 0.922912622562754 & NA \tabularnewline
2 & 145.9 & NA & NA & 0.922549460321224 & NA \tabularnewline
3 & 183.1 & NA & NA & 0.861981590999753 & NA \tabularnewline
4 & 119.3 & NA & NA & 1.0913741878167 & NA \tabularnewline
5 & 180.3 & NA & NA & 0.84423631722417 & NA \tabularnewline
6 & 168.5 & NA & NA & 1.04118732996762 & NA \tabularnewline
7 & 231.8 & 199.47548302647 & 193.470833333333 & 1.03103645955146 & 1.16204756836829 \tabularnewline
8 & 224.5 & 215.50900931004 & 190.633333333333 & 1.13048964492065 & 1.04171979036396 \tabularnewline
9 & 192.8 & 190.189687269425 & 191.908333333333 & 0.991044442760478 & 1.01372478586011 \tabularnewline
10 & 122.9 & 197.20496180718 & 199.45 & 0.98874385463615 & 0.623209471373074 \tabularnewline
11 & 336.5 & 253.672936856295 & 206.329166666667 & 1.2294574778471 & 1.32651123202246 \tabularnewline
12 & 185.9 & 200.081227741173 & 211.729166666667 & 0.944986611391942 & 0.929122647330423 \tabularnewline
13 & 194.3 & 199.741364338144 & 216.425 & 0.922912622562754 & 0.972757949480448 \tabularnewline
14 & 149.5 & 202.480386760085 & 219.479166666667 & 0.922549460321224 & 0.738343117534339 \tabularnewline
15 & 210.1 & 195.515382788556 & 226.820833333333 & 0.861981590999753 & 1.0745957530473 \tabularnewline
16 & 273.3 & 265.54498207315 & 243.3125 & 1.0913741878167 & 1.02920415918352 \tabularnewline
17 & 191.4 & 213.387764481052 & 252.758333333333 & 0.84423631722417 & 0.896958644585244 \tabularnewline
18 & 287 & 266.830282987453 & 256.275 & 1.04118732996762 & 1.07559005966911 \tabularnewline
19 & 226 & 277.194152150409 & 268.85 & 1.03103645955146 & 0.815313015252103 \tabularnewline
20 & 303.6 & 324.48350070687 & 287.029166666667 & 1.13048964492065 & 0.935640793256433 \tabularnewline
21 & 289.9 & 300.839799303633 & 303.558333333333 & 0.991044442760478 & 0.963635797760284 \tabularnewline
22 & 421.6 & 311.33896076068 & 314.883333333333 & 0.98874385463615 & 1.35415111224732 \tabularnewline
23 & 264.5 & 406.392046562869 & 330.545833333333 & 1.2294574778471 & 0.650849351597932 \tabularnewline
24 & 342.3 & 326.547998454914 & 345.558333333333 & 0.944986611391942 & 1.04823793628997 \tabularnewline
25 & 339.7 & 338.143648499211 & 366.3875 & 0.922912622562754 & 1.00460263413995 \tabularnewline
26 & 440.4 & 355.442931237429 & 385.283333333333 & 0.922549460321224 & 1.23901746608606 \tabularnewline
27 & 315.9 & 349.925018456312 & 405.954166666667 & 0.861981590999753 & 0.902764830573096 \tabularnewline
28 & 439.3 & 463.320174475333 & 424.529166666667 & 1.0913741878167 & 0.948156424436874 \tabularnewline
29 & 401.3 & 371.43583836806 & 439.966666666667 & 0.84423631722417 & 1.08040193903515 \tabularnewline
30 & 437.4 & 485.045794226501 & 465.858333333333 & 1.04118732996762 & 0.901770523951287 \tabularnewline
31 & 575.5 & NA & NA & 1.03103645955146 & NA \tabularnewline
32 & 407.6 & NA & NA & 1.13048964492065 & NA \tabularnewline
33 & 682 & NA & NA & 0.991044442760478 & NA \tabularnewline
34 & 475.3 & NA & NA & 0.98874385463615 & NA \tabularnewline
35 & 581.3 & NA & NA & 1.2294574778471 & NA \tabularnewline
36 & 646.9 & NA & NA & 0.944986611391942 & NA \tabularnewline
\hline
\end{tabular}
%Source: https://freestatistics.org/blog/index.php?pk=121515&T=1

[TABLE]
[ROW][C]Classical Decomposition by Moving Averages[/C][/ROW]
[ROW][C]t[/C][C]Observations[/C][C]Fit[/C][C]Trend[/C][C]Seasonal[/C][C]Random[/C][/ROW]
[ROW][C]1[/C][C]266[/C][C]NA[/C][C]NA[/C][C]0.922912622562754[/C][C]NA[/C][/ROW]
[ROW][C]2[/C][C]145.9[/C][C]NA[/C][C]NA[/C][C]0.922549460321224[/C][C]NA[/C][/ROW]
[ROW][C]3[/C][C]183.1[/C][C]NA[/C][C]NA[/C][C]0.861981590999753[/C][C]NA[/C][/ROW]
[ROW][C]4[/C][C]119.3[/C][C]NA[/C][C]NA[/C][C]1.0913741878167[/C][C]NA[/C][/ROW]
[ROW][C]5[/C][C]180.3[/C][C]NA[/C][C]NA[/C][C]0.84423631722417[/C][C]NA[/C][/ROW]
[ROW][C]6[/C][C]168.5[/C][C]NA[/C][C]NA[/C][C]1.04118732996762[/C][C]NA[/C][/ROW]
[ROW][C]7[/C][C]231.8[/C][C]199.47548302647[/C][C]193.470833333333[/C][C]1.03103645955146[/C][C]1.16204756836829[/C][/ROW]
[ROW][C]8[/C][C]224.5[/C][C]215.50900931004[/C][C]190.633333333333[/C][C]1.13048964492065[/C][C]1.04171979036396[/C][/ROW]
[ROW][C]9[/C][C]192.8[/C][C]190.189687269425[/C][C]191.908333333333[/C][C]0.991044442760478[/C][C]1.01372478586011[/C][/ROW]
[ROW][C]10[/C][C]122.9[/C][C]197.20496180718[/C][C]199.45[/C][C]0.98874385463615[/C][C]0.623209471373074[/C][/ROW]
[ROW][C]11[/C][C]336.5[/C][C]253.672936856295[/C][C]206.329166666667[/C][C]1.2294574778471[/C][C]1.32651123202246[/C][/ROW]
[ROW][C]12[/C][C]185.9[/C][C]200.081227741173[/C][C]211.729166666667[/C][C]0.944986611391942[/C][C]0.929122647330423[/C][/ROW]
[ROW][C]13[/C][C]194.3[/C][C]199.741364338144[/C][C]216.425[/C][C]0.922912622562754[/C][C]0.972757949480448[/C][/ROW]
[ROW][C]14[/C][C]149.5[/C][C]202.480386760085[/C][C]219.479166666667[/C][C]0.922549460321224[/C][C]0.738343117534339[/C][/ROW]
[ROW][C]15[/C][C]210.1[/C][C]195.515382788556[/C][C]226.820833333333[/C][C]0.861981590999753[/C][C]1.0745957530473[/C][/ROW]
[ROW][C]16[/C][C]273.3[/C][C]265.54498207315[/C][C]243.3125[/C][C]1.0913741878167[/C][C]1.02920415918352[/C][/ROW]
[ROW][C]17[/C][C]191.4[/C][C]213.387764481052[/C][C]252.758333333333[/C][C]0.84423631722417[/C][C]0.896958644585244[/C][/ROW]
[ROW][C]18[/C][C]287[/C][C]266.830282987453[/C][C]256.275[/C][C]1.04118732996762[/C][C]1.07559005966911[/C][/ROW]
[ROW][C]19[/C][C]226[/C][C]277.194152150409[/C][C]268.85[/C][C]1.03103645955146[/C][C]0.815313015252103[/C][/ROW]
[ROW][C]20[/C][C]303.6[/C][C]324.48350070687[/C][C]287.029166666667[/C][C]1.13048964492065[/C][C]0.935640793256433[/C][/ROW]
[ROW][C]21[/C][C]289.9[/C][C]300.839799303633[/C][C]303.558333333333[/C][C]0.991044442760478[/C][C]0.963635797760284[/C][/ROW]
[ROW][C]22[/C][C]421.6[/C][C]311.33896076068[/C][C]314.883333333333[/C][C]0.98874385463615[/C][C]1.35415111224732[/C][/ROW]
[ROW][C]23[/C][C]264.5[/C][C]406.392046562869[/C][C]330.545833333333[/C][C]1.2294574778471[/C][C]0.650849351597932[/C][/ROW]
[ROW][C]24[/C][C]342.3[/C][C]326.547998454914[/C][C]345.558333333333[/C][C]0.944986611391942[/C][C]1.04823793628997[/C][/ROW]
[ROW][C]25[/C][C]339.7[/C][C]338.143648499211[/C][C]366.3875[/C][C]0.922912622562754[/C][C]1.00460263413995[/C][/ROW]
[ROW][C]26[/C][C]440.4[/C][C]355.442931237429[/C][C]385.283333333333[/C][C]0.922549460321224[/C][C]1.23901746608606[/C][/ROW]
[ROW][C]27[/C][C]315.9[/C][C]349.925018456312[/C][C]405.954166666667[/C][C]0.861981590999753[/C][C]0.902764830573096[/C][/ROW]
[ROW][C]28[/C][C]439.3[/C][C]463.320174475333[/C][C]424.529166666667[/C][C]1.0913741878167[/C][C]0.948156424436874[/C][/ROW]
[ROW][C]29[/C][C]401.3[/C][C]371.43583836806[/C][C]439.966666666667[/C][C]0.84423631722417[/C][C]1.08040193903515[/C][/ROW]
[ROW][C]30[/C][C]437.4[/C][C]485.045794226501[/C][C]465.858333333333[/C][C]1.04118732996762[/C][C]0.901770523951287[/C][/ROW]
[ROW][C]31[/C][C]575.5[/C][C]NA[/C][C]NA[/C][C]1.03103645955146[/C][C]NA[/C][/ROW]
[ROW][C]32[/C][C]407.6[/C][C]NA[/C][C]NA[/C][C]1.13048964492065[/C][C]NA[/C][/ROW]
[ROW][C]33[/C][C]682[/C][C]NA[/C][C]NA[/C][C]0.991044442760478[/C][C]NA[/C][/ROW]
[ROW][C]34[/C][C]475.3[/C][C]NA[/C][C]NA[/C][C]0.98874385463615[/C][C]NA[/C][/ROW]
[ROW][C]35[/C][C]581.3[/C][C]NA[/C][C]NA[/C][C]1.2294574778471[/C][C]NA[/C][/ROW]
[ROW][C]36[/C][C]646.9[/C][C]NA[/C][C]NA[/C][C]0.944986611391942[/C][C]NA[/C][/ROW]
[/TABLE]
Source: https://freestatistics.org/blog/index.php?pk=121515&T=1

Globally Unique Identifier (entire table): ba.freestatistics.org/blog/index.php?pk=121515&T=1

As an alternative you can also use a QR Code:  

The GUIDs for individual cells are displayed in the table below:

Classical Decomposition by Moving Averages
tObservationsFitTrendSeasonalRandom
1266NANA0.922912622562754NA
2145.9NANA0.922549460321224NA
3183.1NANA0.861981590999753NA
4119.3NANA1.0913741878167NA
5180.3NANA0.84423631722417NA
6168.5NANA1.04118732996762NA
7231.8199.47548302647193.4708333333331.031036459551461.16204756836829
8224.5215.50900931004190.6333333333331.130489644920651.04171979036396
9192.8190.189687269425191.9083333333330.9910444427604781.01372478586011
10122.9197.20496180718199.450.988743854636150.623209471373074
11336.5253.672936856295206.3291666666671.22945747784711.32651123202246
12185.9200.081227741173211.7291666666670.9449866113919420.929122647330423
13194.3199.741364338144216.4250.9229126225627540.972757949480448
14149.5202.480386760085219.4791666666670.9225494603212240.738343117534339
15210.1195.515382788556226.8208333333330.8619815909997531.0745957530473
16273.3265.54498207315243.31251.09137418781671.02920415918352
17191.4213.387764481052252.7583333333330.844236317224170.896958644585244
18287266.830282987453256.2751.041187329967621.07559005966911
19226277.194152150409268.851.031036459551460.815313015252103
20303.6324.48350070687287.0291666666671.130489644920650.935640793256433
21289.9300.839799303633303.5583333333330.9910444427604780.963635797760284
22421.6311.33896076068314.8833333333330.988743854636151.35415111224732
23264.5406.392046562869330.5458333333331.22945747784710.650849351597932
24342.3326.547998454914345.5583333333330.9449866113919421.04823793628997
25339.7338.143648499211366.38750.9229126225627541.00460263413995
26440.4355.442931237429385.2833333333330.9225494603212241.23901746608606
27315.9349.925018456312405.9541666666670.8619815909997530.902764830573096
28439.3463.320174475333424.5291666666671.09137418781670.948156424436874
29401.3371.43583836806439.9666666666670.844236317224171.08040193903515
30437.4485.045794226501465.8583333333331.041187329967620.901770523951287
31575.5NANA1.03103645955146NA
32407.6NANA1.13048964492065NA
33682NANA0.991044442760478NA
34475.3NANA0.98874385463615NA
35581.3NANA1.2294574778471NA
36646.9NANA0.944986611391942NA


Parameters (Session):
par1 = multiplicative ; par2 = 12 ;
Parameters (R input):
par1 = multiplicative ; par2 = 12 ;
R code (references can be found in the software module):
par2 <- as.numeric(par2)
x <- ts(x,freq=par2)
m <- decompose(x,type=par1)
m$figure
bitmap(file='test1.png')
plot(m)
dev.off()
mylagmax <- length(x)/2
bitmap(file='test2.png')
op <- par(mfrow = c(2,2))
acf(as.numeric(x),lag.max = mylagmax,main='Observed')
acf(as.numeric(m$trend),na.action=na.pass,lag.max = mylagmax,main='Trend')
acf(as.numeric(m$seasonal),na.action=na.pass,lag.max = mylagmax,main='Seasonal')
acf(as.numeric(m$random),na.action=na.pass,lag.max = mylagmax,main='Random')
par(op)
dev.off()
bitmap(file='test3.png')
op <- par(mfrow = c(2,2))
spectrum(as.numeric(x),main='Observed')
spectrum(as.numeric(m$trend[!is.na(m$trend)]),main='Trend')
spectrum(as.numeric(m$seasonal[!is.na(m$seasonal)]),main='Seasonal')
spectrum(as.numeric(m$random[!is.na(m$random)]),main='Random')
par(op)
dev.off()
bitmap(file='test4.png')
op <- par(mfrow = c(2,2))
cpgram(as.numeric(x),main='Observed')
cpgram(as.numeric(m$trend[!is.na(m$trend)]),main='Trend')
cpgram(as.numeric(m$seasonal[!is.na(m$seasonal)]),main='Seasonal')
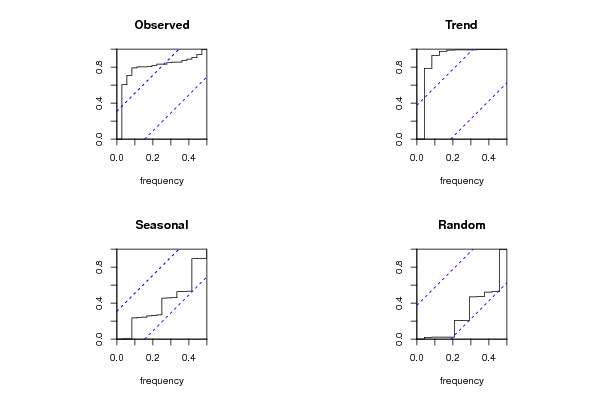
cpgram(as.numeric(m$random[!is.na(m$random)]),main='Random')
par(op)
dev.off()
load(file='createtable')
a<-table.start()
a<-table.row.start(a)
a<-table.element(a,'Classical Decomposition by Moving Averages',6,TRUE)
a<-table.row.end(a)
a<-table.row.start(a)
a<-table.element(a,'t',header=TRUE)
a<-table.element(a,'Observations',header=TRUE)
a<-table.element(a,'Fit',header=TRUE)
a<-table.element(a,'Trend',header=TRUE)
a<-table.element(a,'Seasonal',header=TRUE)
a<-table.element(a,'Random',header=TRUE)
a<-table.row.end(a)
for (i in 1:length(m$trend)) {
a<-table.row.start(a)
a<-table.element(a,i,header=TRUE)
a<-table.element(a,x[i])
if (par1 == 'additive') a<-table.element(a,m$trend[i]+m$seasonal[i]) else a<-table.element(a,m$trend[i]*m$seasonal[i])
a<-table.element(a,m$trend[i])
a<-table.element(a,m$seasonal[i])
a<-table.element(a,m$random[i])
a<-table.row.end(a)
}
a<-table.end(a)
table.save(a,file='mytable.tab')