Free Statistics

of Irreproducible Research!

Author's title

Author*Unverified author*
R Software Modulerwasp_smp.wasp
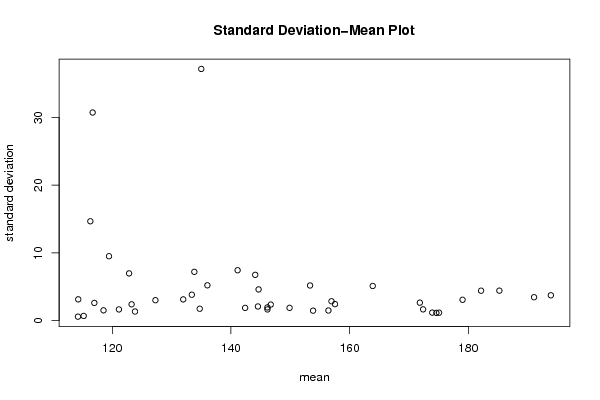
Title produced by softwareStandard Deviation-Mean Plot
Date of computationTue, 10 May 2011 20:17:55 +0000
Cite this page as followsStatistical Computations at FreeStatistics.org, Office for Research Development and Education, URL https://freestatistics.org/blog/index.php?v=date/2011/May/10/t1305058635p8ui8e4bfewlwkv.htm/, Retrieved Mon, 13 May 2024 02:40:00 +0000
Statistical Computations at FreeStatistics.org, Office for Research Development and Education, URL https://freestatistics.org/blog/index.php?pk=121459, Retrieved Mon, 13 May 2024 02:40:00 +0000
QR Codes:

Original text written by user:
IsPrivate?No (this computation is public)
User-defined keywordsKDGP2W83
Estimated Impact76
Family? (F = Feedback message, R = changed R code, M = changed R Module, P = changed Parameters, D = changed Data)
-       [Standard Deviation-Mean Plot] [opgave8oef3] [2011-05-10 20:17:55] [06ce09a0492afa6d4f67026fd1b7902e] [Current]
Feedback Forum

Post a new message
Dataseries X:
131.676
135.050
129.070
137.792
139.762
142.917
144.198
142.648
152.170
136.022
138.142
138.135
135.027
132.911
133.976
137.012
119.610
118.106
120.383
133.185
131.416
134.248
134.397
127.728
131.837
125.955
134.187
143.291
145.074
149.812
144.668
147.253
145.568
155.564
155.872
156.323
158.010
155.598
154.785
157.294
162.938
157.283
166.074
169.282
172.552
174.055
175.409
173.696
171.283
173.322
170.717
174.229
175.339
173.511
175.839
173.816
173.990
174.777
174.819
176.726
176.199
180.952
176.663
182.346
180.605
182.497
187.856
190.020
190.108
193.288
193.230
199.068
195.076
191.563
191.067
186.665
185.508
184.371
183.046
175.714
175.768
171.029
170.465
170.102
156.389
124.291
99.360
86.675
85.056
128.236
164.257
162.401
152.779
156.005
153.387
153.190
148.840
144.211
145.953
145.542
150.271
147.489
143.824
134.754
131.736
126.304
125.511
125.495
130.133
126.257
110.323
98.417
105.749
120.665
124.075
127.245
146.731
144.979
148.210
144.670
142.970
142.524
146.142
146.522
148.128
148.798
150.181
152.388
155.694
160.662
155.520
158.262
154.338
158.196
160.371
154.856
150.636
145.899
141.242
140.834
141.119
139.104
134.437
129.425
123.155
119.273
120.472
121.523
121.983
123.658
124.794
124.827
120.382
117.395
115.790
114.283
117.271
117.448
118.764
120.550
123.554
125.412
124.182
119.828
115.361
114.226
115.214
115.864
114.276
113.469
114.883
114.172
111.225
112.149
115.618
118.002
121.382
120.663
128.049


Summary of computational transaction
Raw Inputview raw input (R code)
Raw Outputview raw output of R engine
Computing time2 seconds
R Server'RServer@AstonUniversity' @ vre.aston.ac.uk

\begin{tabular}{lllllllll}
\hline
Summary of computational transaction \tabularnewline
Raw Input & view raw input (R code)  \tabularnewline
Raw Output & view raw output of R engine  \tabularnewline
Computing time & 2 seconds \tabularnewline
R Server & 'RServer@AstonUniversity' @ vre.aston.ac.uk \tabularnewline
\hline
\end{tabular}
%Source: https://freestatistics.org/blog/index.php?pk=121459&T=0

[TABLE]
[ROW][C]Summary of computational transaction[/C][/ROW]
[ROW][C]Raw Input[/C][C]view raw input (R code) [/C][/ROW]
[ROW][C]Raw Output[/C][C]view raw output of R engine [/C][/ROW]
[ROW][C]Computing time[/C][C]2 seconds[/C][/ROW]
[ROW][C]R Server[/C][C]'RServer@AstonUniversity' @ vre.aston.ac.uk[/C][/ROW]
[/TABLE]
Source: https://freestatistics.org/blog/index.php?pk=121459&T=0

Globally Unique Identifier (entire table): ba.freestatistics.org/blog/index.php?pk=121459&T=0

As an alternative you can also use a QR Code:  

The GUIDs for individual cells are displayed in the table below:

Summary of computational transaction
Raw Inputview raw input (R code)
Raw Outputview raw output of R engine
Computing time2 seconds
R Server'RServer@AstonUniversity' @ vre.aston.ac.uk


Standard Deviation-Mean Plot
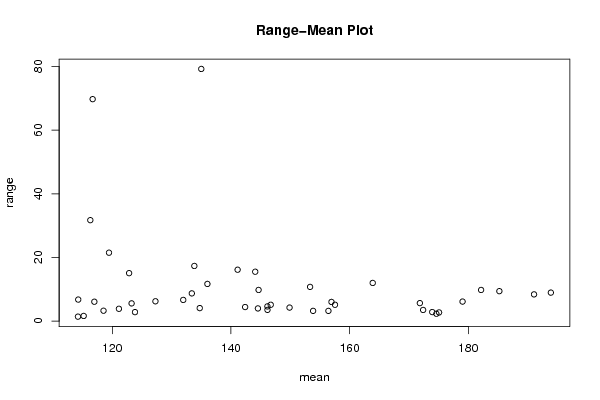
SectionMeanStandard DeviationRange
1133.3973.818079971224648.72200000000001
2142.381251.872541477066224.43600000000001
3141.117257.4357421227922316.148
4134.73151.748618597636434.101
5122.8216.9737146007944315.079
6131.947253.129378146426756.669
7133.81757.2024305851103717.336
8146.701752.363841559129265.14400000000001
9153.331755.1852097594986410.755
10156.421751.487825342572173.22499999999999
11163.894255.1121489529029611.999
12173.9281.177099542661252.857
13172.387751.660813329867833.512
14174.626251.137110775899462.328
15175.0781.162945971803222.73599999999999
16179.043.071741634100546.14699999999999
17185.24454.423386673880859.41500000000002
18193.92353.737589374628178.96
19191.092753.44930180133128.411
20182.159754.413371226549319.79400000000001
21171.8412.645636029388775.666
22116.6787530.740930482284869.714
23134.987537.179479362501479.201
24153.840251.465225210220833.226
25146.13651.949663646204994.62899999999999
26144.08456.7574525032243715.517
27127.26153.006810547185616.24099999999999
28116.282514.674453209574831.716
29119.43359.5104361449234721.496
30146.14751.647500834597673.54000000000002
31144.53952.083577292382823.99799999999999
32149.873751.881554034125344.26000000000002
33157.53452.432842165040725.142
34156.940252.855565136711136.03300000000002
35144.652754.603204925194339.802
36136.021255.2125094644198611.694
37121.105751.646626323729833.88200000000001
38123.81551.337093489625912.84399999999999
39116.96252.609885885117076.099
40118.508251.515373303842983.279
41123.2442.404525178352965.584
42115.166250.6858407857027291.63800000000001
43114.20.5794854039001621.414
44114.24853.136545073803346.777

\begin{tabular}{lllllllll}
\hline
Standard Deviation-Mean Plot \tabularnewline
Section & Mean & Standard Deviation & Range \tabularnewline
1 & 133.397 & 3.81807997122464 & 8.72200000000001 \tabularnewline
2 & 142.38125 & 1.87254147706622 & 4.43600000000001 \tabularnewline
3 & 141.11725 & 7.43574212279223 & 16.148 \tabularnewline
4 & 134.7315 & 1.74861859763643 & 4.101 \tabularnewline
5 & 122.821 & 6.97371460079443 & 15.079 \tabularnewline
6 & 131.94725 & 3.12937814642675 & 6.669 \tabularnewline
7 & 133.8175 & 7.20243058511037 & 17.336 \tabularnewline
8 & 146.70175 & 2.36384155912926 & 5.14400000000001 \tabularnewline
9 & 153.33175 & 5.18520975949864 & 10.755 \tabularnewline
10 & 156.42175 & 1.48782534257217 & 3.22499999999999 \tabularnewline
11 & 163.89425 & 5.11214895290296 & 11.999 \tabularnewline
12 & 173.928 & 1.17709954266125 & 2.857 \tabularnewline
13 & 172.38775 & 1.66081332986783 & 3.512 \tabularnewline
14 & 174.62625 & 1.13711077589946 & 2.328 \tabularnewline
15 & 175.078 & 1.16294597180322 & 2.73599999999999 \tabularnewline
16 & 179.04 & 3.07174163410054 & 6.14699999999999 \tabularnewline
17 & 185.2445 & 4.42338667388085 & 9.41500000000002 \tabularnewline
18 & 193.9235 & 3.73758937462817 & 8.96 \tabularnewline
19 & 191.09275 & 3.4493018013312 & 8.411 \tabularnewline
20 & 182.15975 & 4.41337122654931 & 9.79400000000001 \tabularnewline
21 & 171.841 & 2.64563602938877 & 5.666 \tabularnewline
22 & 116.67875 & 30.7409304822848 & 69.714 \tabularnewline
23 & 134.9875 & 37.1794793625014 & 79.201 \tabularnewline
24 & 153.84025 & 1.46522521022083 & 3.226 \tabularnewline
25 & 146.1365 & 1.94966364620499 & 4.62899999999999 \tabularnewline
26 & 144.0845 & 6.75745250322437 & 15.517 \tabularnewline
27 & 127.2615 & 3.00681054718561 & 6.24099999999999 \tabularnewline
28 & 116.2825 & 14.6744532095748 & 31.716 \tabularnewline
29 & 119.4335 & 9.51043614492347 & 21.496 \tabularnewline
30 & 146.1475 & 1.64750083459767 & 3.54000000000002 \tabularnewline
31 & 144.5395 & 2.08357729238282 & 3.99799999999999 \tabularnewline
32 & 149.87375 & 1.88155403412534 & 4.26000000000002 \tabularnewline
33 & 157.5345 & 2.43284216504072 & 5.142 \tabularnewline
34 & 156.94025 & 2.85556513671113 & 6.03300000000002 \tabularnewline
35 & 144.65275 & 4.60320492519433 & 9.802 \tabularnewline
36 & 136.02125 & 5.21250946441986 & 11.694 \tabularnewline
37 & 121.10575 & 1.64662632372983 & 3.88200000000001 \tabularnewline
38 & 123.8155 & 1.33709348962591 & 2.84399999999999 \tabularnewline
39 & 116.9625 & 2.60988588511707 & 6.099 \tabularnewline
40 & 118.50825 & 1.51537330384298 & 3.279 \tabularnewline
41 & 123.244 & 2.40452517835296 & 5.584 \tabularnewline
42 & 115.16625 & 0.685840785702729 & 1.63800000000001 \tabularnewline
43 & 114.2 & 0.579485403900162 & 1.414 \tabularnewline
44 & 114.2485 & 3.13654507380334 & 6.777 \tabularnewline
\hline
\end{tabular}
%Source: https://freestatistics.org/blog/index.php?pk=121459&T=1

[TABLE]
[ROW][C]Standard Deviation-Mean Plot[/C][/ROW]
[ROW][C]Section[/C][C]Mean[/C][C]Standard Deviation[/C][C]Range[/C][/ROW]
[ROW][C]1[/C][C]133.397[/C][C]3.81807997122464[/C][C]8.72200000000001[/C][/ROW]
[ROW][C]2[/C][C]142.38125[/C][C]1.87254147706622[/C][C]4.43600000000001[/C][/ROW]
[ROW][C]3[/C][C]141.11725[/C][C]7.43574212279223[/C][C]16.148[/C][/ROW]
[ROW][C]4[/C][C]134.7315[/C][C]1.74861859763643[/C][C]4.101[/C][/ROW]
[ROW][C]5[/C][C]122.821[/C][C]6.97371460079443[/C][C]15.079[/C][/ROW]
[ROW][C]6[/C][C]131.94725[/C][C]3.12937814642675[/C][C]6.669[/C][/ROW]
[ROW][C]7[/C][C]133.8175[/C][C]7.20243058511037[/C][C]17.336[/C][/ROW]
[ROW][C]8[/C][C]146.70175[/C][C]2.36384155912926[/C][C]5.14400000000001[/C][/ROW]
[ROW][C]9[/C][C]153.33175[/C][C]5.18520975949864[/C][C]10.755[/C][/ROW]
[ROW][C]10[/C][C]156.42175[/C][C]1.48782534257217[/C][C]3.22499999999999[/C][/ROW]
[ROW][C]11[/C][C]163.89425[/C][C]5.11214895290296[/C][C]11.999[/C][/ROW]
[ROW][C]12[/C][C]173.928[/C][C]1.17709954266125[/C][C]2.857[/C][/ROW]
[ROW][C]13[/C][C]172.38775[/C][C]1.66081332986783[/C][C]3.512[/C][/ROW]
[ROW][C]14[/C][C]174.62625[/C][C]1.13711077589946[/C][C]2.328[/C][/ROW]
[ROW][C]15[/C][C]175.078[/C][C]1.16294597180322[/C][C]2.73599999999999[/C][/ROW]
[ROW][C]16[/C][C]179.04[/C][C]3.07174163410054[/C][C]6.14699999999999[/C][/ROW]
[ROW][C]17[/C][C]185.2445[/C][C]4.42338667388085[/C][C]9.41500000000002[/C][/ROW]
[ROW][C]18[/C][C]193.9235[/C][C]3.73758937462817[/C][C]8.96[/C][/ROW]
[ROW][C]19[/C][C]191.09275[/C][C]3.4493018013312[/C][C]8.411[/C][/ROW]
[ROW][C]20[/C][C]182.15975[/C][C]4.41337122654931[/C][C]9.79400000000001[/C][/ROW]
[ROW][C]21[/C][C]171.841[/C][C]2.64563602938877[/C][C]5.666[/C][/ROW]
[ROW][C]22[/C][C]116.67875[/C][C]30.7409304822848[/C][C]69.714[/C][/ROW]
[ROW][C]23[/C][C]134.9875[/C][C]37.1794793625014[/C][C]79.201[/C][/ROW]
[ROW][C]24[/C][C]153.84025[/C][C]1.46522521022083[/C][C]3.226[/C][/ROW]
[ROW][C]25[/C][C]146.1365[/C][C]1.94966364620499[/C][C]4.62899999999999[/C][/ROW]
[ROW][C]26[/C][C]144.0845[/C][C]6.75745250322437[/C][C]15.517[/C][/ROW]
[ROW][C]27[/C][C]127.2615[/C][C]3.00681054718561[/C][C]6.24099999999999[/C][/ROW]
[ROW][C]28[/C][C]116.2825[/C][C]14.6744532095748[/C][C]31.716[/C][/ROW]
[ROW][C]29[/C][C]119.4335[/C][C]9.51043614492347[/C][C]21.496[/C][/ROW]
[ROW][C]30[/C][C]146.1475[/C][C]1.64750083459767[/C][C]3.54000000000002[/C][/ROW]
[ROW][C]31[/C][C]144.5395[/C][C]2.08357729238282[/C][C]3.99799999999999[/C][/ROW]
[ROW][C]32[/C][C]149.87375[/C][C]1.88155403412534[/C][C]4.26000000000002[/C][/ROW]
[ROW][C]33[/C][C]157.5345[/C][C]2.43284216504072[/C][C]5.142[/C][/ROW]
[ROW][C]34[/C][C]156.94025[/C][C]2.85556513671113[/C][C]6.03300000000002[/C][/ROW]
[ROW][C]35[/C][C]144.65275[/C][C]4.60320492519433[/C][C]9.802[/C][/ROW]
[ROW][C]36[/C][C]136.02125[/C][C]5.21250946441986[/C][C]11.694[/C][/ROW]
[ROW][C]37[/C][C]121.10575[/C][C]1.64662632372983[/C][C]3.88200000000001[/C][/ROW]
[ROW][C]38[/C][C]123.8155[/C][C]1.33709348962591[/C][C]2.84399999999999[/C][/ROW]
[ROW][C]39[/C][C]116.9625[/C][C]2.60988588511707[/C][C]6.099[/C][/ROW]
[ROW][C]40[/C][C]118.50825[/C][C]1.51537330384298[/C][C]3.279[/C][/ROW]
[ROW][C]41[/C][C]123.244[/C][C]2.40452517835296[/C][C]5.584[/C][/ROW]
[ROW][C]42[/C][C]115.16625[/C][C]0.685840785702729[/C][C]1.63800000000001[/C][/ROW]
[ROW][C]43[/C][C]114.2[/C][C]0.579485403900162[/C][C]1.414[/C][/ROW]
[ROW][C]44[/C][C]114.2485[/C][C]3.13654507380334[/C][C]6.777[/C][/ROW]
[/TABLE]
Source: https://freestatistics.org/blog/index.php?pk=121459&T=1

Globally Unique Identifier (entire table): ba.freestatistics.org/blog/index.php?pk=121459&T=1

As an alternative you can also use a QR Code:  

The GUIDs for individual cells are displayed in the table below:

Standard Deviation-Mean Plot
SectionMeanStandard DeviationRange
1133.3973.818079971224648.72200000000001
2142.381251.872541477066224.43600000000001
3141.117257.4357421227922316.148
4134.73151.748618597636434.101
5122.8216.9737146007944315.079
6131.947253.129378146426756.669
7133.81757.2024305851103717.336
8146.701752.363841559129265.14400000000001
9153.331755.1852097594986410.755
10156.421751.487825342572173.22499999999999
11163.894255.1121489529029611.999
12173.9281.177099542661252.857
13172.387751.660813329867833.512
14174.626251.137110775899462.328
15175.0781.162945971803222.73599999999999
16179.043.071741634100546.14699999999999
17185.24454.423386673880859.41500000000002
18193.92353.737589374628178.96
19191.092753.44930180133128.411
20182.159754.413371226549319.79400000000001
21171.8412.645636029388775.666
22116.6787530.740930482284869.714
23134.987537.179479362501479.201
24153.840251.465225210220833.226
25146.13651.949663646204994.62899999999999
26144.08456.7574525032243715.517
27127.26153.006810547185616.24099999999999
28116.282514.674453209574831.716
29119.43359.5104361449234721.496
30146.14751.647500834597673.54000000000002
31144.53952.083577292382823.99799999999999
32149.873751.881554034125344.26000000000002
33157.53452.432842165040725.142
34156.940252.855565136711136.03300000000002
35144.652754.603204925194339.802
36136.021255.2125094644198611.694
37121.105751.646626323729833.88200000000001
38123.81551.337093489625912.84399999999999
39116.96252.609885885117076.099
40118.508251.515373303842983.279
41123.2442.404525178352965.584
42115.166250.6858407857027291.63800000000001
43114.20.5794854039001621.414
44114.24853.136545073803346.777


Regression: S.E.(k) = alpha + beta * Mean(k)
alpha14.8391888043318
beta-0.0687019968936686
S.D.0.0450844947204806
T-STAT-1.52384976962954
p-value0.135041284577757

\begin{tabular}{lllllllll}
\hline
Regression: S.E.(k) = alpha + beta * Mean(k) \tabularnewline
alpha & 14.8391888043318 \tabularnewline
beta & -0.0687019968936686 \tabularnewline
S.D. & 0.0450844947204806 \tabularnewline
T-STAT & -1.52384976962954 \tabularnewline
p-value & 0.135041284577757 \tabularnewline
\hline
\end{tabular}
%Source: https://freestatistics.org/blog/index.php?pk=121459&T=2

[TABLE]
[ROW][C]Regression: S.E.(k) = alpha + beta * Mean(k)[/C][/ROW]
[ROW][C]alpha[/C][C]14.8391888043318[/C][/ROW]
[ROW][C]beta[/C][C]-0.0687019968936686[/C][/ROW]
[ROW][C]S.D.[/C][C]0.0450844947204806[/C][/ROW]
[ROW][C]T-STAT[/C][C]-1.52384976962954[/C][/ROW]
[ROW][C]p-value[/C][C]0.135041284577757[/C][/ROW]
[/TABLE]
Source: https://freestatistics.org/blog/index.php?pk=121459&T=2

Globally Unique Identifier (entire table): ba.freestatistics.org/blog/index.php?pk=121459&T=2

As an alternative you can also use a QR Code:  

The GUIDs for individual cells are displayed in the table below:

Regression: S.E.(k) = alpha + beta * Mean(k)
alpha14.8391888043318
beta-0.0687019968936686
S.D.0.0450844947204806
T-STAT-1.52384976962954
p-value0.135041284577757


Regression: ln S.E.(k) = alpha + beta * ln Mean(k)
alpha4.6091910098928
beta-0.70371884967156
S.D.0.83740200464581
T-STAT-0.840359642999908
p-value0.405465479359852
Lambda1.70371884967156

\begin{tabular}{lllllllll}
\hline
Regression: ln S.E.(k) = alpha + beta * ln Mean(k) \tabularnewline
alpha & 4.6091910098928 \tabularnewline
beta & -0.70371884967156 \tabularnewline
S.D. & 0.83740200464581 \tabularnewline
T-STAT & -0.840359642999908 \tabularnewline
p-value & 0.405465479359852 \tabularnewline
Lambda & 1.70371884967156 \tabularnewline
\hline
\end{tabular}
%Source: https://freestatistics.org/blog/index.php?pk=121459&T=3

[TABLE]
[ROW][C]Regression: ln S.E.(k) = alpha + beta * ln Mean(k)[/C][/ROW]
[ROW][C]alpha[/C][C]4.6091910098928[/C][/ROW]
[ROW][C]beta[/C][C]-0.70371884967156[/C][/ROW]
[ROW][C]S.D.[/C][C]0.83740200464581[/C][/ROW]
[ROW][C]T-STAT[/C][C]-0.840359642999908[/C][/ROW]
[ROW][C]p-value[/C][C]0.405465479359852[/C][/ROW]
[ROW][C]Lambda[/C][C]1.70371884967156[/C][/ROW]
[/TABLE]
Source: https://freestatistics.org/blog/index.php?pk=121459&T=3

Globally Unique Identifier (entire table): ba.freestatistics.org/blog/index.php?pk=121459&T=3

As an alternative you can also use a QR Code:  

The GUIDs for individual cells are displayed in the table below:

Regression: ln S.E.(k) = alpha + beta * ln Mean(k)
alpha4.6091910098928
beta-0.70371884967156
S.D.0.83740200464581
T-STAT-0.840359642999908
p-value0.405465479359852
Lambda1.70371884967156


Parameters (Session):
par1 = 4 ;
Parameters (R input):
par1 = 4 ;
R code (references can be found in the software module):
par1 <- as.numeric(par1)
(n <- length(x))
(np <- floor(n / par1))
arr <- array(NA,dim=c(par1,np))
j <- 0
k <- 1
for (i in 1:(np*par1))
{
j = j + 1
arr[j,k] <- x[i]
if (j == par1) {
j = 0
k=k+1
}
}
arr
arr.mean <- array(NA,dim=np)
arr.sd <- array(NA,dim=np)
arr.range <- array(NA,dim=np)
for (j in 1:np)
{
arr.mean[j] <- mean(arr[,j],na.rm=TRUE)
arr.sd[j] <- sd(arr[,j],na.rm=TRUE)
arr.range[j] <- max(arr[,j],na.rm=TRUE) - min(arr[,j],na.rm=TRUE)
}
arr.mean
arr.sd
arr.range
(lm1 <- lm(arr.sd~arr.mean))
(lnlm1 <- lm(log(arr.sd)~log(arr.mean)))
(lm2 <- lm(arr.range~arr.mean))
bitmap(file='test1.png')
plot(arr.mean,arr.sd,main='Standard Deviation-Mean Plot',xlab='mean',ylab='standard deviation')
dev.off()
bitmap(file='test2.png')
plot(arr.mean,arr.range,main='Range-Mean Plot',xlab='mean',ylab='range')
dev.off()
load(file='createtable')
a<-table.start()
a<-table.row.start(a)
a<-table.element(a,'Standard Deviation-Mean Plot',4,TRUE)
a<-table.row.end(a)
a<-table.row.start(a)
a<-table.element(a,'Section',header=TRUE)
a<-table.element(a,'Mean',header=TRUE)
a<-table.element(a,'Standard Deviation',header=TRUE)
a<-table.element(a,'Range',header=TRUE)
a<-table.row.end(a)
for (j in 1:np) {
a<-table.row.start(a)
a<-table.element(a,j,header=TRUE)
a<-table.element(a,arr.mean[j])
a<-table.element(a,arr.sd[j] )
a<-table.element(a,arr.range[j] )
a<-table.row.end(a)
}
a<-table.end(a)
table.save(a,file='mytable.tab')
a<-table.start()
a<-table.row.start(a)
a<-table.element(a,'Regression: S.E.(k) = alpha + beta * Mean(k)',2,TRUE)
a<-table.row.end(a)
a<-table.row.start(a)
a<-table.element(a,'alpha',header=TRUE)
a<-table.element(a,lm1$coefficients[[1]])
a<-table.row.end(a)
a<-table.row.start(a)
a<-table.element(a,'beta',header=TRUE)
a<-table.element(a,lm1$coefficients[[2]])
a<-table.row.end(a)
a<-table.row.start(a)
a<-table.element(a,'S.D.',header=TRUE)
a<-table.element(a,summary(lm1)$coefficients[2,2])
a<-table.row.end(a)
a<-table.row.start(a)
a<-table.element(a,'T-STAT',header=TRUE)
a<-table.element(a,summary(lm1)$coefficients[2,3])
a<-table.row.end(a)
a<-table.row.start(a)
a<-table.element(a,'p-value',header=TRUE)
a<-table.element(a,summary(lm1)$coefficients[2,4])
a<-table.row.end(a)
a<-table.end(a)
table.save(a,file='mytable1.tab')
a<-table.start()
a<-table.row.start(a)
a<-table.element(a,'Regression: ln S.E.(k) = alpha + beta * ln Mean(k)',2,TRUE)
a<-table.row.end(a)
a<-table.row.start(a)
a<-table.element(a,'alpha',header=TRUE)
a<-table.element(a,lnlm1$coefficients[[1]])
a<-table.row.end(a)
a<-table.row.start(a)
a<-table.element(a,'beta',header=TRUE)
a<-table.element(a,lnlm1$coefficients[[2]])
a<-table.row.end(a)
a<-table.row.start(a)
a<-table.element(a,'S.D.',header=TRUE)
a<-table.element(a,summary(lnlm1)$coefficients[2,2])
a<-table.row.end(a)
a<-table.row.start(a)
a<-table.element(a,'T-STAT',header=TRUE)
a<-table.element(a,summary(lnlm1)$coefficients[2,3])
a<-table.row.end(a)
a<-table.row.start(a)
a<-table.element(a,'p-value',header=TRUE)
a<-table.element(a,summary(lnlm1)$coefficients[2,4])
a<-table.row.end(a)
a<-table.row.start(a)
a<-table.element(a,'Lambda',header=TRUE)
a<-table.element(a,1-lnlm1$coefficients[[2]])
a<-table.row.end(a)
a<-table.end(a)
table.save(a,file='mytable2.tab')