Free Statistics

of Irreproducible Research!

Author's title

Author*Unverified author*
R Software Modulerwasp_smp.wasp
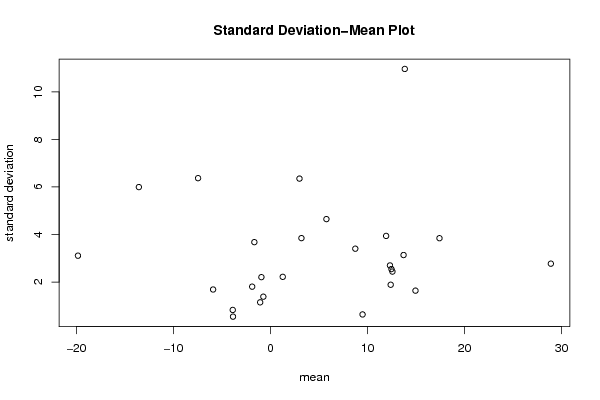
Title produced by softwareStandard Deviation-Mean Plot
Date of computationTue, 10 May 2011 16:37:22 +0000
Cite this page as followsStatistical Computations at FreeStatistics.org, Office for Research Development and Education, URL https://freestatistics.org/blog/index.php?v=date/2011/May/10/t1305045271o7pkzwyxep3epzq.htm/, Retrieved Sun, 12 May 2024 15:09:09 +0000
Statistical Computations at FreeStatistics.org, Office for Research Development and Education, URL https://freestatistics.org/blog/index.php?pk=121420, Retrieved Sun, 12 May 2024 15:09:09 +0000
QR Codes:

Original text written by user:
IsPrivate?No (this computation is public)
User-defined keywordsKDGP2W83
Estimated Impact82
Family? (F = Feedback message, R = changed R code, M = changed R Module, P = changed Parameters, D = changed Data)
-       [Standard Deviation-Mean Plot] [standard deviatio...] [2011-05-10 16:37:22] [93a9440e82e53db41c1ce1bc7dd7ea5d] [Current]
Feedback Forum

Post a new message
Dataseries X:
17.1
13.4
15.3
14
9.7
13.7
13.7
12.5
9.8
7
-1.9
-2.9
-6.8
-10.4
-17.2
-19.8
-16.8
-23.2
-21.7
-17.6
-13
-12.6
-4
-0.2
3.1
6.5
19.2
26.6
26.6
31.4
31.2
26.4
20.7
20.7
15
13.3
8.7
10.2
4.3
-0.1
-4.6
-3.9
-3.5
-3.4
-2.5
-1.1
0.3
-0.9
3.6
2.7
-0.2
-1
5.8
6.4
9.6
13.2
10.6
10.9
12.9
15.9
12.2
9.1
9
17.4
14.7
17
13.7
9.5
14.8
13.6
12.6
8.9
10.2
12.7
16
10.4
9.9
9.5
8.6
10
3.5
-4.2
-4.4
-1.5
-0.1
0.8
-2.4
-1.2
0.2
-1.9
-1.6
-4.2
-2.2
6.2
5.7
3.1
1.1
-0.9
0.1
-4
-4
-5.3
-8
-6.3
-3.6
-3.5
-5.1
-3.3


Summary of computational transaction
Raw Inputview raw input (R code)
Raw Outputview raw output of R engine
Computing time1 seconds
R Server'Herman Ole Andreas Wold' @ www.yougetit.org

\begin{tabular}{lllllllll}
\hline
Summary of computational transaction \tabularnewline
Raw Input & view raw input (R code)  \tabularnewline
Raw Output & view raw output of R engine  \tabularnewline
Computing time & 1 seconds \tabularnewline
R Server & 'Herman Ole Andreas Wold' @ www.yougetit.org \tabularnewline
\hline
\end{tabular}
%Source: https://freestatistics.org/blog/index.php?pk=121420&T=0

[TABLE]
[ROW][C]Summary of computational transaction[/C][/ROW]
[ROW][C]Raw Input[/C][C]view raw input (R code) [/C][/ROW]
[ROW][C]Raw Output[/C][C]view raw output of R engine [/C][/ROW]
[ROW][C]Computing time[/C][C]1 seconds[/C][/ROW]
[ROW][C]R Server[/C][C]'Herman Ole Andreas Wold' @ www.yougetit.org[/C][/ROW]
[/TABLE]
Source: https://freestatistics.org/blog/index.php?pk=121420&T=0

Globally Unique Identifier (entire table): ba.freestatistics.org/blog/index.php?pk=121420&T=0

As an alternative you can also use a QR Code:  

The GUIDs for individual cells are displayed in the table below:

Summary of computational transaction
Raw Inputview raw input (R code)
Raw Outputview raw output of R engine
Computing time1 seconds
R Server'Herman Ole Andreas Wold' @ www.yougetit.org


Standard Deviation-Mean Plot
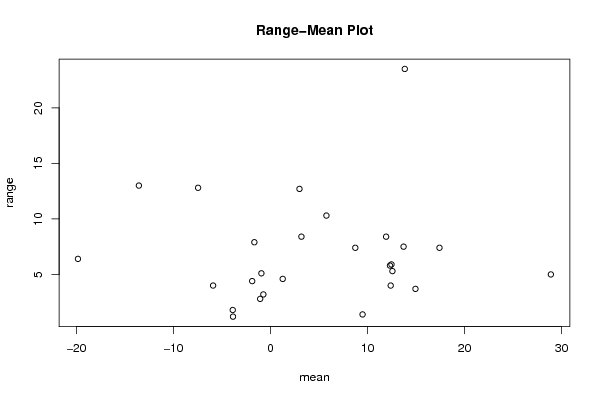
SectionMeanStandard DeviationRange
114.951.638088316707423.7
212.41.886796226411324
336.352427357580212.7
4-13.555.9963878015574213
5-19.8253.109528367239426.4
6-7.456.3715513547853212.8
713.8510.966160069352723.5
828.92.773685875028635
917.4253.844801685392897.4
105.7754.6485660871570610.3
11-3.850.5446711546122731.2
12-1.051.14746096520392.8
131.2752.220172665957914.6
148.753.403429642777027.4
1512.5752.440457607362475.3
1611.9253.940706366461058.4
1713.7253.13727588841027.5
1812.4752.547384279347485.9
1912.3252.699845674601915.8
209.50.6377042156569671.4
21-1.653.679220932027147.9
22-0.7251.384136313132973.2
23-1.8751.806239186818844.4
243.23.847943173523578.4
25-0.9252.206618831304285.1
26-5.91.687206764645844
27-3.8750.8261355820929151.8

\begin{tabular}{lllllllll}
\hline
Standard Deviation-Mean Plot \tabularnewline
Section & Mean & Standard Deviation & Range \tabularnewline
1 & 14.95 & 1.63808831670742 & 3.7 \tabularnewline
2 & 12.4 & 1.88679622641132 & 4 \tabularnewline
3 & 3 & 6.3524273575802 & 12.7 \tabularnewline
4 & -13.55 & 5.99638780155742 & 13 \tabularnewline
5 & -19.825 & 3.10952836723942 & 6.4 \tabularnewline
6 & -7.45 & 6.37155135478532 & 12.8 \tabularnewline
7 & 13.85 & 10.9661600693527 & 23.5 \tabularnewline
8 & 28.9 & 2.77368587502863 & 5 \tabularnewline
9 & 17.425 & 3.84480168539289 & 7.4 \tabularnewline
10 & 5.775 & 4.64856608715706 & 10.3 \tabularnewline
11 & -3.85 & 0.544671154612273 & 1.2 \tabularnewline
12 & -1.05 & 1.1474609652039 & 2.8 \tabularnewline
13 & 1.275 & 2.22017266595791 & 4.6 \tabularnewline
14 & 8.75 & 3.40342964277702 & 7.4 \tabularnewline
15 & 12.575 & 2.44045760736247 & 5.3 \tabularnewline
16 & 11.925 & 3.94070636646105 & 8.4 \tabularnewline
17 & 13.725 & 3.1372758884102 & 7.5 \tabularnewline
18 & 12.475 & 2.54738427934748 & 5.9 \tabularnewline
19 & 12.325 & 2.69984567460191 & 5.8 \tabularnewline
20 & 9.5 & 0.637704215656967 & 1.4 \tabularnewline
21 & -1.65 & 3.67922093202714 & 7.9 \tabularnewline
22 & -0.725 & 1.38413631313297 & 3.2 \tabularnewline
23 & -1.875 & 1.80623918681884 & 4.4 \tabularnewline
24 & 3.2 & 3.84794317352357 & 8.4 \tabularnewline
25 & -0.925 & 2.20661883130428 & 5.1 \tabularnewline
26 & -5.9 & 1.68720676464584 & 4 \tabularnewline
27 & -3.875 & 0.826135582092915 & 1.8 \tabularnewline
\hline
\end{tabular}
%Source: https://freestatistics.org/blog/index.php?pk=121420&T=1

[TABLE]
[ROW][C]Standard Deviation-Mean Plot[/C][/ROW]
[ROW][C]Section[/C][C]Mean[/C][C]Standard Deviation[/C][C]Range[/C][/ROW]
[ROW][C]1[/C][C]14.95[/C][C]1.63808831670742[/C][C]3.7[/C][/ROW]
[ROW][C]2[/C][C]12.4[/C][C]1.88679622641132[/C][C]4[/C][/ROW]
[ROW][C]3[/C][C]3[/C][C]6.3524273575802[/C][C]12.7[/C][/ROW]
[ROW][C]4[/C][C]-13.55[/C][C]5.99638780155742[/C][C]13[/C][/ROW]
[ROW][C]5[/C][C]-19.825[/C][C]3.10952836723942[/C][C]6.4[/C][/ROW]
[ROW][C]6[/C][C]-7.45[/C][C]6.37155135478532[/C][C]12.8[/C][/ROW]
[ROW][C]7[/C][C]13.85[/C][C]10.9661600693527[/C][C]23.5[/C][/ROW]
[ROW][C]8[/C][C]28.9[/C][C]2.77368587502863[/C][C]5[/C][/ROW]
[ROW][C]9[/C][C]17.425[/C][C]3.84480168539289[/C][C]7.4[/C][/ROW]
[ROW][C]10[/C][C]5.775[/C][C]4.64856608715706[/C][C]10.3[/C][/ROW]
[ROW][C]11[/C][C]-3.85[/C][C]0.544671154612273[/C][C]1.2[/C][/ROW]
[ROW][C]12[/C][C]-1.05[/C][C]1.1474609652039[/C][C]2.8[/C][/ROW]
[ROW][C]13[/C][C]1.275[/C][C]2.22017266595791[/C][C]4.6[/C][/ROW]
[ROW][C]14[/C][C]8.75[/C][C]3.40342964277702[/C][C]7.4[/C][/ROW]
[ROW][C]15[/C][C]12.575[/C][C]2.44045760736247[/C][C]5.3[/C][/ROW]
[ROW][C]16[/C][C]11.925[/C][C]3.94070636646105[/C][C]8.4[/C][/ROW]
[ROW][C]17[/C][C]13.725[/C][C]3.1372758884102[/C][C]7.5[/C][/ROW]
[ROW][C]18[/C][C]12.475[/C][C]2.54738427934748[/C][C]5.9[/C][/ROW]
[ROW][C]19[/C][C]12.325[/C][C]2.69984567460191[/C][C]5.8[/C][/ROW]
[ROW][C]20[/C][C]9.5[/C][C]0.637704215656967[/C][C]1.4[/C][/ROW]
[ROW][C]21[/C][C]-1.65[/C][C]3.67922093202714[/C][C]7.9[/C][/ROW]
[ROW][C]22[/C][C]-0.725[/C][C]1.38413631313297[/C][C]3.2[/C][/ROW]
[ROW][C]23[/C][C]-1.875[/C][C]1.80623918681884[/C][C]4.4[/C][/ROW]
[ROW][C]24[/C][C]3.2[/C][C]3.84794317352357[/C][C]8.4[/C][/ROW]
[ROW][C]25[/C][C]-0.925[/C][C]2.20661883130428[/C][C]5.1[/C][/ROW]
[ROW][C]26[/C][C]-5.9[/C][C]1.68720676464584[/C][C]4[/C][/ROW]
[ROW][C]27[/C][C]-3.875[/C][C]0.826135582092915[/C][C]1.8[/C][/ROW]
[/TABLE]
Source: https://freestatistics.org/blog/index.php?pk=121420&T=1

Globally Unique Identifier (entire table): ba.freestatistics.org/blog/index.php?pk=121420&T=1

As an alternative you can also use a QR Code:  

The GUIDs for individual cells are displayed in the table below:

Standard Deviation-Mean Plot
SectionMeanStandard DeviationRange
114.951.638088316707423.7
212.41.886796226411324
336.352427357580212.7
4-13.555.9963878015574213
5-19.8253.109528367239426.4
6-7.456.3715513547853212.8
713.8510.966160069352723.5
828.92.773685875028635
917.4253.844801685392897.4
105.7754.6485660871570610.3
11-3.850.5446711546122731.2
12-1.051.14746096520392.8
131.2752.220172665957914.6
148.753.403429642777027.4
1512.5752.440457607362475.3
1611.9253.940706366461058.4
1713.7253.13727588841027.5
1812.4752.547384279347485.9
1912.3252.699845674601915.8
209.50.6377042156569671.4
21-1.653.679220932027147.9
22-0.7251.384136313132973.2
23-1.8751.806239186818844.4
243.23.847943173523578.4
25-0.9252.206618831304285.1
26-5.91.687206764645844
27-3.8750.8261355820929151.8


Regression: S.E.(k) = alpha + beta * Mean(k)
alpha3.13704755941345
beta0.00860406410699007
S.D.0.0424877546717445
T-STAT0.202506914603138
p-value0.841159467920293

\begin{tabular}{lllllllll}
\hline
Regression: S.E.(k) = alpha + beta * Mean(k) \tabularnewline
alpha & 3.13704755941345 \tabularnewline
beta & 0.00860406410699007 \tabularnewline
S.D. & 0.0424877546717445 \tabularnewline
T-STAT & 0.202506914603138 \tabularnewline
p-value & 0.841159467920293 \tabularnewline
\hline
\end{tabular}
%Source: https://freestatistics.org/blog/index.php?pk=121420&T=2

[TABLE]
[ROW][C]Regression: S.E.(k) = alpha + beta * Mean(k)[/C][/ROW]
[ROW][C]alpha[/C][C]3.13704755941345[/C][/ROW]
[ROW][C]beta[/C][C]0.00860406410699007[/C][/ROW]
[ROW][C]S.D.[/C][C]0.0424877546717445[/C][/ROW]
[ROW][C]T-STAT[/C][C]0.202506914603138[/C][/ROW]
[ROW][C]p-value[/C][C]0.841159467920293[/C][/ROW]
[/TABLE]
Source: https://freestatistics.org/blog/index.php?pk=121420&T=2

Globally Unique Identifier (entire table): ba.freestatistics.org/blog/index.php?pk=121420&T=2

As an alternative you can also use a QR Code:  

The GUIDs for individual cells are displayed in the table below:

Regression: S.E.(k) = alpha + beta * Mean(k)
alpha3.13704755941345
beta0.00860406410699007
S.D.0.0424877546717445
T-STAT0.202506914603138
p-value0.841159467920293


Regression: ln S.E.(k) = alpha + beta * ln Mean(k)
alpha1.25396092511956
beta-0.0715120252052902
S.D.0.211350769269943
T-STAT-0.33835706135497
p-value0.740114845299968
Lambda1.07151202520529

\begin{tabular}{lllllllll}
\hline
Regression: ln S.E.(k) = alpha + beta * ln Mean(k) \tabularnewline
alpha & 1.25396092511956 \tabularnewline
beta & -0.0715120252052902 \tabularnewline
S.D. & 0.211350769269943 \tabularnewline
T-STAT & -0.33835706135497 \tabularnewline
p-value & 0.740114845299968 \tabularnewline
Lambda & 1.07151202520529 \tabularnewline
\hline
\end{tabular}
%Source: https://freestatistics.org/blog/index.php?pk=121420&T=3

[TABLE]
[ROW][C]Regression: ln S.E.(k) = alpha + beta * ln Mean(k)[/C][/ROW]
[ROW][C]alpha[/C][C]1.25396092511956[/C][/ROW]
[ROW][C]beta[/C][C]-0.0715120252052902[/C][/ROW]
[ROW][C]S.D.[/C][C]0.211350769269943[/C][/ROW]
[ROW][C]T-STAT[/C][C]-0.33835706135497[/C][/ROW]
[ROW][C]p-value[/C][C]0.740114845299968[/C][/ROW]
[ROW][C]Lambda[/C][C]1.07151202520529[/C][/ROW]
[/TABLE]
Source: https://freestatistics.org/blog/index.php?pk=121420&T=3

Globally Unique Identifier (entire table): ba.freestatistics.org/blog/index.php?pk=121420&T=3

As an alternative you can also use a QR Code:  

The GUIDs for individual cells are displayed in the table below:

Regression: ln S.E.(k) = alpha + beta * ln Mean(k)
alpha1.25396092511956
beta-0.0715120252052902
S.D.0.211350769269943
T-STAT-0.33835706135497
p-value0.740114845299968
Lambda1.07151202520529


Parameters (Session):
par1 = 4 ;
Parameters (R input):
par1 = 4 ;
R code (references can be found in the software module):
par1 <- as.numeric(par1)
(n <- length(x))
(np <- floor(n / par1))
arr <- array(NA,dim=c(par1,np))
j <- 0
k <- 1
for (i in 1:(np*par1))
{
j = j + 1
arr[j,k] <- x[i]
if (j == par1) {
j = 0
k=k+1
}
}
arr
arr.mean <- array(NA,dim=np)
arr.sd <- array(NA,dim=np)
arr.range <- array(NA,dim=np)
for (j in 1:np)
{
arr.mean[j] <- mean(arr[,j],na.rm=TRUE)
arr.sd[j] <- sd(arr[,j],na.rm=TRUE)
arr.range[j] <- max(arr[,j],na.rm=TRUE) - min(arr[,j],na.rm=TRUE)
}
arr.mean
arr.sd
arr.range
(lm1 <- lm(arr.sd~arr.mean))
(lnlm1 <- lm(log(arr.sd)~log(arr.mean)))
(lm2 <- lm(arr.range~arr.mean))
bitmap(file='test1.png')
plot(arr.mean,arr.sd,main='Standard Deviation-Mean Plot',xlab='mean',ylab='standard deviation')
dev.off()
bitmap(file='test2.png')
plot(arr.mean,arr.range,main='Range-Mean Plot',xlab='mean',ylab='range')
dev.off()
load(file='createtable')
a<-table.start()
a<-table.row.start(a)
a<-table.element(a,'Standard Deviation-Mean Plot',4,TRUE)
a<-table.row.end(a)
a<-table.row.start(a)
a<-table.element(a,'Section',header=TRUE)
a<-table.element(a,'Mean',header=TRUE)
a<-table.element(a,'Standard Deviation',header=TRUE)
a<-table.element(a,'Range',header=TRUE)
a<-table.row.end(a)
for (j in 1:np) {
a<-table.row.start(a)
a<-table.element(a,j,header=TRUE)
a<-table.element(a,arr.mean[j])
a<-table.element(a,arr.sd[j] )
a<-table.element(a,arr.range[j] )
a<-table.row.end(a)
}
a<-table.end(a)
table.save(a,file='mytable.tab')
a<-table.start()
a<-table.row.start(a)
a<-table.element(a,'Regression: S.E.(k) = alpha + beta * Mean(k)',2,TRUE)
a<-table.row.end(a)
a<-table.row.start(a)
a<-table.element(a,'alpha',header=TRUE)
a<-table.element(a,lm1$coefficients[[1]])
a<-table.row.end(a)
a<-table.row.start(a)
a<-table.element(a,'beta',header=TRUE)
a<-table.element(a,lm1$coefficients[[2]])
a<-table.row.end(a)
a<-table.row.start(a)
a<-table.element(a,'S.D.',header=TRUE)
a<-table.element(a,summary(lm1)$coefficients[2,2])
a<-table.row.end(a)
a<-table.row.start(a)
a<-table.element(a,'T-STAT',header=TRUE)
a<-table.element(a,summary(lm1)$coefficients[2,3])
a<-table.row.end(a)
a<-table.row.start(a)
a<-table.element(a,'p-value',header=TRUE)
a<-table.element(a,summary(lm1)$coefficients[2,4])
a<-table.row.end(a)
a<-table.end(a)
table.save(a,file='mytable1.tab')
a<-table.start()
a<-table.row.start(a)
a<-table.element(a,'Regression: ln S.E.(k) = alpha + beta * ln Mean(k)',2,TRUE)
a<-table.row.end(a)
a<-table.row.start(a)
a<-table.element(a,'alpha',header=TRUE)
a<-table.element(a,lnlm1$coefficients[[1]])
a<-table.row.end(a)
a<-table.row.start(a)
a<-table.element(a,'beta',header=TRUE)
a<-table.element(a,lnlm1$coefficients[[2]])
a<-table.row.end(a)
a<-table.row.start(a)
a<-table.element(a,'S.D.',header=TRUE)
a<-table.element(a,summary(lnlm1)$coefficients[2,2])
a<-table.row.end(a)
a<-table.row.start(a)
a<-table.element(a,'T-STAT',header=TRUE)
a<-table.element(a,summary(lnlm1)$coefficients[2,3])
a<-table.row.end(a)
a<-table.row.start(a)
a<-table.element(a,'p-value',header=TRUE)
a<-table.element(a,summary(lnlm1)$coefficients[2,4])
a<-table.row.end(a)
a<-table.row.start(a)
a<-table.element(a,'Lambda',header=TRUE)
a<-table.element(a,1-lnlm1$coefficients[[2]])
a<-table.row.end(a)
a<-table.end(a)
table.save(a,file='mytable2.tab')