Free Statistics

of Irreproducible Research!

Author's title

Author*Unverified author*
R Software Modulerwasp_smp.wasp
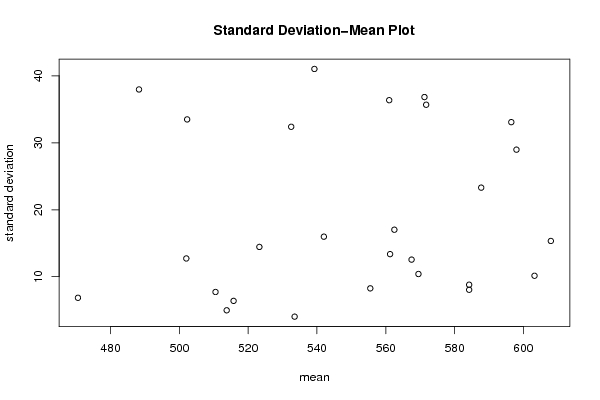
Title produced by softwareStandard Deviation-Mean Plot
Date of computationTue, 10 May 2011 14:06:22 +0000
Cite this page as followsStatistical Computations at FreeStatistics.org, Office for Research Development and Education, URL https://freestatistics.org/blog/index.php?v=date/2011/May/10/t1305036255rs7chir29n2p7gl.htm/, Retrieved Mon, 13 May 2024 13:18:12 +0000
Statistical Computations at FreeStatistics.org, Office for Research Development and Education, URL https://freestatistics.org/blog/index.php?pk=121402, Retrieved Mon, 13 May 2024 13:18:12 +0000
QR Codes:

Original text written by user:
IsPrivate?No (this computation is public)
User-defined keywordsKDGP2W83
Estimated Impact117
Family? (F = Feedback message, R = changed R code, M = changed R Module, P = changed Parameters, D = changed Data)
-       [Standard Deviation-Mean Plot] [Standaarddeviatie...] [2011-05-10 14:06:22] [aa971e749556000e4c6ae2b60b566045] [Current]
Feedback Forum

Post a new message
Dataseries X:
476
475
470
461
455
456
517
525
523
519
509
512
519
517
510
509
501
507
569
580
578
565
547
555
562
561
555
544
537
543
594
611
613
611
594
595
591
589
584
573
567
569
621
629
628
612
595
597
593
590
580
574
573
573
620
626
620
588
566
577
561
549
532
526
511
499
555
565
542
527
510
514
517
508
493
490
469
478
528
534
518
506
502
516
528
533
536
537
524
536
587
597
581
564
558
575
580
575
563
552
537
545
601
604
586
564
549
551
556


Summary of computational transaction
Raw Inputview raw input (R code)
Raw Outputview raw output of R engine
Computing time2 seconds
R Server'Gwilym Jenkins' @ www.wessa.org

\begin{tabular}{lllllllll}
\hline
Summary of computational transaction \tabularnewline
Raw Input & view raw input (R code)  \tabularnewline
Raw Output & view raw output of R engine  \tabularnewline
Computing time & 2 seconds \tabularnewline
R Server & 'Gwilym Jenkins' @ www.wessa.org \tabularnewline
\hline
\end{tabular}
%Source: https://freestatistics.org/blog/index.php?pk=121402&T=0

[TABLE]
[ROW][C]Summary of computational transaction[/C][/ROW]
[ROW][C]Raw Input[/C][C]view raw input (R code) [/C][/ROW]
[ROW][C]Raw Output[/C][C]view raw output of R engine [/C][/ROW]
[ROW][C]Computing time[/C][C]2 seconds[/C][/ROW]
[ROW][C]R Server[/C][C]'Gwilym Jenkins' @ www.wessa.org[/C][/ROW]
[/TABLE]
Source: https://freestatistics.org/blog/index.php?pk=121402&T=0

Globally Unique Identifier (entire table): ba.freestatistics.org/blog/index.php?pk=121402&T=0

As an alternative you can also use a QR Code:  

The GUIDs for individual cells are displayed in the table below:

Summary of computational transaction
Raw Inputview raw input (R code)
Raw Outputview raw output of R engine
Computing time2 seconds
R Server'Gwilym Jenkins' @ www.wessa.org


Standard Deviation-Mean Plot
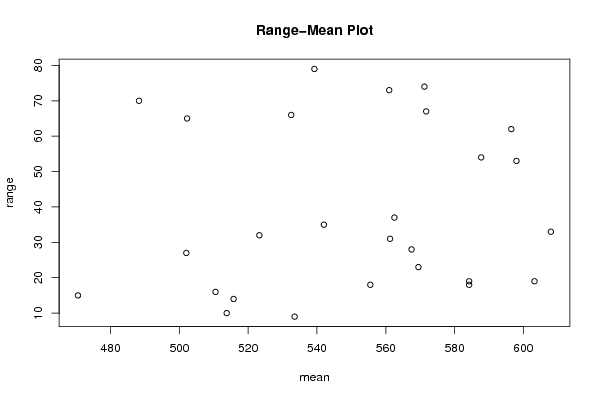
SectionMeanStandard DeviationRange
1470.56.8556546004010415
2488.2537.959408144314770
3515.756.3966136874651614
4513.754.9916597106239810
5539.2541.023367324814679
6561.2513.375973484822231
7555.58.266397845091518
8571.2536.827299656640674
9603.2510.144785195688819
10584.258.0570879768478818
11596.533.080709383768362
1260815.340577998671833
13584.258.8081401744825419
1459828.971250116854453
15587.7523.300572239038854
1654215.979153085609235
17532.532.388269481403366
18523.2514.453949863849232
1950212.727922061357927
20502.2533.490048273081665
21510.57.7244201508376416
22533.54.041451884327389
2356136.359317925395773
24569.510.408329997330723
25567.512.556538801224928
26571.7535.677957714346167
27562.517.01959654829337

\begin{tabular}{lllllllll}
\hline
Standard Deviation-Mean Plot \tabularnewline
Section & Mean & Standard Deviation & Range \tabularnewline
1 & 470.5 & 6.85565460040104 & 15 \tabularnewline
2 & 488.25 & 37.9594081443147 & 70 \tabularnewline
3 & 515.75 & 6.39661368746516 & 14 \tabularnewline
4 & 513.75 & 4.99165971062398 & 10 \tabularnewline
5 & 539.25 & 41.0233673248146 & 79 \tabularnewline
6 & 561.25 & 13.3759734848222 & 31 \tabularnewline
7 & 555.5 & 8.2663978450915 & 18 \tabularnewline
8 & 571.25 & 36.8272996566406 & 74 \tabularnewline
9 & 603.25 & 10.1447851956888 & 19 \tabularnewline
10 & 584.25 & 8.05708797684788 & 18 \tabularnewline
11 & 596.5 & 33.0807093837683 & 62 \tabularnewline
12 & 608 & 15.3405779986718 & 33 \tabularnewline
13 & 584.25 & 8.80814017448254 & 19 \tabularnewline
14 & 598 & 28.9712501168544 & 53 \tabularnewline
15 & 587.75 & 23.3005722390388 & 54 \tabularnewline
16 & 542 & 15.9791530856092 & 35 \tabularnewline
17 & 532.5 & 32.3882694814033 & 66 \tabularnewline
18 & 523.25 & 14.4539498638492 & 32 \tabularnewline
19 & 502 & 12.7279220613579 & 27 \tabularnewline
20 & 502.25 & 33.4900482730816 & 65 \tabularnewline
21 & 510.5 & 7.72442015083764 & 16 \tabularnewline
22 & 533.5 & 4.04145188432738 & 9 \tabularnewline
23 & 561 & 36.3593179253957 & 73 \tabularnewline
24 & 569.5 & 10.4083299973307 & 23 \tabularnewline
25 & 567.5 & 12.5565388012249 & 28 \tabularnewline
26 & 571.75 & 35.6779577143461 & 67 \tabularnewline
27 & 562.5 & 17.019596548293 & 37 \tabularnewline
\hline
\end{tabular}
%Source: https://freestatistics.org/blog/index.php?pk=121402&T=1

[TABLE]
[ROW][C]Standard Deviation-Mean Plot[/C][/ROW]
[ROW][C]Section[/C][C]Mean[/C][C]Standard Deviation[/C][C]Range[/C][/ROW]
[ROW][C]1[/C][C]470.5[/C][C]6.85565460040104[/C][C]15[/C][/ROW]
[ROW][C]2[/C][C]488.25[/C][C]37.9594081443147[/C][C]70[/C][/ROW]
[ROW][C]3[/C][C]515.75[/C][C]6.39661368746516[/C][C]14[/C][/ROW]
[ROW][C]4[/C][C]513.75[/C][C]4.99165971062398[/C][C]10[/C][/ROW]
[ROW][C]5[/C][C]539.25[/C][C]41.0233673248146[/C][C]79[/C][/ROW]
[ROW][C]6[/C][C]561.25[/C][C]13.3759734848222[/C][C]31[/C][/ROW]
[ROW][C]7[/C][C]555.5[/C][C]8.2663978450915[/C][C]18[/C][/ROW]
[ROW][C]8[/C][C]571.25[/C][C]36.8272996566406[/C][C]74[/C][/ROW]
[ROW][C]9[/C][C]603.25[/C][C]10.1447851956888[/C][C]19[/C][/ROW]
[ROW][C]10[/C][C]584.25[/C][C]8.05708797684788[/C][C]18[/C][/ROW]
[ROW][C]11[/C][C]596.5[/C][C]33.0807093837683[/C][C]62[/C][/ROW]
[ROW][C]12[/C][C]608[/C][C]15.3405779986718[/C][C]33[/C][/ROW]
[ROW][C]13[/C][C]584.25[/C][C]8.80814017448254[/C][C]19[/C][/ROW]
[ROW][C]14[/C][C]598[/C][C]28.9712501168544[/C][C]53[/C][/ROW]
[ROW][C]15[/C][C]587.75[/C][C]23.3005722390388[/C][C]54[/C][/ROW]
[ROW][C]16[/C][C]542[/C][C]15.9791530856092[/C][C]35[/C][/ROW]
[ROW][C]17[/C][C]532.5[/C][C]32.3882694814033[/C][C]66[/C][/ROW]
[ROW][C]18[/C][C]523.25[/C][C]14.4539498638492[/C][C]32[/C][/ROW]
[ROW][C]19[/C][C]502[/C][C]12.7279220613579[/C][C]27[/C][/ROW]
[ROW][C]20[/C][C]502.25[/C][C]33.4900482730816[/C][C]65[/C][/ROW]
[ROW][C]21[/C][C]510.5[/C][C]7.72442015083764[/C][C]16[/C][/ROW]
[ROW][C]22[/C][C]533.5[/C][C]4.04145188432738[/C][C]9[/C][/ROW]
[ROW][C]23[/C][C]561[/C][C]36.3593179253957[/C][C]73[/C][/ROW]
[ROW][C]24[/C][C]569.5[/C][C]10.4083299973307[/C][C]23[/C][/ROW]
[ROW][C]25[/C][C]567.5[/C][C]12.5565388012249[/C][C]28[/C][/ROW]
[ROW][C]26[/C][C]571.75[/C][C]35.6779577143461[/C][C]67[/C][/ROW]
[ROW][C]27[/C][C]562.5[/C][C]17.019596548293[/C][C]37[/C][/ROW]
[/TABLE]
Source: https://freestatistics.org/blog/index.php?pk=121402&T=1

Globally Unique Identifier (entire table): ba.freestatistics.org/blog/index.php?pk=121402&T=1

As an alternative you can also use a QR Code:  

The GUIDs for individual cells are displayed in the table below:

Standard Deviation-Mean Plot
SectionMeanStandard DeviationRange
1470.56.8556546004010415
2488.2537.959408144314770
3515.756.3966136874651614
4513.754.9916597106239810
5539.2541.023367324814679
6561.2513.375973484822231
7555.58.266397845091518
8571.2536.827299656640674
9603.2510.144785195688819
10584.258.0570879768478818
11596.533.080709383768362
1260815.340577998671833
13584.258.8081401744825419
1459828.971250116854453
15587.7523.300572239038854
1654215.979153085609235
17532.532.388269481403366
18523.2514.453949863849232
1950212.727922061357927
20502.2533.490048273081665
21510.57.7244201508376416
22533.54.041451884327389
2356136.359317925395773
24569.510.408329997330723
25567.512.556538801224928
26571.7535.677957714346167
27562.517.01959654829337


Regression: S.E.(k) = alpha + beta * Mean(k)
alpha2.59424335376658
beta0.0300342885936344
S.D.0.065328677394248
T-STAT0.459741262055289
p-value0.64967513230144

\begin{tabular}{lllllllll}
\hline
Regression: S.E.(k) = alpha + beta * Mean(k) \tabularnewline
alpha & 2.59424335376658 \tabularnewline
beta & 0.0300342885936344 \tabularnewline
S.D. & 0.065328677394248 \tabularnewline
T-STAT & 0.459741262055289 \tabularnewline
p-value & 0.64967513230144 \tabularnewline
\hline
\end{tabular}
%Source: https://freestatistics.org/blog/index.php?pk=121402&T=2

[TABLE]
[ROW][C]Regression: S.E.(k) = alpha + beta * Mean(k)[/C][/ROW]
[ROW][C]alpha[/C][C]2.59424335376658[/C][/ROW]
[ROW][C]beta[/C][C]0.0300342885936344[/C][/ROW]
[ROW][C]S.D.[/C][C]0.065328677394248[/C][/ROW]
[ROW][C]T-STAT[/C][C]0.459741262055289[/C][/ROW]
[ROW][C]p-value[/C][C]0.64967513230144[/C][/ROW]
[/TABLE]
Source: https://freestatistics.org/blog/index.php?pk=121402&T=2

Globally Unique Identifier (entire table): ba.freestatistics.org/blog/index.php?pk=121402&T=2

As an alternative you can also use a QR Code:  

The GUIDs for individual cells are displayed in the table below:

Regression: S.E.(k) = alpha + beta * Mean(k)
alpha2.59424335376658
beta0.0300342885936344
S.D.0.065328677394248
T-STAT0.459741262055289
p-value0.64967513230144


Regression: ln S.E.(k) = alpha + beta * ln Mean(k)
alpha-9.22062150223519
beta1.89425444969994
S.D.1.98993625125974
T-STAT0.951917152371474
p-value0.35025236145121
Lambda-0.894254449699935

\begin{tabular}{lllllllll}
\hline
Regression: ln S.E.(k) = alpha + beta * ln Mean(k) \tabularnewline
alpha & -9.22062150223519 \tabularnewline
beta & 1.89425444969994 \tabularnewline
S.D. & 1.98993625125974 \tabularnewline
T-STAT & 0.951917152371474 \tabularnewline
p-value & 0.35025236145121 \tabularnewline
Lambda & -0.894254449699935 \tabularnewline
\hline
\end{tabular}
%Source: https://freestatistics.org/blog/index.php?pk=121402&T=3

[TABLE]
[ROW][C]Regression: ln S.E.(k) = alpha + beta * ln Mean(k)[/C][/ROW]
[ROW][C]alpha[/C][C]-9.22062150223519[/C][/ROW]
[ROW][C]beta[/C][C]1.89425444969994[/C][/ROW]
[ROW][C]S.D.[/C][C]1.98993625125974[/C][/ROW]
[ROW][C]T-STAT[/C][C]0.951917152371474[/C][/ROW]
[ROW][C]p-value[/C][C]0.35025236145121[/C][/ROW]
[ROW][C]Lambda[/C][C]-0.894254449699935[/C][/ROW]
[/TABLE]
Source: https://freestatistics.org/blog/index.php?pk=121402&T=3

Globally Unique Identifier (entire table): ba.freestatistics.org/blog/index.php?pk=121402&T=3

As an alternative you can also use a QR Code:  

The GUIDs for individual cells are displayed in the table below:

Regression: ln S.E.(k) = alpha + beta * ln Mean(k)
alpha-9.22062150223519
beta1.89425444969994
S.D.1.98993625125974
T-STAT0.951917152371474
p-value0.35025236145121
Lambda-0.894254449699935


Parameters (Session):
par1 = 4 ;
Parameters (R input):
par1 = 4 ;
R code (references can be found in the software module):
par1 <- as.numeric(par1)
(n <- length(x))
(np <- floor(n / par1))
arr <- array(NA,dim=c(par1,np))
j <- 0
k <- 1
for (i in 1:(np*par1))
{
j = j + 1
arr[j,k] <- x[i]
if (j == par1) {
j = 0
k=k+1
}
}
arr
arr.mean <- array(NA,dim=np)
arr.sd <- array(NA,dim=np)
arr.range <- array(NA,dim=np)
for (j in 1:np)
{
arr.mean[j] <- mean(arr[,j],na.rm=TRUE)
arr.sd[j] <- sd(arr[,j],na.rm=TRUE)
arr.range[j] <- max(arr[,j],na.rm=TRUE) - min(arr[,j],na.rm=TRUE)
}
arr.mean
arr.sd
arr.range
(lm1 <- lm(arr.sd~arr.mean))
(lnlm1 <- lm(log(arr.sd)~log(arr.mean)))
(lm2 <- lm(arr.range~arr.mean))
bitmap(file='test1.png')
plot(arr.mean,arr.sd,main='Standard Deviation-Mean Plot',xlab='mean',ylab='standard deviation')
dev.off()
bitmap(file='test2.png')
plot(arr.mean,arr.range,main='Range-Mean Plot',xlab='mean',ylab='range')
dev.off()
load(file='createtable')
a<-table.start()
a<-table.row.start(a)
a<-table.element(a,'Standard Deviation-Mean Plot',4,TRUE)
a<-table.row.end(a)
a<-table.row.start(a)
a<-table.element(a,'Section',header=TRUE)
a<-table.element(a,'Mean',header=TRUE)
a<-table.element(a,'Standard Deviation',header=TRUE)
a<-table.element(a,'Range',header=TRUE)
a<-table.row.end(a)
for (j in 1:np) {
a<-table.row.start(a)
a<-table.element(a,j,header=TRUE)
a<-table.element(a,arr.mean[j])
a<-table.element(a,arr.sd[j] )
a<-table.element(a,arr.range[j] )
a<-table.row.end(a)
}
a<-table.end(a)
table.save(a,file='mytable.tab')
a<-table.start()
a<-table.row.start(a)
a<-table.element(a,'Regression: S.E.(k) = alpha + beta * Mean(k)',2,TRUE)
a<-table.row.end(a)
a<-table.row.start(a)
a<-table.element(a,'alpha',header=TRUE)
a<-table.element(a,lm1$coefficients[[1]])
a<-table.row.end(a)
a<-table.row.start(a)
a<-table.element(a,'beta',header=TRUE)
a<-table.element(a,lm1$coefficients[[2]])
a<-table.row.end(a)
a<-table.row.start(a)
a<-table.element(a,'S.D.',header=TRUE)
a<-table.element(a,summary(lm1)$coefficients[2,2])
a<-table.row.end(a)
a<-table.row.start(a)
a<-table.element(a,'T-STAT',header=TRUE)
a<-table.element(a,summary(lm1)$coefficients[2,3])
a<-table.row.end(a)
a<-table.row.start(a)
a<-table.element(a,'p-value',header=TRUE)
a<-table.element(a,summary(lm1)$coefficients[2,4])
a<-table.row.end(a)
a<-table.end(a)
table.save(a,file='mytable1.tab')
a<-table.start()
a<-table.row.start(a)
a<-table.element(a,'Regression: ln S.E.(k) = alpha + beta * ln Mean(k)',2,TRUE)
a<-table.row.end(a)
a<-table.row.start(a)
a<-table.element(a,'alpha',header=TRUE)
a<-table.element(a,lnlm1$coefficients[[1]])
a<-table.row.end(a)
a<-table.row.start(a)
a<-table.element(a,'beta',header=TRUE)
a<-table.element(a,lnlm1$coefficients[[2]])
a<-table.row.end(a)
a<-table.row.start(a)
a<-table.element(a,'S.D.',header=TRUE)
a<-table.element(a,summary(lnlm1)$coefficients[2,2])
a<-table.row.end(a)
a<-table.row.start(a)
a<-table.element(a,'T-STAT',header=TRUE)
a<-table.element(a,summary(lnlm1)$coefficients[2,3])
a<-table.row.end(a)
a<-table.row.start(a)
a<-table.element(a,'p-value',header=TRUE)
a<-table.element(a,summary(lnlm1)$coefficients[2,4])
a<-table.row.end(a)
a<-table.row.start(a)
a<-table.element(a,'Lambda',header=TRUE)
a<-table.element(a,1-lnlm1$coefficients[[2]])
a<-table.row.end(a)
a<-table.end(a)
table.save(a,file='mytable2.tab')