Free Statistics

of Irreproducible Research!

Author's title

Author*Unverified author*
R Software Modulerwasp_smp.wasp
Title produced by softwareStandard Deviation-Mean Plot
Date of computationTue, 10 May 2011 11:00:27 +0000
Cite this page as followsStatistical Computations at FreeStatistics.org, Office for Research Development and Education, URL https://freestatistics.org/blog/index.php?v=date/2011/May/10/t13050250610qxhjtfv7o1atao.htm/, Retrieved Mon, 13 May 2024 15:10:17 +0000
Statistical Computations at FreeStatistics.org, Office for Research Development and Education, URL https://freestatistics.org/blog/index.php?pk=121383, Retrieved Mon, 13 May 2024 15:10:17 +0000
QR Codes:

Original text written by user:
IsPrivate?No (this computation is public)
User-defined keywordsKDGP2W83
Estimated Impact116
Family? (F = Feedback message, R = changed R code, M = changed R Module, P = changed Parameters, D = changed Data)
-     [Variability] [] [2011-05-10 10:16:02] [8f770b4f20d4fa0c8c59db7a4b6af20c]
- RMPD    [Standard Deviation-Mean Plot] [] [2011-05-10 11:00:27] [697c881a84403defd656157daf408edb] [Current]
Feedback Forum

Post a new message
Dataseries X:
12544
12264
13783
11214
11453
10883
10381
10348
10024
10805
10796
11907
12261
11377
12689
11474
10992
10764
12164
10409
10398
10349
10865
11630
12221
10884
12019
11021
10799
10423
10484
10450
9906
11049
11281
12485
12849
11380
12079
11366
11328
10444
10854
10434
10137
10992
10906
12367
14371
11695
11546
10922
10670
10254
10573
10239
10253
11176
10719
11817
12503
11510
12012
10941
11252
10662
11114
10415
10626
11411
10936
12513


Summary of computational transaction
Raw Inputview raw input (R code)
Raw Outputview raw output of R engine
Computing time2 seconds
R Server'Gwilym Jenkins' @ www.wessa.org

\begin{tabular}{lllllllll}
\hline
Summary of computational transaction \tabularnewline
Raw Input & view raw input (R code)  \tabularnewline
Raw Output & view raw output of R engine  \tabularnewline
Computing time & 2 seconds \tabularnewline
R Server & 'Gwilym Jenkins' @ www.wessa.org \tabularnewline
\hline
\end{tabular}
%Source: https://freestatistics.org/blog/index.php?pk=121383&T=0

[TABLE]
[ROW][C]Summary of computational transaction[/C][/ROW]
[ROW][C]Raw Input[/C][C]view raw input (R code) [/C][/ROW]
[ROW][C]Raw Output[/C][C]view raw output of R engine [/C][/ROW]
[ROW][C]Computing time[/C][C]2 seconds[/C][/ROW]
[ROW][C]R Server[/C][C]'Gwilym Jenkins' @ www.wessa.org[/C][/ROW]
[/TABLE]
Source: https://freestatistics.org/blog/index.php?pk=121383&T=0

Globally Unique Identifier (entire table): ba.freestatistics.org/blog/index.php?pk=121383&T=0

As an alternative you can also use a QR Code:  

The GUIDs for individual cells are displayed in the table below:

Summary of computational transaction
Raw Inputview raw input (R code)
Raw Outputview raw output of R engine
Computing time2 seconds
R Server'Gwilym Jenkins' @ www.wessa.org


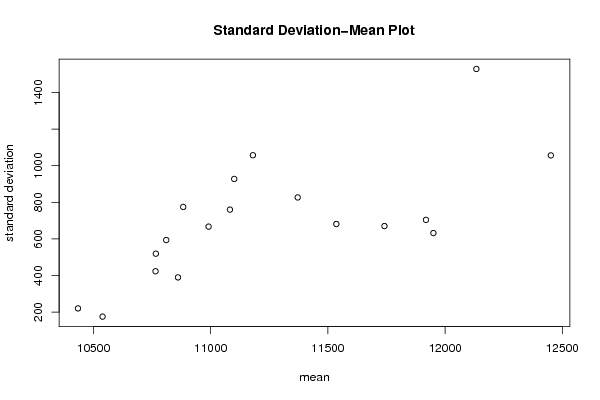
Standard Deviation-Mean Plot
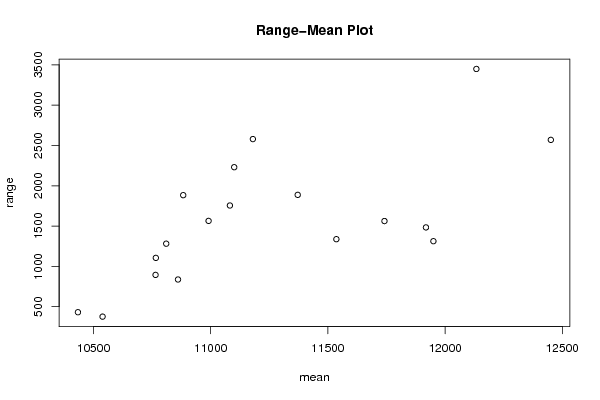
SectionMeanStandard DeviationRange
112451.251056.410707695322569
210766.25519.1681647918461105
310883774.6203371114571883
411950.25631.8614695221311312
511082.25760.0168309539821755
610810.5593.7701575525671281
711536.25681.3816233702421337
810539175.120910611307376
911180.251057.270503072262579
1011918.5703.9955018795691483
1110765423.277686631365894
1211100.5927.7134974405262230
1312133.51528.787864071843449
1410434220.183257008036431
1510991.25667.1153698324351564
1611741.5670.1852977597561562
1710860.75389.618082229252837
1811371.5826.642405557971887

\begin{tabular}{lllllllll}
\hline
Standard Deviation-Mean Plot \tabularnewline
Section & Mean & Standard Deviation & Range \tabularnewline
1 & 12451.25 & 1056.41070769532 & 2569 \tabularnewline
2 & 10766.25 & 519.168164791846 & 1105 \tabularnewline
3 & 10883 & 774.620337111457 & 1883 \tabularnewline
4 & 11950.25 & 631.861469522131 & 1312 \tabularnewline
5 & 11082.25 & 760.016830953982 & 1755 \tabularnewline
6 & 10810.5 & 593.770157552567 & 1281 \tabularnewline
7 & 11536.25 & 681.381623370242 & 1337 \tabularnewline
8 & 10539 & 175.120910611307 & 376 \tabularnewline
9 & 11180.25 & 1057.27050307226 & 2579 \tabularnewline
10 & 11918.5 & 703.995501879569 & 1483 \tabularnewline
11 & 10765 & 423.277686631365 & 894 \tabularnewline
12 & 11100.5 & 927.713497440526 & 2230 \tabularnewline
13 & 12133.5 & 1528.78786407184 & 3449 \tabularnewline
14 & 10434 & 220.183257008036 & 431 \tabularnewline
15 & 10991.25 & 667.115369832435 & 1564 \tabularnewline
16 & 11741.5 & 670.185297759756 & 1562 \tabularnewline
17 & 10860.75 & 389.618082229252 & 837 \tabularnewline
18 & 11371.5 & 826.64240555797 & 1887 \tabularnewline
\hline
\end{tabular}
%Source: https://freestatistics.org/blog/index.php?pk=121383&T=1

[TABLE]
[ROW][C]Standard Deviation-Mean Plot[/C][/ROW]
[ROW][C]Section[/C][C]Mean[/C][C]Standard Deviation[/C][C]Range[/C][/ROW]
[ROW][C]1[/C][C]12451.25[/C][C]1056.41070769532[/C][C]2569[/C][/ROW]
[ROW][C]2[/C][C]10766.25[/C][C]519.168164791846[/C][C]1105[/C][/ROW]
[ROW][C]3[/C][C]10883[/C][C]774.620337111457[/C][C]1883[/C][/ROW]
[ROW][C]4[/C][C]11950.25[/C][C]631.861469522131[/C][C]1312[/C][/ROW]
[ROW][C]5[/C][C]11082.25[/C][C]760.016830953982[/C][C]1755[/C][/ROW]
[ROW][C]6[/C][C]10810.5[/C][C]593.770157552567[/C][C]1281[/C][/ROW]
[ROW][C]7[/C][C]11536.25[/C][C]681.381623370242[/C][C]1337[/C][/ROW]
[ROW][C]8[/C][C]10539[/C][C]175.120910611307[/C][C]376[/C][/ROW]
[ROW][C]9[/C][C]11180.25[/C][C]1057.27050307226[/C][C]2579[/C][/ROW]
[ROW][C]10[/C][C]11918.5[/C][C]703.995501879569[/C][C]1483[/C][/ROW]
[ROW][C]11[/C][C]10765[/C][C]423.277686631365[/C][C]894[/C][/ROW]
[ROW][C]12[/C][C]11100.5[/C][C]927.713497440526[/C][C]2230[/C][/ROW]
[ROW][C]13[/C][C]12133.5[/C][C]1528.78786407184[/C][C]3449[/C][/ROW]
[ROW][C]14[/C][C]10434[/C][C]220.183257008036[/C][C]431[/C][/ROW]
[ROW][C]15[/C][C]10991.25[/C][C]667.115369832435[/C][C]1564[/C][/ROW]
[ROW][C]16[/C][C]11741.5[/C][C]670.185297759756[/C][C]1562[/C][/ROW]
[ROW][C]17[/C][C]10860.75[/C][C]389.618082229252[/C][C]837[/C][/ROW]
[ROW][C]18[/C][C]11371.5[/C][C]826.64240555797[/C][C]1887[/C][/ROW]
[/TABLE]
Source: https://freestatistics.org/blog/index.php?pk=121383&T=1

Globally Unique Identifier (entire table): ba.freestatistics.org/blog/index.php?pk=121383&T=1

As an alternative you can also use a QR Code:  

The GUIDs for individual cells are displayed in the table below:

Standard Deviation-Mean Plot
SectionMeanStandard DeviationRange
112451.251056.410707695322569
210766.25519.1681647918461105
310883774.6203371114571883
411950.25631.8614695221311312
511082.25760.0168309539821755
610810.5593.7701575525671281
711536.25681.3816233702421337
810539175.120910611307376
911180.251057.270503072262579
1011918.5703.9955018795691483
1110765423.277686631365894
1211100.5927.7134974405262230
1312133.51528.787864071843449
1410434220.183257008036431
1510991.25667.1153698324351564
1611741.5670.1852977597561562
1710860.75389.618082229252837
1811371.5826.642405557971887


Regression: S.E.(k) = alpha + beta * Mean(k)
alpha-3565.15706888249
beta0.379131310477355
S.D.0.100235359099347
T-STAT3.78241085664773
p-value0.00163219909045178

\begin{tabular}{lllllllll}
\hline
Regression: S.E.(k) = alpha + beta * Mean(k) \tabularnewline
alpha & -3565.15706888249 \tabularnewline
beta & 0.379131310477355 \tabularnewline
S.D. & 0.100235359099347 \tabularnewline
T-STAT & 3.78241085664773 \tabularnewline
p-value & 0.00163219909045178 \tabularnewline
\hline
\end{tabular}
%Source: https://freestatistics.org/blog/index.php?pk=121383&T=2

[TABLE]
[ROW][C]Regression: S.E.(k) = alpha + beta * Mean(k)[/C][/ROW]
[ROW][C]alpha[/C][C]-3565.15706888249[/C][/ROW]
[ROW][C]beta[/C][C]0.379131310477355[/C][/ROW]
[ROW][C]S.D.[/C][C]0.100235359099347[/C][/ROW]
[ROW][C]T-STAT[/C][C]3.78241085664773[/C][/ROW]
[ROW][C]p-value[/C][C]0.00163219909045178[/C][/ROW]
[/TABLE]
Source: https://freestatistics.org/blog/index.php?pk=121383&T=2

Globally Unique Identifier (entire table): ba.freestatistics.org/blog/index.php?pk=121383&T=2

As an alternative you can also use a QR Code:  

The GUIDs for individual cells are displayed in the table below:

Regression: S.E.(k) = alpha + beta * Mean(k)
alpha-3565.15706888249
beta0.379131310477355
S.D.0.100235359099347
T-STAT3.78241085664773
p-value0.00163219909045178


Regression: ln S.E.(k) = alpha + beta * ln Mean(k)
alpha-61.431544277611
beta7.27647930315155
S.D.1.87048624047479
T-STAT3.89015387854687
p-value0.00130047124465605
Lambda-6.27647930315155

\begin{tabular}{lllllllll}
\hline
Regression: ln S.E.(k) = alpha + beta * ln Mean(k) \tabularnewline
alpha & -61.431544277611 \tabularnewline
beta & 7.27647930315155 \tabularnewline
S.D. & 1.87048624047479 \tabularnewline
T-STAT & 3.89015387854687 \tabularnewline
p-value & 0.00130047124465605 \tabularnewline
Lambda & -6.27647930315155 \tabularnewline
\hline
\end{tabular}
%Source: https://freestatistics.org/blog/index.php?pk=121383&T=3

[TABLE]
[ROW][C]Regression: ln S.E.(k) = alpha + beta * ln Mean(k)[/C][/ROW]
[ROW][C]alpha[/C][C]-61.431544277611[/C][/ROW]
[ROW][C]beta[/C][C]7.27647930315155[/C][/ROW]
[ROW][C]S.D.[/C][C]1.87048624047479[/C][/ROW]
[ROW][C]T-STAT[/C][C]3.89015387854687[/C][/ROW]
[ROW][C]p-value[/C][C]0.00130047124465605[/C][/ROW]
[ROW][C]Lambda[/C][C]-6.27647930315155[/C][/ROW]
[/TABLE]
Source: https://freestatistics.org/blog/index.php?pk=121383&T=3

Globally Unique Identifier (entire table): ba.freestatistics.org/blog/index.php?pk=121383&T=3

As an alternative you can also use a QR Code:  

The GUIDs for individual cells are displayed in the table below:

Regression: ln S.E.(k) = alpha + beta * ln Mean(k)
alpha-61.431544277611
beta7.27647930315155
S.D.1.87048624047479
T-STAT3.89015387854687
p-value0.00130047124465605
Lambda-6.27647930315155


Parameters (Session):
par1 = 4 ;
Parameters (R input):
par1 = 4 ;
R code (references can be found in the software module):
par1 <- as.numeric(par1)
(n <- length(x))
(np <- floor(n / par1))
arr <- array(NA,dim=c(par1,np))
j <- 0
k <- 1
for (i in 1:(np*par1))
{
j = j + 1
arr[j,k] <- x[i]
if (j == par1) {
j = 0
k=k+1
}
}
arr
arr.mean <- array(NA,dim=np)
arr.sd <- array(NA,dim=np)
arr.range <- array(NA,dim=np)
for (j in 1:np)
{
arr.mean[j] <- mean(arr[,j],na.rm=TRUE)
arr.sd[j] <- sd(arr[,j],na.rm=TRUE)
arr.range[j] <- max(arr[,j],na.rm=TRUE) - min(arr[,j],na.rm=TRUE)
}
arr.mean
arr.sd
arr.range
(lm1 <- lm(arr.sd~arr.mean))
(lnlm1 <- lm(log(arr.sd)~log(arr.mean)))
(lm2 <- lm(arr.range~arr.mean))
bitmap(file='test1.png')
plot(arr.mean,arr.sd,main='Standard Deviation-Mean Plot',xlab='mean',ylab='standard deviation')
dev.off()
bitmap(file='test2.png')
plot(arr.mean,arr.range,main='Range-Mean Plot',xlab='mean',ylab='range')
dev.off()
load(file='createtable')
a<-table.start()
a<-table.row.start(a)
a<-table.element(a,'Standard Deviation-Mean Plot',4,TRUE)
a<-table.row.end(a)
a<-table.row.start(a)
a<-table.element(a,'Section',header=TRUE)
a<-table.element(a,'Mean',header=TRUE)
a<-table.element(a,'Standard Deviation',header=TRUE)
a<-table.element(a,'Range',header=TRUE)
a<-table.row.end(a)
for (j in 1:np) {
a<-table.row.start(a)
a<-table.element(a,j,header=TRUE)
a<-table.element(a,arr.mean[j])
a<-table.element(a,arr.sd[j] )
a<-table.element(a,arr.range[j] )
a<-table.row.end(a)
}
a<-table.end(a)
table.save(a,file='mytable.tab')
a<-table.start()
a<-table.row.start(a)
a<-table.element(a,'Regression: S.E.(k) = alpha + beta * Mean(k)',2,TRUE)
a<-table.row.end(a)
a<-table.row.start(a)
a<-table.element(a,'alpha',header=TRUE)
a<-table.element(a,lm1$coefficients[[1]])
a<-table.row.end(a)
a<-table.row.start(a)
a<-table.element(a,'beta',header=TRUE)
a<-table.element(a,lm1$coefficients[[2]])
a<-table.row.end(a)
a<-table.row.start(a)
a<-table.element(a,'S.D.',header=TRUE)
a<-table.element(a,summary(lm1)$coefficients[2,2])
a<-table.row.end(a)
a<-table.row.start(a)
a<-table.element(a,'T-STAT',header=TRUE)
a<-table.element(a,summary(lm1)$coefficients[2,3])
a<-table.row.end(a)
a<-table.row.start(a)
a<-table.element(a,'p-value',header=TRUE)
a<-table.element(a,summary(lm1)$coefficients[2,4])
a<-table.row.end(a)
a<-table.end(a)
table.save(a,file='mytable1.tab')
a<-table.start()
a<-table.row.start(a)
a<-table.element(a,'Regression: ln S.E.(k) = alpha + beta * ln Mean(k)',2,TRUE)
a<-table.row.end(a)
a<-table.row.start(a)
a<-table.element(a,'alpha',header=TRUE)
a<-table.element(a,lnlm1$coefficients[[1]])
a<-table.row.end(a)
a<-table.row.start(a)
a<-table.element(a,'beta',header=TRUE)
a<-table.element(a,lnlm1$coefficients[[2]])
a<-table.row.end(a)
a<-table.row.start(a)
a<-table.element(a,'S.D.',header=TRUE)
a<-table.element(a,summary(lnlm1)$coefficients[2,2])
a<-table.row.end(a)
a<-table.row.start(a)
a<-table.element(a,'T-STAT',header=TRUE)
a<-table.element(a,summary(lnlm1)$coefficients[2,3])
a<-table.row.end(a)
a<-table.row.start(a)
a<-table.element(a,'p-value',header=TRUE)
a<-table.element(a,summary(lnlm1)$coefficients[2,4])
a<-table.row.end(a)
a<-table.row.start(a)
a<-table.element(a,'Lambda',header=TRUE)
a<-table.element(a,1-lnlm1$coefficients[[2]])
a<-table.row.end(a)
a<-table.end(a)
table.save(a,file='mytable2.tab')