Free Statistics

of Irreproducible Research!

Author's title

Author*Unverified author*
R Software Modulerwasp_smp.wasp
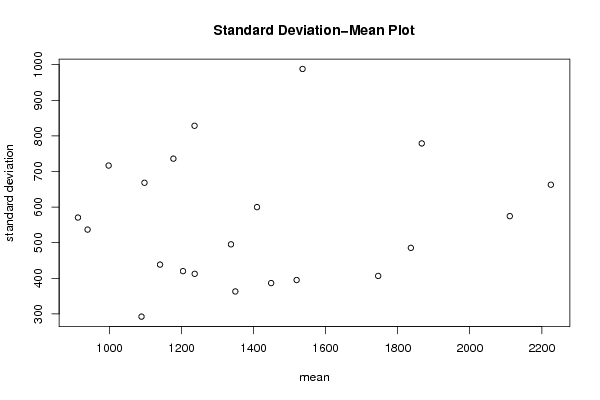
Title produced by softwareStandard Deviation-Mean Plot
Date of computationMon, 09 May 2011 21:46:33 +0000
Cite this page as followsStatistical Computations at FreeStatistics.org, Office for Research Development and Education, URL https://freestatistics.org/blog/index.php?v=date/2011/May/09/t1304977691wf4i3b2hd1t8943.htm/, Retrieved Tue, 14 May 2024 20:00:13 +0000
Statistical Computations at FreeStatistics.org, Office for Research Development and Education, URL https://freestatistics.org/blog/index.php?pk=121366, Retrieved Tue, 14 May 2024 20:00:13 +0000
QR Codes:

Original text written by user:
IsPrivate?No (this computation is public)
User-defined keywordsKDGP2W83
Estimated Impact93
Family? (F = Feedback message, R = changed R code, M = changed R Module, P = changed Parameters, D = changed Data)
-       [Standard Deviation-Mean Plot] [Alexander De Raey...] [2011-05-09 21:46:33] [67591050a6cb6cfbed77a59a4d2c72eb] [Current]
Feedback Forum

Post a new message
Dataseries X:
2435
1379
1511
2021
1614
1680
1630
870
1877
2428
1711
127
3192
1934
2075
1700
1198
1582
1705
911
1817
1168
920
84
2254
1485
1886
1358
1167
1781
1218
779
1418
1641
1196
132
2926
1777
2094
1648
1646
1537
1917
977
1475
2124
1209
135
2917
1981
1398
1171
903
1390
1280
781
1828
1631
1063
186
2275
1342
1070
950
1121
1305
1586
548
1225
1419
880
124
2044
1143
897
1264
1326
1529
1373
587
1137
1426
1016
176
2614


Summary of computational transaction
Raw Inputview raw input (R code)
Raw Outputview raw output of R engine
Computing time2 seconds
R Server'RServer@AstonUniversity' @ vre.aston.ac.uk

\begin{tabular}{lllllllll}
\hline
Summary of computational transaction \tabularnewline
Raw Input & view raw input (R code)  \tabularnewline
Raw Output & view raw output of R engine  \tabularnewline
Computing time & 2 seconds \tabularnewline
R Server & 'RServer@AstonUniversity' @ vre.aston.ac.uk \tabularnewline
\hline
\end{tabular}
%Source: https://freestatistics.org/blog/index.php?pk=121366&T=0

[TABLE]
[ROW][C]Summary of computational transaction[/C][/ROW]
[ROW][C]Raw Input[/C][C]view raw input (R code) [/C][/ROW]
[ROW][C]Raw Output[/C][C]view raw output of R engine [/C][/ROW]
[ROW][C]Computing time[/C][C]2 seconds[/C][/ROW]
[ROW][C]R Server[/C][C]'RServer@AstonUniversity' @ vre.aston.ac.uk[/C][/ROW]
[/TABLE]
Source: https://freestatistics.org/blog/index.php?pk=121366&T=0

Globally Unique Identifier (entire table): ba.freestatistics.org/blog/index.php?pk=121366&T=0

As an alternative you can also use a QR Code:  

The GUIDs for individual cells are displayed in the table below:

Summary of computational transaction
Raw Inputview raw input (R code)
Raw Outputview raw output of R engine
Computing time2 seconds
R Server'RServer@AstonUniversity' @ vre.aston.ac.uk


Standard Deviation-Mean Plot
SectionMeanStandard DeviationRange
11836.5485.6263996118831056
21448.5386.689798158679810
31535.75987.9019435146382301
42225.25662.7957830282271492
51349363.166628422822794
6997.25716.7376902791331733
71745.75406.746747579703896
81236.25412.6979323104651002
91096.75668.3319409794311509
102111.25574.5835448392171278
111519.25395.230207178888940
121235.75828.3708408677841989
131866.75778.8608669075631746
141088.5292.427198917383609
151177735.9787134602921642
161409.25600.0129859705821325
171140438.5453226292581038
18912570.6680295933881295
191337495.4506366262271147
201203.75420.221667694563942
21938.75536.8024931636091250

\begin{tabular}{lllllllll}
\hline
Standard Deviation-Mean Plot \tabularnewline
Section & Mean & Standard Deviation & Range \tabularnewline
1 & 1836.5 & 485.626399611883 & 1056 \tabularnewline
2 & 1448.5 & 386.689798158679 & 810 \tabularnewline
3 & 1535.75 & 987.901943514638 & 2301 \tabularnewline
4 & 2225.25 & 662.795783028227 & 1492 \tabularnewline
5 & 1349 & 363.166628422822 & 794 \tabularnewline
6 & 997.25 & 716.737690279133 & 1733 \tabularnewline
7 & 1745.75 & 406.746747579703 & 896 \tabularnewline
8 & 1236.25 & 412.697932310465 & 1002 \tabularnewline
9 & 1096.75 & 668.331940979431 & 1509 \tabularnewline
10 & 2111.25 & 574.583544839217 & 1278 \tabularnewline
11 & 1519.25 & 395.230207178888 & 940 \tabularnewline
12 & 1235.75 & 828.370840867784 & 1989 \tabularnewline
13 & 1866.75 & 778.860866907563 & 1746 \tabularnewline
14 & 1088.5 & 292.427198917383 & 609 \tabularnewline
15 & 1177 & 735.978713460292 & 1642 \tabularnewline
16 & 1409.25 & 600.012985970582 & 1325 \tabularnewline
17 & 1140 & 438.545322629258 & 1038 \tabularnewline
18 & 912 & 570.668029593388 & 1295 \tabularnewline
19 & 1337 & 495.450636626227 & 1147 \tabularnewline
20 & 1203.75 & 420.221667694563 & 942 \tabularnewline
21 & 938.75 & 536.802493163609 & 1250 \tabularnewline
\hline
\end{tabular}
%Source: https://freestatistics.org/blog/index.php?pk=121366&T=1

[TABLE]
[ROW][C]Standard Deviation-Mean Plot[/C][/ROW]
[ROW][C]Section[/C][C]Mean[/C][C]Standard Deviation[/C][C]Range[/C][/ROW]
[ROW][C]1[/C][C]1836.5[/C][C]485.626399611883[/C][C]1056[/C][/ROW]
[ROW][C]2[/C][C]1448.5[/C][C]386.689798158679[/C][C]810[/C][/ROW]
[ROW][C]3[/C][C]1535.75[/C][C]987.901943514638[/C][C]2301[/C][/ROW]
[ROW][C]4[/C][C]2225.25[/C][C]662.795783028227[/C][C]1492[/C][/ROW]
[ROW][C]5[/C][C]1349[/C][C]363.166628422822[/C][C]794[/C][/ROW]
[ROW][C]6[/C][C]997.25[/C][C]716.737690279133[/C][C]1733[/C][/ROW]
[ROW][C]7[/C][C]1745.75[/C][C]406.746747579703[/C][C]896[/C][/ROW]
[ROW][C]8[/C][C]1236.25[/C][C]412.697932310465[/C][C]1002[/C][/ROW]
[ROW][C]9[/C][C]1096.75[/C][C]668.331940979431[/C][C]1509[/C][/ROW]
[ROW][C]10[/C][C]2111.25[/C][C]574.583544839217[/C][C]1278[/C][/ROW]
[ROW][C]11[/C][C]1519.25[/C][C]395.230207178888[/C][C]940[/C][/ROW]
[ROW][C]12[/C][C]1235.75[/C][C]828.370840867784[/C][C]1989[/C][/ROW]
[ROW][C]13[/C][C]1866.75[/C][C]778.860866907563[/C][C]1746[/C][/ROW]
[ROW][C]14[/C][C]1088.5[/C][C]292.427198917383[/C][C]609[/C][/ROW]
[ROW][C]15[/C][C]1177[/C][C]735.978713460292[/C][C]1642[/C][/ROW]
[ROW][C]16[/C][C]1409.25[/C][C]600.012985970582[/C][C]1325[/C][/ROW]
[ROW][C]17[/C][C]1140[/C][C]438.545322629258[/C][C]1038[/C][/ROW]
[ROW][C]18[/C][C]912[/C][C]570.668029593388[/C][C]1295[/C][/ROW]
[ROW][C]19[/C][C]1337[/C][C]495.450636626227[/C][C]1147[/C][/ROW]
[ROW][C]20[/C][C]1203.75[/C][C]420.221667694563[/C][C]942[/C][/ROW]
[ROW][C]21[/C][C]938.75[/C][C]536.802493163609[/C][C]1250[/C][/ROW]
[/TABLE]
Source: https://freestatistics.org/blog/index.php?pk=121366&T=1

Globally Unique Identifier (entire table): ba.freestatistics.org/blog/index.php?pk=121366&T=1

As an alternative you can also use a QR Code:  

The GUIDs for individual cells are displayed in the table below:

Standard Deviation-Mean Plot
SectionMeanStandard DeviationRange
11836.5485.6263996118831056
21448.5386.689798158679810
31535.75987.9019435146382301
42225.25662.7957830282271492
51349363.166628422822794
6997.25716.7376902791331733
71745.75406.746747579703896
81236.25412.6979323104651002
91096.75668.3319409794311509
102111.25574.5835448392171278
111519.25395.230207178888940
121235.75828.3708408677841989
131866.75778.8608669075631746
141088.5292.427198917383609
151177735.9787134602921642
161409.25600.0129859705821325
171140438.5453226292581038
18912570.6680295933881295
191337495.4506366262271147
201203.75420.221667694563942
21938.75536.8024931636091250


Regression: S.E.(k) = alpha + beta * Mean(k)
alpha484.471324873897
beta0.0538570583174877
S.D.0.109617118661329
T-STAT0.491319777195416
p-value0.628827700403929

\begin{tabular}{lllllllll}
\hline
Regression: S.E.(k) = alpha + beta * Mean(k) \tabularnewline
alpha & 484.471324873897 \tabularnewline
beta & 0.0538570583174877 \tabularnewline
S.D. & 0.109617118661329 \tabularnewline
T-STAT & 0.491319777195416 \tabularnewline
p-value & 0.628827700403929 \tabularnewline
\hline
\end{tabular}
%Source: https://freestatistics.org/blog/index.php?pk=121366&T=2

[TABLE]
[ROW][C]Regression: S.E.(k) = alpha + beta * Mean(k)[/C][/ROW]
[ROW][C]alpha[/C][C]484.471324873897[/C][/ROW]
[ROW][C]beta[/C][C]0.0538570583174877[/C][/ROW]
[ROW][C]S.D.[/C][C]0.109617118661329[/C][/ROW]
[ROW][C]T-STAT[/C][C]0.491319777195416[/C][/ROW]
[ROW][C]p-value[/C][C]0.628827700403929[/C][/ROW]
[/TABLE]
Source: https://freestatistics.org/blog/index.php?pk=121366&T=2

Globally Unique Identifier (entire table): ba.freestatistics.org/blog/index.php?pk=121366&T=2

As an alternative you can also use a QR Code:  

The GUIDs for individual cells are displayed in the table below:

Regression: S.E.(k) = alpha + beta * Mean(k)
alpha484.471324873897
beta0.0538570583174877
S.D.0.109617118661329
T-STAT0.491319777195416
p-value0.628827700403929


Regression: ln S.E.(k) = alpha + beta * ln Mean(k)
alpha5.40369851258795
beta0.121551285801388
S.D.0.282297001155001
T-STAT0.430579444004251
p-value0.671619035008393
Lambda0.878448714198612

\begin{tabular}{lllllllll}
\hline
Regression: ln S.E.(k) = alpha + beta * ln Mean(k) \tabularnewline
alpha & 5.40369851258795 \tabularnewline
beta & 0.121551285801388 \tabularnewline
S.D. & 0.282297001155001 \tabularnewline
T-STAT & 0.430579444004251 \tabularnewline
p-value & 0.671619035008393 \tabularnewline
Lambda & 0.878448714198612 \tabularnewline
\hline
\end{tabular}
%Source: https://freestatistics.org/blog/index.php?pk=121366&T=3

[TABLE]
[ROW][C]Regression: ln S.E.(k) = alpha + beta * ln Mean(k)[/C][/ROW]
[ROW][C]alpha[/C][C]5.40369851258795[/C][/ROW]
[ROW][C]beta[/C][C]0.121551285801388[/C][/ROW]
[ROW][C]S.D.[/C][C]0.282297001155001[/C][/ROW]
[ROW][C]T-STAT[/C][C]0.430579444004251[/C][/ROW]
[ROW][C]p-value[/C][C]0.671619035008393[/C][/ROW]
[ROW][C]Lambda[/C][C]0.878448714198612[/C][/ROW]
[/TABLE]
Source: https://freestatistics.org/blog/index.php?pk=121366&T=3

Globally Unique Identifier (entire table): ba.freestatistics.org/blog/index.php?pk=121366&T=3

As an alternative you can also use a QR Code:  

The GUIDs for individual cells are displayed in the table below:

Regression: ln S.E.(k) = alpha + beta * ln Mean(k)
alpha5.40369851258795
beta0.121551285801388
S.D.0.282297001155001
T-STAT0.430579444004251
p-value0.671619035008393
Lambda0.878448714198612


Parameters (Session):
par1 = 4 ;
Parameters (R input):
par1 = 4 ;
R code (references can be found in the software module):
par1 <- as.numeric(par1)
(n <- length(x))
(np <- floor(n / par1))
arr <- array(NA,dim=c(par1,np))
j <- 0
k <- 1
for (i in 1:(np*par1))
{
j = j + 1
arr[j,k] <- x[i]
if (j == par1) {
j = 0
k=k+1
}
}
arr
arr.mean <- array(NA,dim=np)
arr.sd <- array(NA,dim=np)
arr.range <- array(NA,dim=np)
for (j in 1:np)
{
arr.mean[j] <- mean(arr[,j],na.rm=TRUE)
arr.sd[j] <- sd(arr[,j],na.rm=TRUE)
arr.range[j] <- max(arr[,j],na.rm=TRUE) - min(arr[,j],na.rm=TRUE)
}
arr.mean
arr.sd
arr.range
(lm1 <- lm(arr.sd~arr.mean))
(lnlm1 <- lm(log(arr.sd)~log(arr.mean)))
(lm2 <- lm(arr.range~arr.mean))
bitmap(file='test1.png')
plot(arr.mean,arr.sd,main='Standard Deviation-Mean Plot',xlab='mean',ylab='standard deviation')
dev.off()
bitmap(file='test2.png')
plot(arr.mean,arr.range,main='Range-Mean Plot',xlab='mean',ylab='range')
dev.off()
load(file='createtable')
a<-table.start()
a<-table.row.start(a)
a<-table.element(a,'Standard Deviation-Mean Plot',4,TRUE)
a<-table.row.end(a)
a<-table.row.start(a)
a<-table.element(a,'Section',header=TRUE)
a<-table.element(a,'Mean',header=TRUE)
a<-table.element(a,'Standard Deviation',header=TRUE)
a<-table.element(a,'Range',header=TRUE)
a<-table.row.end(a)
for (j in 1:np) {
a<-table.row.start(a)
a<-table.element(a,j,header=TRUE)
a<-table.element(a,arr.mean[j])
a<-table.element(a,arr.sd[j] )
a<-table.element(a,arr.range[j] )
a<-table.row.end(a)
}
a<-table.end(a)
table.save(a,file='mytable.tab')
a<-table.start()
a<-table.row.start(a)
a<-table.element(a,'Regression: S.E.(k) = alpha + beta * Mean(k)',2,TRUE)
a<-table.row.end(a)
a<-table.row.start(a)
a<-table.element(a,'alpha',header=TRUE)
a<-table.element(a,lm1$coefficients[[1]])
a<-table.row.end(a)
a<-table.row.start(a)
a<-table.element(a,'beta',header=TRUE)
a<-table.element(a,lm1$coefficients[[2]])
a<-table.row.end(a)
a<-table.row.start(a)
a<-table.element(a,'S.D.',header=TRUE)
a<-table.element(a,summary(lm1)$coefficients[2,2])
a<-table.row.end(a)
a<-table.row.start(a)
a<-table.element(a,'T-STAT',header=TRUE)
a<-table.element(a,summary(lm1)$coefficients[2,3])
a<-table.row.end(a)
a<-table.row.start(a)
a<-table.element(a,'p-value',header=TRUE)
a<-table.element(a,summary(lm1)$coefficients[2,4])
a<-table.row.end(a)
a<-table.end(a)
table.save(a,file='mytable1.tab')
a<-table.start()
a<-table.row.start(a)
a<-table.element(a,'Regression: ln S.E.(k) = alpha + beta * ln Mean(k)',2,TRUE)
a<-table.row.end(a)
a<-table.row.start(a)
a<-table.element(a,'alpha',header=TRUE)
a<-table.element(a,lnlm1$coefficients[[1]])
a<-table.row.end(a)
a<-table.row.start(a)
a<-table.element(a,'beta',header=TRUE)
a<-table.element(a,lnlm1$coefficients[[2]])
a<-table.row.end(a)
a<-table.row.start(a)
a<-table.element(a,'S.D.',header=TRUE)
a<-table.element(a,summary(lnlm1)$coefficients[2,2])
a<-table.row.end(a)
a<-table.row.start(a)
a<-table.element(a,'T-STAT',header=TRUE)
a<-table.element(a,summary(lnlm1)$coefficients[2,3])
a<-table.row.end(a)
a<-table.row.start(a)
a<-table.element(a,'p-value',header=TRUE)
a<-table.element(a,summary(lnlm1)$coefficients[2,4])
a<-table.row.end(a)
a<-table.row.start(a)
a<-table.element(a,'Lambda',header=TRUE)
a<-table.element(a,1-lnlm1$coefficients[[2]])
a<-table.row.end(a)
a<-table.end(a)
table.save(a,file='mytable2.tab')