Free Statistics

of Irreproducible Research!

Author's title

Author*Unverified author*
R Software Modulerwasp_smp.wasp
Title produced by softwareStandard Deviation-Mean Plot
Date of computationMon, 09 May 2011 18:13:22 +0000
Cite this page as followsStatistical Computations at FreeStatistics.org, Office for Research Development and Education, URL https://freestatistics.org/blog/index.php?v=date/2011/May/09/t1304964585qim5874hey9vrv9.htm/, Retrieved Tue, 14 May 2024 15:26:01 +0000
Statistical Computations at FreeStatistics.org, Office for Research Development and Education, URL https://freestatistics.org/blog/index.php?pk=121320, Retrieved Tue, 14 May 2024 15:26:01 +0000
QR Codes:

Original text written by user:
IsPrivate?No (this computation is public)
User-defined keywordsKDGP2W83
Estimated Impact86
Family? (F = Feedback message, R = changed R code, M = changed R Module, P = changed Parameters, D = changed Data)
-       [Standard Deviation-Mean Plot] [] [2011-05-09 18:13:22] [cbd72b4390db0347015264c7aa42331b] [Current]
Feedback Forum

Post a new message
Dataseries X:
30790
30800
31025
30835
31110
31270
31090
30755
31460
32135
32680
32700
32515
32275
32200
31835
31985
31875
31795
32260
33255
33160
32195
33130
33950
34210
33855
33735
34175
34265
33915
33660
33720
33810
33590
33545
33660
33165
33800
33880
33975
33930
33905
33890
33640
34395
34245
33940
34295
33745
33535
33715
33600
34120
34330
34130
33755
32910
32910
32850
32780
32565
31905
31975
31380
31355
31440
30310
31410
31300
31070
31075
31815


Summary of computational transaction
Raw Inputview raw input (R code)
Raw Outputview raw output of R engine
Computing time1 seconds
R Server'Sir Ronald Aylmer Fisher' @ 193.190.124.24

\begin{tabular}{lllllllll}
\hline
Summary of computational transaction \tabularnewline
Raw Input & view raw input (R code)  \tabularnewline
Raw Output & view raw output of R engine  \tabularnewline
Computing time & 1 seconds \tabularnewline
R Server & 'Sir Ronald Aylmer Fisher' @ 193.190.124.24 \tabularnewline
\hline
\end{tabular}
%Source: https://freestatistics.org/blog/index.php?pk=121320&T=0

[TABLE]
[ROW][C]Summary of computational transaction[/C][/ROW]
[ROW][C]Raw Input[/C][C]view raw input (R code) [/C][/ROW]
[ROW][C]Raw Output[/C][C]view raw output of R engine [/C][/ROW]
[ROW][C]Computing time[/C][C]1 seconds[/C][/ROW]
[ROW][C]R Server[/C][C]'Sir Ronald Aylmer Fisher' @ 193.190.124.24[/C][/ROW]
[/TABLE]
Source: https://freestatistics.org/blog/index.php?pk=121320&T=0

Globally Unique Identifier (entire table): ba.freestatistics.org/blog/index.php?pk=121320&T=0

As an alternative you can also use a QR Code:  

The GUIDs for individual cells are displayed in the table below:

Summary of computational transaction
Raw Inputview raw input (R code)
Raw Outputview raw output of R engine
Computing time1 seconds
R Server'Sir Ronald Aylmer Fisher' @ 193.190.124.24


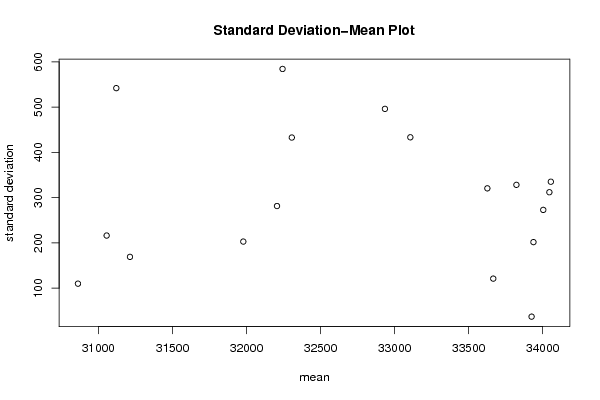
Standard Deviation-Mean Plot
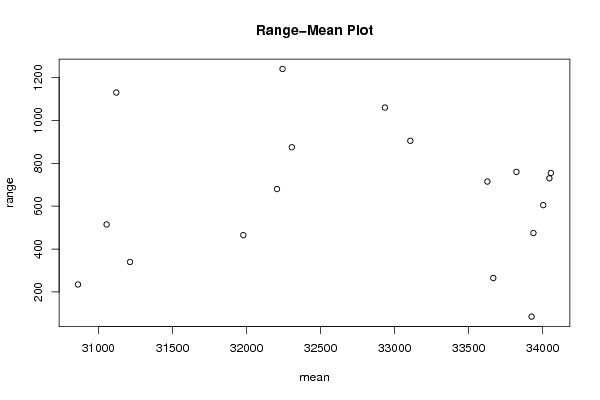
SectionMeanStandard DeviationRange
130862.5110.037872268294235
231056.25216.38603620998515
332243.75584.3996206934661240
432206.25281.613653788306680
531978.75203.034274610635465
632935496.2022437138581060
733937.5201.845650601311475
834003.75273.019382706308605
933666.25121.200591307688265
1033626.25320.660126405929715
113392537.193189340702385
1234055335.236235113887755
1333822.5328.367172537085760
1434045312.036322672003730
1533106.25433.423868747442905
1632306.25432.865933825551875
1731121.25542.0082256448391130
1831213.75169.183086231061340

\begin{tabular}{lllllllll}
\hline
Standard Deviation-Mean Plot \tabularnewline
Section & Mean & Standard Deviation & Range \tabularnewline
1 & 30862.5 & 110.037872268294 & 235 \tabularnewline
2 & 31056.25 & 216.38603620998 & 515 \tabularnewline
3 & 32243.75 & 584.399620693466 & 1240 \tabularnewline
4 & 32206.25 & 281.613653788306 & 680 \tabularnewline
5 & 31978.75 & 203.034274610635 & 465 \tabularnewline
6 & 32935 & 496.202243713858 & 1060 \tabularnewline
7 & 33937.5 & 201.845650601311 & 475 \tabularnewline
8 & 34003.75 & 273.019382706308 & 605 \tabularnewline
9 & 33666.25 & 121.200591307688 & 265 \tabularnewline
10 & 33626.25 & 320.660126405929 & 715 \tabularnewline
11 & 33925 & 37.1931893407023 & 85 \tabularnewline
12 & 34055 & 335.236235113887 & 755 \tabularnewline
13 & 33822.5 & 328.367172537085 & 760 \tabularnewline
14 & 34045 & 312.036322672003 & 730 \tabularnewline
15 & 33106.25 & 433.423868747442 & 905 \tabularnewline
16 & 32306.25 & 432.865933825551 & 875 \tabularnewline
17 & 31121.25 & 542.008225644839 & 1130 \tabularnewline
18 & 31213.75 & 169.183086231061 & 340 \tabularnewline
\hline
\end{tabular}
%Source: https://freestatistics.org/blog/index.php?pk=121320&T=1

[TABLE]
[ROW][C]Standard Deviation-Mean Plot[/C][/ROW]
[ROW][C]Section[/C][C]Mean[/C][C]Standard Deviation[/C][C]Range[/C][/ROW]
[ROW][C]1[/C][C]30862.5[/C][C]110.037872268294[/C][C]235[/C][/ROW]
[ROW][C]2[/C][C]31056.25[/C][C]216.38603620998[/C][C]515[/C][/ROW]
[ROW][C]3[/C][C]32243.75[/C][C]584.399620693466[/C][C]1240[/C][/ROW]
[ROW][C]4[/C][C]32206.25[/C][C]281.613653788306[/C][C]680[/C][/ROW]
[ROW][C]5[/C][C]31978.75[/C][C]203.034274610635[/C][C]465[/C][/ROW]
[ROW][C]6[/C][C]32935[/C][C]496.202243713858[/C][C]1060[/C][/ROW]
[ROW][C]7[/C][C]33937.5[/C][C]201.845650601311[/C][C]475[/C][/ROW]
[ROW][C]8[/C][C]34003.75[/C][C]273.019382706308[/C][C]605[/C][/ROW]
[ROW][C]9[/C][C]33666.25[/C][C]121.200591307688[/C][C]265[/C][/ROW]
[ROW][C]10[/C][C]33626.25[/C][C]320.660126405929[/C][C]715[/C][/ROW]
[ROW][C]11[/C][C]33925[/C][C]37.1931893407023[/C][C]85[/C][/ROW]
[ROW][C]12[/C][C]34055[/C][C]335.236235113887[/C][C]755[/C][/ROW]
[ROW][C]13[/C][C]33822.5[/C][C]328.367172537085[/C][C]760[/C][/ROW]
[ROW][C]14[/C][C]34045[/C][C]312.036322672003[/C][C]730[/C][/ROW]
[ROW][C]15[/C][C]33106.25[/C][C]433.423868747442[/C][C]905[/C][/ROW]
[ROW][C]16[/C][C]32306.25[/C][C]432.865933825551[/C][C]875[/C][/ROW]
[ROW][C]17[/C][C]31121.25[/C][C]542.008225644839[/C][C]1130[/C][/ROW]
[ROW][C]18[/C][C]31213.75[/C][C]169.183086231061[/C][C]340[/C][/ROW]
[/TABLE]
Source: https://freestatistics.org/blog/index.php?pk=121320&T=1

Globally Unique Identifier (entire table): ba.freestatistics.org/blog/index.php?pk=121320&T=1

As an alternative you can also use a QR Code:  

The GUIDs for individual cells are displayed in the table below:

Standard Deviation-Mean Plot
SectionMeanStandard DeviationRange
130862.5110.037872268294235
231056.25216.38603620998515
332243.75584.3996206934661240
432206.25281.613653788306680
531978.75203.034274610635465
632935496.2022437138581060
733937.5201.845650601311475
834003.75273.019382706308605
933666.25121.200591307688265
1033626.25320.660126405929715
113392537.193189340702385
1234055335.236235113887755
1333822.5328.367172537085760
1434045312.036322672003730
1533106.25433.423868747442905
1632306.25432.865933825551875
1731121.25542.0082256448391130
1831213.75169.183086231061340


Regression: S.E.(k) = alpha + beta * Mean(k)
alpha636.070263053413
beta-0.0102532382640444
S.D.0.0324564902603819
T-STAT-0.315907178557753
p-value0.756156513140967

\begin{tabular}{lllllllll}
\hline
Regression: S.E.(k) = alpha + beta * Mean(k) \tabularnewline
alpha & 636.070263053413 \tabularnewline
beta & -0.0102532382640444 \tabularnewline
S.D. & 0.0324564902603819 \tabularnewline
T-STAT & -0.315907178557753 \tabularnewline
p-value & 0.756156513140967 \tabularnewline
\hline
\end{tabular}
%Source: https://freestatistics.org/blog/index.php?pk=121320&T=2

[TABLE]
[ROW][C]Regression: S.E.(k) = alpha + beta * Mean(k)[/C][/ROW]
[ROW][C]alpha[/C][C]636.070263053413[/C][/ROW]
[ROW][C]beta[/C][C]-0.0102532382640444[/C][/ROW]
[ROW][C]S.D.[/C][C]0.0324564902603819[/C][/ROW]
[ROW][C]T-STAT[/C][C]-0.315907178557753[/C][/ROW]
[ROW][C]p-value[/C][C]0.756156513140967[/C][/ROW]
[/TABLE]
Source: https://freestatistics.org/blog/index.php?pk=121320&T=2

Globally Unique Identifier (entire table): ba.freestatistics.org/blog/index.php?pk=121320&T=2

As an alternative you can also use a QR Code:  

The GUIDs for individual cells are displayed in the table below:

Regression: S.E.(k) = alpha + beta * Mean(k)
alpha636.070263053413
beta-0.0102532382640444
S.D.0.0324564902603819
T-STAT-0.315907178557753
p-value0.756156513140967


Regression: ln S.E.(k) = alpha + beta * ln Mean(k)
alpha18.8826716884395
beta-1.2837854344835
S.D.4.67511983578548
T-STAT-0.274599471152981
p-value0.787137996663762
Lambda2.2837854344835

\begin{tabular}{lllllllll}
\hline
Regression: ln S.E.(k) = alpha + beta * ln Mean(k) \tabularnewline
alpha & 18.8826716884395 \tabularnewline
beta & -1.2837854344835 \tabularnewline
S.D. & 4.67511983578548 \tabularnewline
T-STAT & -0.274599471152981 \tabularnewline
p-value & 0.787137996663762 \tabularnewline
Lambda & 2.2837854344835 \tabularnewline
\hline
\end{tabular}
%Source: https://freestatistics.org/blog/index.php?pk=121320&T=3

[TABLE]
[ROW][C]Regression: ln S.E.(k) = alpha + beta * ln Mean(k)[/C][/ROW]
[ROW][C]alpha[/C][C]18.8826716884395[/C][/ROW]
[ROW][C]beta[/C][C]-1.2837854344835[/C][/ROW]
[ROW][C]S.D.[/C][C]4.67511983578548[/C][/ROW]
[ROW][C]T-STAT[/C][C]-0.274599471152981[/C][/ROW]
[ROW][C]p-value[/C][C]0.787137996663762[/C][/ROW]
[ROW][C]Lambda[/C][C]2.2837854344835[/C][/ROW]
[/TABLE]
Source: https://freestatistics.org/blog/index.php?pk=121320&T=3

Globally Unique Identifier (entire table): ba.freestatistics.org/blog/index.php?pk=121320&T=3

As an alternative you can also use a QR Code:  

The GUIDs for individual cells are displayed in the table below:

Regression: ln S.E.(k) = alpha + beta * ln Mean(k)
alpha18.8826716884395
beta-1.2837854344835
S.D.4.67511983578548
T-STAT-0.274599471152981
p-value0.787137996663762
Lambda2.2837854344835


Parameters (Session):
par1 = 4 ;
Parameters (R input):
par1 = 4 ;
R code (references can be found in the software module):
par1 <- as.numeric(par1)
(n <- length(x))
(np <- floor(n / par1))
arr <- array(NA,dim=c(par1,np))
j <- 0
k <- 1
for (i in 1:(np*par1))
{
j = j + 1
arr[j,k] <- x[i]
if (j == par1) {
j = 0
k=k+1
}
}
arr
arr.mean <- array(NA,dim=np)
arr.sd <- array(NA,dim=np)
arr.range <- array(NA,dim=np)
for (j in 1:np)
{
arr.mean[j] <- mean(arr[,j],na.rm=TRUE)
arr.sd[j] <- sd(arr[,j],na.rm=TRUE)
arr.range[j] <- max(arr[,j],na.rm=TRUE) - min(arr[,j],na.rm=TRUE)
}
arr.mean
arr.sd
arr.range
(lm1 <- lm(arr.sd~arr.mean))
(lnlm1 <- lm(log(arr.sd)~log(arr.mean)))
(lm2 <- lm(arr.range~arr.mean))
bitmap(file='test1.png')
plot(arr.mean,arr.sd,main='Standard Deviation-Mean Plot',xlab='mean',ylab='standard deviation')
dev.off()
bitmap(file='test2.png')
plot(arr.mean,arr.range,main='Range-Mean Plot',xlab='mean',ylab='range')
dev.off()
load(file='createtable')
a<-table.start()
a<-table.row.start(a)
a<-table.element(a,'Standard Deviation-Mean Plot',4,TRUE)
a<-table.row.end(a)
a<-table.row.start(a)
a<-table.element(a,'Section',header=TRUE)
a<-table.element(a,'Mean',header=TRUE)
a<-table.element(a,'Standard Deviation',header=TRUE)
a<-table.element(a,'Range',header=TRUE)
a<-table.row.end(a)
for (j in 1:np) {
a<-table.row.start(a)
a<-table.element(a,j,header=TRUE)
a<-table.element(a,arr.mean[j])
a<-table.element(a,arr.sd[j] )
a<-table.element(a,arr.range[j] )
a<-table.row.end(a)
}
a<-table.end(a)
table.save(a,file='mytable.tab')
a<-table.start()
a<-table.row.start(a)
a<-table.element(a,'Regression: S.E.(k) = alpha + beta * Mean(k)',2,TRUE)
a<-table.row.end(a)
a<-table.row.start(a)
a<-table.element(a,'alpha',header=TRUE)
a<-table.element(a,lm1$coefficients[[1]])
a<-table.row.end(a)
a<-table.row.start(a)
a<-table.element(a,'beta',header=TRUE)
a<-table.element(a,lm1$coefficients[[2]])
a<-table.row.end(a)
a<-table.row.start(a)
a<-table.element(a,'S.D.',header=TRUE)
a<-table.element(a,summary(lm1)$coefficients[2,2])
a<-table.row.end(a)
a<-table.row.start(a)
a<-table.element(a,'T-STAT',header=TRUE)
a<-table.element(a,summary(lm1)$coefficients[2,3])
a<-table.row.end(a)
a<-table.row.start(a)
a<-table.element(a,'p-value',header=TRUE)
a<-table.element(a,summary(lm1)$coefficients[2,4])
a<-table.row.end(a)
a<-table.end(a)
table.save(a,file='mytable1.tab')
a<-table.start()
a<-table.row.start(a)
a<-table.element(a,'Regression: ln S.E.(k) = alpha + beta * ln Mean(k)',2,TRUE)
a<-table.row.end(a)
a<-table.row.start(a)
a<-table.element(a,'alpha',header=TRUE)
a<-table.element(a,lnlm1$coefficients[[1]])
a<-table.row.end(a)
a<-table.row.start(a)
a<-table.element(a,'beta',header=TRUE)
a<-table.element(a,lnlm1$coefficients[[2]])
a<-table.row.end(a)
a<-table.row.start(a)
a<-table.element(a,'S.D.',header=TRUE)
a<-table.element(a,summary(lnlm1)$coefficients[2,2])
a<-table.row.end(a)
a<-table.row.start(a)
a<-table.element(a,'T-STAT',header=TRUE)
a<-table.element(a,summary(lnlm1)$coefficients[2,3])
a<-table.row.end(a)
a<-table.row.start(a)
a<-table.element(a,'p-value',header=TRUE)
a<-table.element(a,summary(lnlm1)$coefficients[2,4])
a<-table.row.end(a)
a<-table.row.start(a)
a<-table.element(a,'Lambda',header=TRUE)
a<-table.element(a,1-lnlm1$coefficients[[2]])
a<-table.row.end(a)
a<-table.end(a)
table.save(a,file='mytable2.tab')