Free Statistics

of Irreproducible Research!

Author's title

Author*Unverified author*
R Software Modulerwasp_smp.wasp
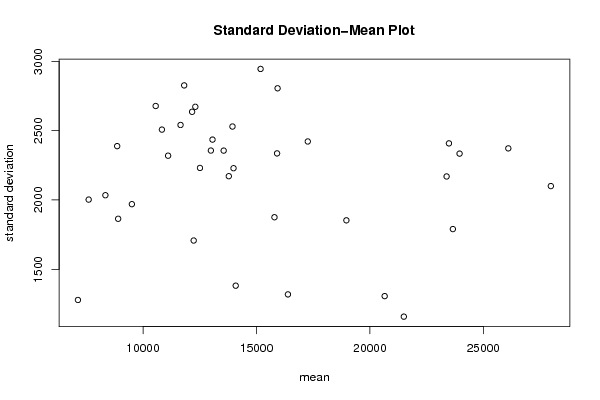
Title produced by softwareStandard Deviation-Mean Plot
Date of computationMon, 09 May 2011 15:33:00 +0000
Cite this page as followsStatistical Computations at FreeStatistics.org, Office for Research Development and Education, URL https://freestatistics.org/blog/index.php?v=date/2011/May/09/t130495503054lm2t63p0p6ps4.htm/, Retrieved Mon, 13 May 2024 22:26:27 +0000
Statistical Computations at FreeStatistics.org, Office for Research Development and Education, URL https://freestatistics.org/blog/index.php?pk=121287, Retrieved Mon, 13 May 2024 22:26:27 +0000
QR Codes:

Original text written by user:
IsPrivate?No (this computation is public)
User-defined keywordsKDGP2W83
Estimated Impact89
Family? (F = Feedback message, R = changed R code, M = changed R Module, P = changed Parameters, D = changed Data)
-       [Standard Deviation-Mean Plot] [Standard Deviatio...] [2011-05-09 15:33:00] [b6a4d57b1954500f7acfe068aef83c69] [Current]
Feedback Forum

Post a new message
Dataseries X:
7992
6114
5965
8460
8323
6333
5675
10090
9035
6976
6459
10896
9978
7466
7199
10977
9412
6341
7784
11911
10079
7721
8197
12038
11963
8033
8618
13625
11734
8895
8727
13974
12583
9525
9662
15490
13839
10047
9788
14978
13045
9489
8741
13149
14106
9998
10034
15081
13266
9997
9027
14324
13149
11209
10332
15354
13800
11786
10550
16114
13255
11403
10269
14009
15847
12967
11328
15814
18626
13219
13818
18062
15722
12111
11702
15589
14852
13612
12380
15501
16322
12157
11124
14621
14035
11159
10944
15824
14378
11816
12233
17344
16812
12181
13275
18458
17375
14609
13323
18327
16053
15070
13806
18245
17461
14999
16022
20564
16372
15854
15115
18207
19488
16644
18631
21093
22212
19762
19403
21227
23176
20823
20647
21336
23458
22003
21647
26416
25226
24723
19945
24040
25034
24885
21168
23541
26019
24657
20599
24534
28717
26138
22968
26577
28660
30430
27356
25454
30194


Summary of computational transaction
Raw Inputview raw input (R code)
Raw Outputview raw output of R engine
Computing time1 seconds
R Server'Herman Ole Andreas Wold' @ www.yougetit.org

\begin{tabular}{lllllllll}
\hline
Summary of computational transaction \tabularnewline
Raw Input & view raw input (R code)  \tabularnewline
Raw Output & view raw output of R engine  \tabularnewline
Computing time & 1 seconds \tabularnewline
R Server & 'Herman Ole Andreas Wold' @ www.yougetit.org \tabularnewline
\hline
\end{tabular}
%Source: https://freestatistics.org/blog/index.php?pk=121287&T=0

[TABLE]
[ROW][C]Summary of computational transaction[/C][/ROW]
[ROW][C]Raw Input[/C][C]view raw input (R code) [/C][/ROW]
[ROW][C]Raw Output[/C][C]view raw output of R engine [/C][/ROW]
[ROW][C]Computing time[/C][C]1 seconds[/C][/ROW]
[ROW][C]R Server[/C][C]'Herman Ole Andreas Wold' @ www.yougetit.org[/C][/ROW]
[/TABLE]
Source: https://freestatistics.org/blog/index.php?pk=121287&T=0

Globally Unique Identifier (entire table): ba.freestatistics.org/blog/index.php?pk=121287&T=0

As an alternative you can also use a QR Code:  

The GUIDs for individual cells are displayed in the table below:

Summary of computational transaction
Raw Inputview raw input (R code)
Raw Outputview raw output of R engine
Computing time1 seconds
R Server'Herman Ole Andreas Wold' @ www.yougetit.org


Standard Deviation-Mean Plot
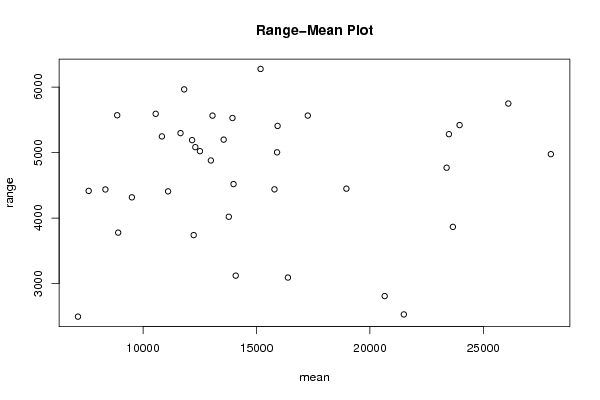
SectionMeanStandard DeviationRange
17132.751278.201177436482495
27605.252002.800768091194415
38341.52034.273744279934437
489051864.195089933813778
588622388.613684406365570
69508.751969.689379064634317
710559.752678.290919597795592
810832.52507.904902503285247
9118152826.951125623985965
10121632636.366312433335190
11111062319.58933146944408
1212304.752672.668251641675083
1311653.52541.274024316675297
14125112231.063871788525022
1513062.52435.683819108445564
16122341707.322660385753740
17139892229.21465991954519
1815931.252806.177634553215407
19137812171.59588014594020
2014086.251381.314923059433121
21135562356.325246367035198
2212990.52356.710772807454880
2313942.752530.102418875575528
2415181.52945.715815666326277
2515908.52336.184567480355004
2615793.51875.348945307694439
2717261.52422.228519359815565
28163871318.420519662323092
29189641852.971127675774449
30206511305.925214806222809
3121495.51157.832601602382529
32233812169.699979259814769
3323483.52408.550117117495281
34236571790.036312480843866
3523952.252334.583956511315420
36261002372.557410615535749
37279752100.385044065334976

\begin{tabular}{lllllllll}
\hline
Standard Deviation-Mean Plot \tabularnewline
Section & Mean & Standard Deviation & Range \tabularnewline
1 & 7132.75 & 1278.20117743648 & 2495 \tabularnewline
2 & 7605.25 & 2002.80076809119 & 4415 \tabularnewline
3 & 8341.5 & 2034.27374427993 & 4437 \tabularnewline
4 & 8905 & 1864.19508993381 & 3778 \tabularnewline
5 & 8862 & 2388.61368440636 & 5570 \tabularnewline
6 & 9508.75 & 1969.68937906463 & 4317 \tabularnewline
7 & 10559.75 & 2678.29091959779 & 5592 \tabularnewline
8 & 10832.5 & 2507.90490250328 & 5247 \tabularnewline
9 & 11815 & 2826.95112562398 & 5965 \tabularnewline
10 & 12163 & 2636.36631243333 & 5190 \tabularnewline
11 & 11106 & 2319.5893314694 & 4408 \tabularnewline
12 & 12304.75 & 2672.66825164167 & 5083 \tabularnewline
13 & 11653.5 & 2541.27402431667 & 5297 \tabularnewline
14 & 12511 & 2231.06387178852 & 5022 \tabularnewline
15 & 13062.5 & 2435.68381910844 & 5564 \tabularnewline
16 & 12234 & 1707.32266038575 & 3740 \tabularnewline
17 & 13989 & 2229.2146599195 & 4519 \tabularnewline
18 & 15931.25 & 2806.17763455321 & 5407 \tabularnewline
19 & 13781 & 2171.5958801459 & 4020 \tabularnewline
20 & 14086.25 & 1381.31492305943 & 3121 \tabularnewline
21 & 13556 & 2356.32524636703 & 5198 \tabularnewline
22 & 12990.5 & 2356.71077280745 & 4880 \tabularnewline
23 & 13942.75 & 2530.10241887557 & 5528 \tabularnewline
24 & 15181.5 & 2945.71581566632 & 6277 \tabularnewline
25 & 15908.5 & 2336.18456748035 & 5004 \tabularnewline
26 & 15793.5 & 1875.34894530769 & 4439 \tabularnewline
27 & 17261.5 & 2422.22851935981 & 5565 \tabularnewline
28 & 16387 & 1318.42051966232 & 3092 \tabularnewline
29 & 18964 & 1852.97112767577 & 4449 \tabularnewline
30 & 20651 & 1305.92521480622 & 2809 \tabularnewline
31 & 21495.5 & 1157.83260160238 & 2529 \tabularnewline
32 & 23381 & 2169.69997925981 & 4769 \tabularnewline
33 & 23483.5 & 2408.55011711749 & 5281 \tabularnewline
34 & 23657 & 1790.03631248084 & 3866 \tabularnewline
35 & 23952.25 & 2334.58395651131 & 5420 \tabularnewline
36 & 26100 & 2372.55741061553 & 5749 \tabularnewline
37 & 27975 & 2100.38504406533 & 4976 \tabularnewline
\hline
\end{tabular}
%Source: https://freestatistics.org/blog/index.php?pk=121287&T=1

[TABLE]
[ROW][C]Standard Deviation-Mean Plot[/C][/ROW]
[ROW][C]Section[/C][C]Mean[/C][C]Standard Deviation[/C][C]Range[/C][/ROW]
[ROW][C]1[/C][C]7132.75[/C][C]1278.20117743648[/C][C]2495[/C][/ROW]
[ROW][C]2[/C][C]7605.25[/C][C]2002.80076809119[/C][C]4415[/C][/ROW]
[ROW][C]3[/C][C]8341.5[/C][C]2034.27374427993[/C][C]4437[/C][/ROW]
[ROW][C]4[/C][C]8905[/C][C]1864.19508993381[/C][C]3778[/C][/ROW]
[ROW][C]5[/C][C]8862[/C][C]2388.61368440636[/C][C]5570[/C][/ROW]
[ROW][C]6[/C][C]9508.75[/C][C]1969.68937906463[/C][C]4317[/C][/ROW]
[ROW][C]7[/C][C]10559.75[/C][C]2678.29091959779[/C][C]5592[/C][/ROW]
[ROW][C]8[/C][C]10832.5[/C][C]2507.90490250328[/C][C]5247[/C][/ROW]
[ROW][C]9[/C][C]11815[/C][C]2826.95112562398[/C][C]5965[/C][/ROW]
[ROW][C]10[/C][C]12163[/C][C]2636.36631243333[/C][C]5190[/C][/ROW]
[ROW][C]11[/C][C]11106[/C][C]2319.5893314694[/C][C]4408[/C][/ROW]
[ROW][C]12[/C][C]12304.75[/C][C]2672.66825164167[/C][C]5083[/C][/ROW]
[ROW][C]13[/C][C]11653.5[/C][C]2541.27402431667[/C][C]5297[/C][/ROW]
[ROW][C]14[/C][C]12511[/C][C]2231.06387178852[/C][C]5022[/C][/ROW]
[ROW][C]15[/C][C]13062.5[/C][C]2435.68381910844[/C][C]5564[/C][/ROW]
[ROW][C]16[/C][C]12234[/C][C]1707.32266038575[/C][C]3740[/C][/ROW]
[ROW][C]17[/C][C]13989[/C][C]2229.2146599195[/C][C]4519[/C][/ROW]
[ROW][C]18[/C][C]15931.25[/C][C]2806.17763455321[/C][C]5407[/C][/ROW]
[ROW][C]19[/C][C]13781[/C][C]2171.5958801459[/C][C]4020[/C][/ROW]
[ROW][C]20[/C][C]14086.25[/C][C]1381.31492305943[/C][C]3121[/C][/ROW]
[ROW][C]21[/C][C]13556[/C][C]2356.32524636703[/C][C]5198[/C][/ROW]
[ROW][C]22[/C][C]12990.5[/C][C]2356.71077280745[/C][C]4880[/C][/ROW]
[ROW][C]23[/C][C]13942.75[/C][C]2530.10241887557[/C][C]5528[/C][/ROW]
[ROW][C]24[/C][C]15181.5[/C][C]2945.71581566632[/C][C]6277[/C][/ROW]
[ROW][C]25[/C][C]15908.5[/C][C]2336.18456748035[/C][C]5004[/C][/ROW]
[ROW][C]26[/C][C]15793.5[/C][C]1875.34894530769[/C][C]4439[/C][/ROW]
[ROW][C]27[/C][C]17261.5[/C][C]2422.22851935981[/C][C]5565[/C][/ROW]
[ROW][C]28[/C][C]16387[/C][C]1318.42051966232[/C][C]3092[/C][/ROW]
[ROW][C]29[/C][C]18964[/C][C]1852.97112767577[/C][C]4449[/C][/ROW]
[ROW][C]30[/C][C]20651[/C][C]1305.92521480622[/C][C]2809[/C][/ROW]
[ROW][C]31[/C][C]21495.5[/C][C]1157.83260160238[/C][C]2529[/C][/ROW]
[ROW][C]32[/C][C]23381[/C][C]2169.69997925981[/C][C]4769[/C][/ROW]
[ROW][C]33[/C][C]23483.5[/C][C]2408.55011711749[/C][C]5281[/C][/ROW]
[ROW][C]34[/C][C]23657[/C][C]1790.03631248084[/C][C]3866[/C][/ROW]
[ROW][C]35[/C][C]23952.25[/C][C]2334.58395651131[/C][C]5420[/C][/ROW]
[ROW][C]36[/C][C]26100[/C][C]2372.55741061553[/C][C]5749[/C][/ROW]
[ROW][C]37[/C][C]27975[/C][C]2100.38504406533[/C][C]4976[/C][/ROW]
[/TABLE]
Source: https://freestatistics.org/blog/index.php?pk=121287&T=1

Globally Unique Identifier (entire table): ba.freestatistics.org/blog/index.php?pk=121287&T=1

As an alternative you can also use a QR Code:  

The GUIDs for individual cells are displayed in the table below:

Standard Deviation-Mean Plot
SectionMeanStandard DeviationRange
17132.751278.201177436482495
27605.252002.800768091194415
38341.52034.273744279934437
489051864.195089933813778
588622388.613684406365570
69508.751969.689379064634317
710559.752678.290919597795592
810832.52507.904902503285247
9118152826.951125623985965
10121632636.366312433335190
11111062319.58933146944408
1212304.752672.668251641675083
1311653.52541.274024316675297
14125112231.063871788525022
1513062.52435.683819108445564
16122341707.322660385753740
17139892229.21465991954519
1815931.252806.177634553215407
19137812171.59588014594020
2014086.251381.314923059433121
21135562356.325246367035198
2212990.52356.710772807454880
2313942.752530.102418875575528
2415181.52945.715815666326277
2515908.52336.184567480355004
2615793.51875.348945307694439
2717261.52422.228519359815565
28163871318.420519662323092
29189641852.971127675774449
30206511305.925214806222809
3121495.51157.832601602382529
32233812169.699979259814769
3323483.52408.550117117495281
34236571790.036312480843866
3523952.252334.583956511315420
36261002372.557410615535749
37279752100.385044065334976


Regression: S.E.(k) = alpha + beta * Mean(k)
alpha2316.38111622882
beta-0.00967450504415018
S.D.0.014169885072934
T-STAT-0.682751129903625
p-value0.499258589419991

\begin{tabular}{lllllllll}
\hline
Regression: S.E.(k) = alpha + beta * Mean(k) \tabularnewline
alpha & 2316.38111622882 \tabularnewline
beta & -0.00967450504415018 \tabularnewline
S.D. & 0.014169885072934 \tabularnewline
T-STAT & -0.682751129903625 \tabularnewline
p-value & 0.499258589419991 \tabularnewline
\hline
\end{tabular}
%Source: https://freestatistics.org/blog/index.php?pk=121287&T=2

[TABLE]
[ROW][C]Regression: S.E.(k) = alpha + beta * Mean(k)[/C][/ROW]
[ROW][C]alpha[/C][C]2316.38111622882[/C][/ROW]
[ROW][C]beta[/C][C]-0.00967450504415018[/C][/ROW]
[ROW][C]S.D.[/C][C]0.014169885072934[/C][/ROW]
[ROW][C]T-STAT[/C][C]-0.682751129903625[/C][/ROW]
[ROW][C]p-value[/C][C]0.499258589419991[/C][/ROW]
[/TABLE]
Source: https://freestatistics.org/blog/index.php?pk=121287&T=2

Globally Unique Identifier (entire table): ba.freestatistics.org/blog/index.php?pk=121287&T=2

As an alternative you can also use a QR Code:  

The GUIDs for individual cells are displayed in the table below:

Regression: S.E.(k) = alpha + beta * Mean(k)
alpha2316.38111622882
beta-0.00967450504415018
S.D.0.014169885072934
T-STAT-0.682751129903625
p-value0.499258589419991


Regression: ln S.E.(k) = alpha + beta * ln Mean(k)
alpha8.11117671175802
beta-0.0474858791962382
S.D.0.113865965960912
T-STAT-0.417033121315103
p-value0.679201083720846
Lambda1.04748587919624

\begin{tabular}{lllllllll}
\hline
Regression: ln S.E.(k) = alpha + beta * ln Mean(k) \tabularnewline
alpha & 8.11117671175802 \tabularnewline
beta & -0.0474858791962382 \tabularnewline
S.D. & 0.113865965960912 \tabularnewline
T-STAT & -0.417033121315103 \tabularnewline
p-value & 0.679201083720846 \tabularnewline
Lambda & 1.04748587919624 \tabularnewline
\hline
\end{tabular}
%Source: https://freestatistics.org/blog/index.php?pk=121287&T=3

[TABLE]
[ROW][C]Regression: ln S.E.(k) = alpha + beta * ln Mean(k)[/C][/ROW]
[ROW][C]alpha[/C][C]8.11117671175802[/C][/ROW]
[ROW][C]beta[/C][C]-0.0474858791962382[/C][/ROW]
[ROW][C]S.D.[/C][C]0.113865965960912[/C][/ROW]
[ROW][C]T-STAT[/C][C]-0.417033121315103[/C][/ROW]
[ROW][C]p-value[/C][C]0.679201083720846[/C][/ROW]
[ROW][C]Lambda[/C][C]1.04748587919624[/C][/ROW]
[/TABLE]
Source: https://freestatistics.org/blog/index.php?pk=121287&T=3

Globally Unique Identifier (entire table): ba.freestatistics.org/blog/index.php?pk=121287&T=3

As an alternative you can also use a QR Code:  

The GUIDs for individual cells are displayed in the table below:

Regression: ln S.E.(k) = alpha + beta * ln Mean(k)
alpha8.11117671175802
beta-0.0474858791962382
S.D.0.113865965960912
T-STAT-0.417033121315103
p-value0.679201083720846
Lambda1.04748587919624


Parameters (Session):
par1 = 4 ;
Parameters (R input):
par1 = 4 ;
R code (references can be found in the software module):
par1 <- as.numeric(par1)
(n <- length(x))
(np <- floor(n / par1))
arr <- array(NA,dim=c(par1,np))
j <- 0
k <- 1
for (i in 1:(np*par1))
{
j = j + 1
arr[j,k] <- x[i]
if (j == par1) {
j = 0
k=k+1
}
}
arr
arr.mean <- array(NA,dim=np)
arr.sd <- array(NA,dim=np)
arr.range <- array(NA,dim=np)
for (j in 1:np)
{
arr.mean[j] <- mean(arr[,j],na.rm=TRUE)
arr.sd[j] <- sd(arr[,j],na.rm=TRUE)
arr.range[j] <- max(arr[,j],na.rm=TRUE) - min(arr[,j],na.rm=TRUE)
}
arr.mean
arr.sd
arr.range
(lm1 <- lm(arr.sd~arr.mean))
(lnlm1 <- lm(log(arr.sd)~log(arr.mean)))
(lm2 <- lm(arr.range~arr.mean))
bitmap(file='test1.png')
plot(arr.mean,arr.sd,main='Standard Deviation-Mean Plot',xlab='mean',ylab='standard deviation')
dev.off()
bitmap(file='test2.png')
plot(arr.mean,arr.range,main='Range-Mean Plot',xlab='mean',ylab='range')
dev.off()
load(file='createtable')
a<-table.start()
a<-table.row.start(a)
a<-table.element(a,'Standard Deviation-Mean Plot',4,TRUE)
a<-table.row.end(a)
a<-table.row.start(a)
a<-table.element(a,'Section',header=TRUE)
a<-table.element(a,'Mean',header=TRUE)
a<-table.element(a,'Standard Deviation',header=TRUE)
a<-table.element(a,'Range',header=TRUE)
a<-table.row.end(a)
for (j in 1:np) {
a<-table.row.start(a)
a<-table.element(a,j,header=TRUE)
a<-table.element(a,arr.mean[j])
a<-table.element(a,arr.sd[j] )
a<-table.element(a,arr.range[j] )
a<-table.row.end(a)
}
a<-table.end(a)
table.save(a,file='mytable.tab')
a<-table.start()
a<-table.row.start(a)
a<-table.element(a,'Regression: S.E.(k) = alpha + beta * Mean(k)',2,TRUE)
a<-table.row.end(a)
a<-table.row.start(a)
a<-table.element(a,'alpha',header=TRUE)
a<-table.element(a,lm1$coefficients[[1]])
a<-table.row.end(a)
a<-table.row.start(a)
a<-table.element(a,'beta',header=TRUE)
a<-table.element(a,lm1$coefficients[[2]])
a<-table.row.end(a)
a<-table.row.start(a)
a<-table.element(a,'S.D.',header=TRUE)
a<-table.element(a,summary(lm1)$coefficients[2,2])
a<-table.row.end(a)
a<-table.row.start(a)
a<-table.element(a,'T-STAT',header=TRUE)
a<-table.element(a,summary(lm1)$coefficients[2,3])
a<-table.row.end(a)
a<-table.row.start(a)
a<-table.element(a,'p-value',header=TRUE)
a<-table.element(a,summary(lm1)$coefficients[2,4])
a<-table.row.end(a)
a<-table.end(a)
table.save(a,file='mytable1.tab')
a<-table.start()
a<-table.row.start(a)
a<-table.element(a,'Regression: ln S.E.(k) = alpha + beta * ln Mean(k)',2,TRUE)
a<-table.row.end(a)
a<-table.row.start(a)
a<-table.element(a,'alpha',header=TRUE)
a<-table.element(a,lnlm1$coefficients[[1]])
a<-table.row.end(a)
a<-table.row.start(a)
a<-table.element(a,'beta',header=TRUE)
a<-table.element(a,lnlm1$coefficients[[2]])
a<-table.row.end(a)
a<-table.row.start(a)
a<-table.element(a,'S.D.',header=TRUE)
a<-table.element(a,summary(lnlm1)$coefficients[2,2])
a<-table.row.end(a)
a<-table.row.start(a)
a<-table.element(a,'T-STAT',header=TRUE)
a<-table.element(a,summary(lnlm1)$coefficients[2,3])
a<-table.row.end(a)
a<-table.row.start(a)
a<-table.element(a,'p-value',header=TRUE)
a<-table.element(a,summary(lnlm1)$coefficients[2,4])
a<-table.row.end(a)
a<-table.row.start(a)
a<-table.element(a,'Lambda',header=TRUE)
a<-table.element(a,1-lnlm1$coefficients[[2]])
a<-table.row.end(a)
a<-table.end(a)
table.save(a,file='mytable2.tab')