Free Statistics

of Irreproducible Research!

Author's title

Author*Unverified author*
R Software Modulerwasp_autocorrelation.wasp
Title produced by software(Partial) Autocorrelation Function
Date of computationMon, 09 May 2011 14:43:27 +0000
Cite this page as followsStatistical Computations at FreeStatistics.org, Office for Research Development and Education, URL https://freestatistics.org/blog/index.php?v=date/2011/May/09/t1304952021k25hctj45cymdl1.htm/, Retrieved Tue, 14 May 2024 15:29:56 +0000
Statistical Computations at FreeStatistics.org, Office for Research Development and Education, URL https://freestatistics.org/blog/index.php?pk=121279, Retrieved Tue, 14 May 2024 15:29:56 +0000
QR Codes:

Original text written by user:
IsPrivate?No (this computation is public)
User-defined keywordsKDGP2W12
Estimated Impact97
Family? (F = Feedback message, R = changed R code, M = changed R Module, P = changed Parameters, D = changed Data)
-       [(Partial) Autocorrelation Function] [Opgave 6 BIS: Eig...] [2011-05-09 14:43:27] [4bded9ec08f78e1ece38a218e29ff7d2] [Current]
Feedback Forum

Post a new message
Dataseries X:
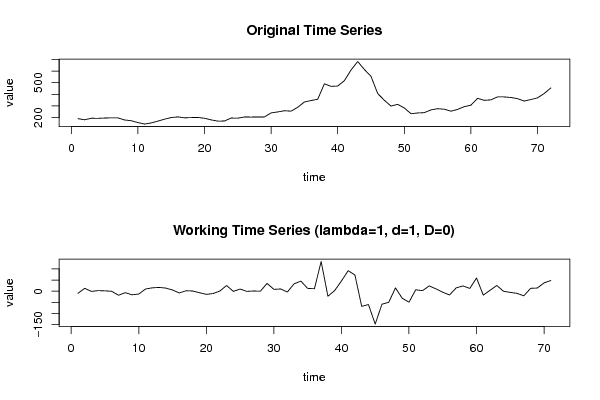
190.2
180.7
193.6
192.8
195.5
197.2
196.9
178.9
172.4
156.4
143.7
153.6
168.8
185.8
199.9
205.4
197.5
199.6
200.5
193.7
179.6
169.1
169.8
195.5
194.8
204.5
203.8
204.8
204.9
240
248.3
258.4
254.9
288.3
333.6
346.3
357.5
490.7
468.2
471.2
517.1
609.2
682
614
554.2
406.8
348.6
298.8
313.7
282.1
232.9
239.3
241.9
265.7
276
271.5
254.6
269.9
293.5
306.1
365.4
347.9
352.1
377.9
377.4
372.2
362.5
341.9
354.8
369.2
406.7
454.7


Summary of computational transaction
Raw Inputview raw input (R code)
Raw Outputview raw output of R engine
Computing time2 seconds
R Server'Sir Ronald Aylmer Fisher' @ 193.190.124.24

\begin{tabular}{lllllllll}
\hline
Summary of computational transaction \tabularnewline
Raw Input & view raw input (R code)  \tabularnewline
Raw Output & view raw output of R engine  \tabularnewline
Computing time & 2 seconds \tabularnewline
R Server & 'Sir Ronald Aylmer Fisher' @ 193.190.124.24 \tabularnewline
\hline
\end{tabular}
%Source: https://freestatistics.org/blog/index.php?pk=121279&T=0

[TABLE]
[ROW][C]Summary of computational transaction[/C][/ROW]
[ROW][C]Raw Input[/C][C]view raw input (R code) [/C][/ROW]
[ROW][C]Raw Output[/C][C]view raw output of R engine [/C][/ROW]
[ROW][C]Computing time[/C][C]2 seconds[/C][/ROW]
[ROW][C]R Server[/C][C]'Sir Ronald Aylmer Fisher' @ 193.190.124.24[/C][/ROW]
[/TABLE]
Source: https://freestatistics.org/blog/index.php?pk=121279&T=0

Globally Unique Identifier (entire table): ba.freestatistics.org/blog/index.php?pk=121279&T=0

As an alternative you can also use a QR Code:  

The GUIDs for individual cells are displayed in the table below:

Summary of computational transaction
Raw Inputview raw input (R code)
Raw Outputview raw output of R engine
Computing time2 seconds
R Server'Sir Ronald Aylmer Fisher' @ 193.190.124.24


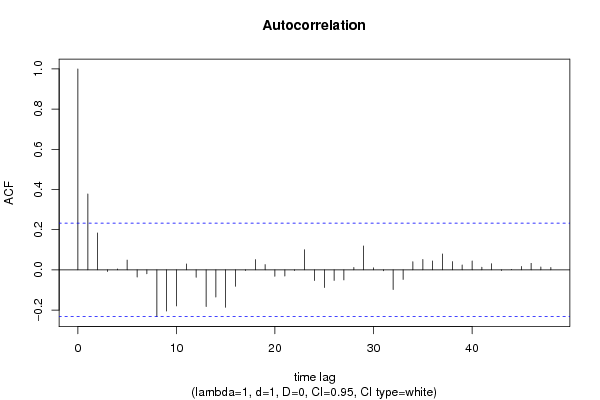
Autocorrelation Function
Time lag kACF(k)T-STATP-value
10.3773653.17970.001093
20.18371.54790.063048
3-0.008695-0.07330.470901
40.0045320.03820.484823
50.0485190.40880.341947
6-0.035893-0.30240.381602
7-0.019928-0.16790.433563
8-0.233139-1.96450.026696
9-0.205224-1.72930.044055
10-0.179614-1.51350.067302
110.0294420.24810.402393
12-0.037082-0.31250.377803
13-0.182453-1.53740.064324
14-0.135864-1.14480.128067
15-0.186314-1.56990.060441
16-0.081832-0.68950.24637
17-0.003686-0.03110.487655
180.0509060.42890.334634
190.0260820.21980.413339
20-0.032401-0.2730.392818
21-0.030466-0.25670.399072
22-0.003636-0.03060.487824
230.1005050.84690.199957
24-0.053509-0.45090.326728
25-0.088318-0.74420.229611
26-0.052838-0.44520.328758
27-0.050064-0.42180.337206
280.0112430.09470.462396
290.1187561.00070.160196
300.0098050.08260.467194
31-0.005009-0.04220.483227
32-0.098151-0.8270.205494
33-0.047717-0.40210.34442
340.0403880.34030.367312
350.0511210.43080.333975
360.0443250.37350.35495
370.0791750.66710.253423
380.0408690.34440.365792
390.0239910.20220.420188
400.0441240.37180.355575
410.0133050.11210.455527
420.0302640.2550.399728
43-0.003559-0.030.488079
440.0010870.00920.49636
450.0164370.13850.445118
460.0321780.27110.393538
470.0144140.12150.451839
480.0120690.10170.459644

\begin{tabular}{lllllllll}
\hline
Autocorrelation Function \tabularnewline
Time lag k & ACF(k) & T-STAT & P-value \tabularnewline
1 & 0.377365 & 3.1797 & 0.001093 \tabularnewline
2 & 0.1837 & 1.5479 & 0.063048 \tabularnewline
3 & -0.008695 & -0.0733 & 0.470901 \tabularnewline
4 & 0.004532 & 0.0382 & 0.484823 \tabularnewline
5 & 0.048519 & 0.4088 & 0.341947 \tabularnewline
6 & -0.035893 & -0.3024 & 0.381602 \tabularnewline
7 & -0.019928 & -0.1679 & 0.433563 \tabularnewline
8 & -0.233139 & -1.9645 & 0.026696 \tabularnewline
9 & -0.205224 & -1.7293 & 0.044055 \tabularnewline
10 & -0.179614 & -1.5135 & 0.067302 \tabularnewline
11 & 0.029442 & 0.2481 & 0.402393 \tabularnewline
12 & -0.037082 & -0.3125 & 0.377803 \tabularnewline
13 & -0.182453 & -1.5374 & 0.064324 \tabularnewline
14 & -0.135864 & -1.1448 & 0.128067 \tabularnewline
15 & -0.186314 & -1.5699 & 0.060441 \tabularnewline
16 & -0.081832 & -0.6895 & 0.24637 \tabularnewline
17 & -0.003686 & -0.0311 & 0.487655 \tabularnewline
18 & 0.050906 & 0.4289 & 0.334634 \tabularnewline
19 & 0.026082 & 0.2198 & 0.413339 \tabularnewline
20 & -0.032401 & -0.273 & 0.392818 \tabularnewline
21 & -0.030466 & -0.2567 & 0.399072 \tabularnewline
22 & -0.003636 & -0.0306 & 0.487824 \tabularnewline
23 & 0.100505 & 0.8469 & 0.199957 \tabularnewline
24 & -0.053509 & -0.4509 & 0.326728 \tabularnewline
25 & -0.088318 & -0.7442 & 0.229611 \tabularnewline
26 & -0.052838 & -0.4452 & 0.328758 \tabularnewline
27 & -0.050064 & -0.4218 & 0.337206 \tabularnewline
28 & 0.011243 & 0.0947 & 0.462396 \tabularnewline
29 & 0.118756 & 1.0007 & 0.160196 \tabularnewline
30 & 0.009805 & 0.0826 & 0.467194 \tabularnewline
31 & -0.005009 & -0.0422 & 0.483227 \tabularnewline
32 & -0.098151 & -0.827 & 0.205494 \tabularnewline
33 & -0.047717 & -0.4021 & 0.34442 \tabularnewline
34 & 0.040388 & 0.3403 & 0.367312 \tabularnewline
35 & 0.051121 & 0.4308 & 0.333975 \tabularnewline
36 & 0.044325 & 0.3735 & 0.35495 \tabularnewline
37 & 0.079175 & 0.6671 & 0.253423 \tabularnewline
38 & 0.040869 & 0.3444 & 0.365792 \tabularnewline
39 & 0.023991 & 0.2022 & 0.420188 \tabularnewline
40 & 0.044124 & 0.3718 & 0.355575 \tabularnewline
41 & 0.013305 & 0.1121 & 0.455527 \tabularnewline
42 & 0.030264 & 0.255 & 0.399728 \tabularnewline
43 & -0.003559 & -0.03 & 0.488079 \tabularnewline
44 & 0.001087 & 0.0092 & 0.49636 \tabularnewline
45 & 0.016437 & 0.1385 & 0.445118 \tabularnewline
46 & 0.032178 & 0.2711 & 0.393538 \tabularnewline
47 & 0.014414 & 0.1215 & 0.451839 \tabularnewline
48 & 0.012069 & 0.1017 & 0.459644 \tabularnewline
\hline
\end{tabular}
%Source: https://freestatistics.org/blog/index.php?pk=121279&T=1

[TABLE]
[ROW][C]Autocorrelation Function[/C][/ROW]
[ROW][C]Time lag k[/C][C]ACF(k)[/C][C]T-STAT[/C][C]P-value[/C][/ROW]
[ROW][C]1[/C][C]0.377365[/C][C]3.1797[/C][C]0.001093[/C][/ROW]
[ROW][C]2[/C][C]0.1837[/C][C]1.5479[/C][C]0.063048[/C][/ROW]
[ROW][C]3[/C][C]-0.008695[/C][C]-0.0733[/C][C]0.470901[/C][/ROW]
[ROW][C]4[/C][C]0.004532[/C][C]0.0382[/C][C]0.484823[/C][/ROW]
[ROW][C]5[/C][C]0.048519[/C][C]0.4088[/C][C]0.341947[/C][/ROW]
[ROW][C]6[/C][C]-0.035893[/C][C]-0.3024[/C][C]0.381602[/C][/ROW]
[ROW][C]7[/C][C]-0.019928[/C][C]-0.1679[/C][C]0.433563[/C][/ROW]
[ROW][C]8[/C][C]-0.233139[/C][C]-1.9645[/C][C]0.026696[/C][/ROW]
[ROW][C]9[/C][C]-0.205224[/C][C]-1.7293[/C][C]0.044055[/C][/ROW]
[ROW][C]10[/C][C]-0.179614[/C][C]-1.5135[/C][C]0.067302[/C][/ROW]
[ROW][C]11[/C][C]0.029442[/C][C]0.2481[/C][C]0.402393[/C][/ROW]
[ROW][C]12[/C][C]-0.037082[/C][C]-0.3125[/C][C]0.377803[/C][/ROW]
[ROW][C]13[/C][C]-0.182453[/C][C]-1.5374[/C][C]0.064324[/C][/ROW]
[ROW][C]14[/C][C]-0.135864[/C][C]-1.1448[/C][C]0.128067[/C][/ROW]
[ROW][C]15[/C][C]-0.186314[/C][C]-1.5699[/C][C]0.060441[/C][/ROW]
[ROW][C]16[/C][C]-0.081832[/C][C]-0.6895[/C][C]0.24637[/C][/ROW]
[ROW][C]17[/C][C]-0.003686[/C][C]-0.0311[/C][C]0.487655[/C][/ROW]
[ROW][C]18[/C][C]0.050906[/C][C]0.4289[/C][C]0.334634[/C][/ROW]
[ROW][C]19[/C][C]0.026082[/C][C]0.2198[/C][C]0.413339[/C][/ROW]
[ROW][C]20[/C][C]-0.032401[/C][C]-0.273[/C][C]0.392818[/C][/ROW]
[ROW][C]21[/C][C]-0.030466[/C][C]-0.2567[/C][C]0.399072[/C][/ROW]
[ROW][C]22[/C][C]-0.003636[/C][C]-0.0306[/C][C]0.487824[/C][/ROW]
[ROW][C]23[/C][C]0.100505[/C][C]0.8469[/C][C]0.199957[/C][/ROW]
[ROW][C]24[/C][C]-0.053509[/C][C]-0.4509[/C][C]0.326728[/C][/ROW]
[ROW][C]25[/C][C]-0.088318[/C][C]-0.7442[/C][C]0.229611[/C][/ROW]
[ROW][C]26[/C][C]-0.052838[/C][C]-0.4452[/C][C]0.328758[/C][/ROW]
[ROW][C]27[/C][C]-0.050064[/C][C]-0.4218[/C][C]0.337206[/C][/ROW]
[ROW][C]28[/C][C]0.011243[/C][C]0.0947[/C][C]0.462396[/C][/ROW]
[ROW][C]29[/C][C]0.118756[/C][C]1.0007[/C][C]0.160196[/C][/ROW]
[ROW][C]30[/C][C]0.009805[/C][C]0.0826[/C][C]0.467194[/C][/ROW]
[ROW][C]31[/C][C]-0.005009[/C][C]-0.0422[/C][C]0.483227[/C][/ROW]
[ROW][C]32[/C][C]-0.098151[/C][C]-0.827[/C][C]0.205494[/C][/ROW]
[ROW][C]33[/C][C]-0.047717[/C][C]-0.4021[/C][C]0.34442[/C][/ROW]
[ROW][C]34[/C][C]0.040388[/C][C]0.3403[/C][C]0.367312[/C][/ROW]
[ROW][C]35[/C][C]0.051121[/C][C]0.4308[/C][C]0.333975[/C][/ROW]
[ROW][C]36[/C][C]0.044325[/C][C]0.3735[/C][C]0.35495[/C][/ROW]
[ROW][C]37[/C][C]0.079175[/C][C]0.6671[/C][C]0.253423[/C][/ROW]
[ROW][C]38[/C][C]0.040869[/C][C]0.3444[/C][C]0.365792[/C][/ROW]
[ROW][C]39[/C][C]0.023991[/C][C]0.2022[/C][C]0.420188[/C][/ROW]
[ROW][C]40[/C][C]0.044124[/C][C]0.3718[/C][C]0.355575[/C][/ROW]
[ROW][C]41[/C][C]0.013305[/C][C]0.1121[/C][C]0.455527[/C][/ROW]
[ROW][C]42[/C][C]0.030264[/C][C]0.255[/C][C]0.399728[/C][/ROW]
[ROW][C]43[/C][C]-0.003559[/C][C]-0.03[/C][C]0.488079[/C][/ROW]
[ROW][C]44[/C][C]0.001087[/C][C]0.0092[/C][C]0.49636[/C][/ROW]
[ROW][C]45[/C][C]0.016437[/C][C]0.1385[/C][C]0.445118[/C][/ROW]
[ROW][C]46[/C][C]0.032178[/C][C]0.2711[/C][C]0.393538[/C][/ROW]
[ROW][C]47[/C][C]0.014414[/C][C]0.1215[/C][C]0.451839[/C][/ROW]
[ROW][C]48[/C][C]0.012069[/C][C]0.1017[/C][C]0.459644[/C][/ROW]
[/TABLE]
Source: https://freestatistics.org/blog/index.php?pk=121279&T=1

Globally Unique Identifier (entire table): ba.freestatistics.org/blog/index.php?pk=121279&T=1

As an alternative you can also use a QR Code:  

The GUIDs for individual cells are displayed in the table below:

Autocorrelation Function
Time lag kACF(k)T-STATP-value
10.3773653.17970.001093
20.18371.54790.063048
3-0.008695-0.07330.470901
40.0045320.03820.484823
50.0485190.40880.341947
6-0.035893-0.30240.381602
7-0.019928-0.16790.433563
8-0.233139-1.96450.026696
9-0.205224-1.72930.044055
10-0.179614-1.51350.067302
110.0294420.24810.402393
12-0.037082-0.31250.377803
13-0.182453-1.53740.064324
14-0.135864-1.14480.128067
15-0.186314-1.56990.060441
16-0.081832-0.68950.24637
17-0.003686-0.03110.487655
180.0509060.42890.334634
190.0260820.21980.413339
20-0.032401-0.2730.392818
21-0.030466-0.25670.399072
22-0.003636-0.03060.487824
230.1005050.84690.199957
24-0.053509-0.45090.326728
25-0.088318-0.74420.229611
26-0.052838-0.44520.328758
27-0.050064-0.42180.337206
280.0112430.09470.462396
290.1187561.00070.160196
300.0098050.08260.467194
31-0.005009-0.04220.483227
32-0.098151-0.8270.205494
33-0.047717-0.40210.34442
340.0403880.34030.367312
350.0511210.43080.333975
360.0443250.37350.35495
370.0791750.66710.253423
380.0408690.34440.365792
390.0239910.20220.420188
400.0441240.37180.355575
410.0133050.11210.455527
420.0302640.2550.399728
43-0.003559-0.030.488079
440.0010870.00920.49636
450.0164370.13850.445118
460.0321780.27110.393538
470.0144140.12150.451839
480.0120690.10170.459644


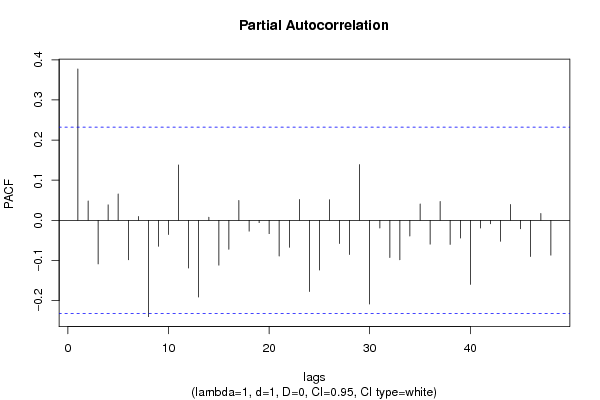
Partial Autocorrelation Function
Time lag kPACF(k)T-STATP-value
10.3773653.17970.001093
20.0481530.40570.343076
3-0.108519-0.91440.181802
40.0386090.32530.372945
50.0657690.55420.290598
6-0.098311-0.82840.205115
70.009810.08270.467179
8-0.239969-2.0220.023472
9-0.064548-0.54390.294111
10-0.035326-0.29770.383414
110.1381491.16410.124147
12-0.119018-1.00290.159666
13-0.191081-1.61010.055909
140.0079550.0670.473374
15-0.111661-0.94090.174981
16-0.072171-0.60810.272523
170.0495580.41760.338755
18-0.026962-0.22720.410467
19-0.005727-0.04830.480825
20-0.033097-0.27890.390574
21-0.089014-0.750.227853
22-0.067216-0.56640.286465
230.0521550.43950.33083
24-0.177388-1.49470.069712
25-0.123769-1.04290.150268
260.0516750.43540.332289
27-0.057867-0.48760.313669
28-0.085336-0.71910.237233
290.1390141.17130.122687
30-0.208655-1.75820.041515
31-0.019288-0.16250.435677
32-0.092472-0.77920.219231
33-0.098379-0.8290.204953
34-0.039029-0.32890.371612
350.0407220.34310.366259
36-0.059227-0.49910.309642
370.0468680.39490.347044
38-0.059905-0.50480.307643
39-0.043963-0.37040.356079
40-0.159644-1.34520.091423
41-0.019064-0.16060.436417
42-0.008564-0.07220.471338
43-0.052263-0.44040.3305
440.0396780.33430.369556
45-0.020984-0.17680.430079
46-0.090093-0.75910.225141
470.0171430.14450.442777
48-0.086697-0.73050.233737

\begin{tabular}{lllllllll}
\hline
Partial Autocorrelation Function \tabularnewline
Time lag k & PACF(k) & T-STAT & P-value \tabularnewline
1 & 0.377365 & 3.1797 & 0.001093 \tabularnewline
2 & 0.048153 & 0.4057 & 0.343076 \tabularnewline
3 & -0.108519 & -0.9144 & 0.181802 \tabularnewline
4 & 0.038609 & 0.3253 & 0.372945 \tabularnewline
5 & 0.065769 & 0.5542 & 0.290598 \tabularnewline
6 & -0.098311 & -0.8284 & 0.205115 \tabularnewline
7 & 0.00981 & 0.0827 & 0.467179 \tabularnewline
8 & -0.239969 & -2.022 & 0.023472 \tabularnewline
9 & -0.064548 & -0.5439 & 0.294111 \tabularnewline
10 & -0.035326 & -0.2977 & 0.383414 \tabularnewline
11 & 0.138149 & 1.1641 & 0.124147 \tabularnewline
12 & -0.119018 & -1.0029 & 0.159666 \tabularnewline
13 & -0.191081 & -1.6101 & 0.055909 \tabularnewline
14 & 0.007955 & 0.067 & 0.473374 \tabularnewline
15 & -0.111661 & -0.9409 & 0.174981 \tabularnewline
16 & -0.072171 & -0.6081 & 0.272523 \tabularnewline
17 & 0.049558 & 0.4176 & 0.338755 \tabularnewline
18 & -0.026962 & -0.2272 & 0.410467 \tabularnewline
19 & -0.005727 & -0.0483 & 0.480825 \tabularnewline
20 & -0.033097 & -0.2789 & 0.390574 \tabularnewline
21 & -0.089014 & -0.75 & 0.227853 \tabularnewline
22 & -0.067216 & -0.5664 & 0.286465 \tabularnewline
23 & 0.052155 & 0.4395 & 0.33083 \tabularnewline
24 & -0.177388 & -1.4947 & 0.069712 \tabularnewline
25 & -0.123769 & -1.0429 & 0.150268 \tabularnewline
26 & 0.051675 & 0.4354 & 0.332289 \tabularnewline
27 & -0.057867 & -0.4876 & 0.313669 \tabularnewline
28 & -0.085336 & -0.7191 & 0.237233 \tabularnewline
29 & 0.139014 & 1.1713 & 0.122687 \tabularnewline
30 & -0.208655 & -1.7582 & 0.041515 \tabularnewline
31 & -0.019288 & -0.1625 & 0.435677 \tabularnewline
32 & -0.092472 & -0.7792 & 0.219231 \tabularnewline
33 & -0.098379 & -0.829 & 0.204953 \tabularnewline
34 & -0.039029 & -0.3289 & 0.371612 \tabularnewline
35 & 0.040722 & 0.3431 & 0.366259 \tabularnewline
36 & -0.059227 & -0.4991 & 0.309642 \tabularnewline
37 & 0.046868 & 0.3949 & 0.347044 \tabularnewline
38 & -0.059905 & -0.5048 & 0.307643 \tabularnewline
39 & -0.043963 & -0.3704 & 0.356079 \tabularnewline
40 & -0.159644 & -1.3452 & 0.091423 \tabularnewline
41 & -0.019064 & -0.1606 & 0.436417 \tabularnewline
42 & -0.008564 & -0.0722 & 0.471338 \tabularnewline
43 & -0.052263 & -0.4404 & 0.3305 \tabularnewline
44 & 0.039678 & 0.3343 & 0.369556 \tabularnewline
45 & -0.020984 & -0.1768 & 0.430079 \tabularnewline
46 & -0.090093 & -0.7591 & 0.225141 \tabularnewline
47 & 0.017143 & 0.1445 & 0.442777 \tabularnewline
48 & -0.086697 & -0.7305 & 0.233737 \tabularnewline
\hline
\end{tabular}
%Source: https://freestatistics.org/blog/index.php?pk=121279&T=2

[TABLE]
[ROW][C]Partial Autocorrelation Function[/C][/ROW]
[ROW][C]Time lag k[/C][C]PACF(k)[/C][C]T-STAT[/C][C]P-value[/C][/ROW]
[ROW][C]1[/C][C]0.377365[/C][C]3.1797[/C][C]0.001093[/C][/ROW]
[ROW][C]2[/C][C]0.048153[/C][C]0.4057[/C][C]0.343076[/C][/ROW]
[ROW][C]3[/C][C]-0.108519[/C][C]-0.9144[/C][C]0.181802[/C][/ROW]
[ROW][C]4[/C][C]0.038609[/C][C]0.3253[/C][C]0.372945[/C][/ROW]
[ROW][C]5[/C][C]0.065769[/C][C]0.5542[/C][C]0.290598[/C][/ROW]
[ROW][C]6[/C][C]-0.098311[/C][C]-0.8284[/C][C]0.205115[/C][/ROW]
[ROW][C]7[/C][C]0.00981[/C][C]0.0827[/C][C]0.467179[/C][/ROW]
[ROW][C]8[/C][C]-0.239969[/C][C]-2.022[/C][C]0.023472[/C][/ROW]
[ROW][C]9[/C][C]-0.064548[/C][C]-0.5439[/C][C]0.294111[/C][/ROW]
[ROW][C]10[/C][C]-0.035326[/C][C]-0.2977[/C][C]0.383414[/C][/ROW]
[ROW][C]11[/C][C]0.138149[/C][C]1.1641[/C][C]0.124147[/C][/ROW]
[ROW][C]12[/C][C]-0.119018[/C][C]-1.0029[/C][C]0.159666[/C][/ROW]
[ROW][C]13[/C][C]-0.191081[/C][C]-1.6101[/C][C]0.055909[/C][/ROW]
[ROW][C]14[/C][C]0.007955[/C][C]0.067[/C][C]0.473374[/C][/ROW]
[ROW][C]15[/C][C]-0.111661[/C][C]-0.9409[/C][C]0.174981[/C][/ROW]
[ROW][C]16[/C][C]-0.072171[/C][C]-0.6081[/C][C]0.272523[/C][/ROW]
[ROW][C]17[/C][C]0.049558[/C][C]0.4176[/C][C]0.338755[/C][/ROW]
[ROW][C]18[/C][C]-0.026962[/C][C]-0.2272[/C][C]0.410467[/C][/ROW]
[ROW][C]19[/C][C]-0.005727[/C][C]-0.0483[/C][C]0.480825[/C][/ROW]
[ROW][C]20[/C][C]-0.033097[/C][C]-0.2789[/C][C]0.390574[/C][/ROW]
[ROW][C]21[/C][C]-0.089014[/C][C]-0.75[/C][C]0.227853[/C][/ROW]
[ROW][C]22[/C][C]-0.067216[/C][C]-0.5664[/C][C]0.286465[/C][/ROW]
[ROW][C]23[/C][C]0.052155[/C][C]0.4395[/C][C]0.33083[/C][/ROW]
[ROW][C]24[/C][C]-0.177388[/C][C]-1.4947[/C][C]0.069712[/C][/ROW]
[ROW][C]25[/C][C]-0.123769[/C][C]-1.0429[/C][C]0.150268[/C][/ROW]
[ROW][C]26[/C][C]0.051675[/C][C]0.4354[/C][C]0.332289[/C][/ROW]
[ROW][C]27[/C][C]-0.057867[/C][C]-0.4876[/C][C]0.313669[/C][/ROW]
[ROW][C]28[/C][C]-0.085336[/C][C]-0.7191[/C][C]0.237233[/C][/ROW]
[ROW][C]29[/C][C]0.139014[/C][C]1.1713[/C][C]0.122687[/C][/ROW]
[ROW][C]30[/C][C]-0.208655[/C][C]-1.7582[/C][C]0.041515[/C][/ROW]
[ROW][C]31[/C][C]-0.019288[/C][C]-0.1625[/C][C]0.435677[/C][/ROW]
[ROW][C]32[/C][C]-0.092472[/C][C]-0.7792[/C][C]0.219231[/C][/ROW]
[ROW][C]33[/C][C]-0.098379[/C][C]-0.829[/C][C]0.204953[/C][/ROW]
[ROW][C]34[/C][C]-0.039029[/C][C]-0.3289[/C][C]0.371612[/C][/ROW]
[ROW][C]35[/C][C]0.040722[/C][C]0.3431[/C][C]0.366259[/C][/ROW]
[ROW][C]36[/C][C]-0.059227[/C][C]-0.4991[/C][C]0.309642[/C][/ROW]
[ROW][C]37[/C][C]0.046868[/C][C]0.3949[/C][C]0.347044[/C][/ROW]
[ROW][C]38[/C][C]-0.059905[/C][C]-0.5048[/C][C]0.307643[/C][/ROW]
[ROW][C]39[/C][C]-0.043963[/C][C]-0.3704[/C][C]0.356079[/C][/ROW]
[ROW][C]40[/C][C]-0.159644[/C][C]-1.3452[/C][C]0.091423[/C][/ROW]
[ROW][C]41[/C][C]-0.019064[/C][C]-0.1606[/C][C]0.436417[/C][/ROW]
[ROW][C]42[/C][C]-0.008564[/C][C]-0.0722[/C][C]0.471338[/C][/ROW]
[ROW][C]43[/C][C]-0.052263[/C][C]-0.4404[/C][C]0.3305[/C][/ROW]
[ROW][C]44[/C][C]0.039678[/C][C]0.3343[/C][C]0.369556[/C][/ROW]
[ROW][C]45[/C][C]-0.020984[/C][C]-0.1768[/C][C]0.430079[/C][/ROW]
[ROW][C]46[/C][C]-0.090093[/C][C]-0.7591[/C][C]0.225141[/C][/ROW]
[ROW][C]47[/C][C]0.017143[/C][C]0.1445[/C][C]0.442777[/C][/ROW]
[ROW][C]48[/C][C]-0.086697[/C][C]-0.7305[/C][C]0.233737[/C][/ROW]
[/TABLE]
Source: https://freestatistics.org/blog/index.php?pk=121279&T=2

Globally Unique Identifier (entire table): ba.freestatistics.org/blog/index.php?pk=121279&T=2

As an alternative you can also use a QR Code:  

The GUIDs for individual cells are displayed in the table below:

Partial Autocorrelation Function
Time lag kPACF(k)T-STATP-value
10.3773653.17970.001093
20.0481530.40570.343076
3-0.108519-0.91440.181802
40.0386090.32530.372945
50.0657690.55420.290598
6-0.098311-0.82840.205115
70.009810.08270.467179
8-0.239969-2.0220.023472
9-0.064548-0.54390.294111
10-0.035326-0.29770.383414
110.1381491.16410.124147
12-0.119018-1.00290.159666
13-0.191081-1.61010.055909
140.0079550.0670.473374
15-0.111661-0.94090.174981
16-0.072171-0.60810.272523
170.0495580.41760.338755
18-0.026962-0.22720.410467
19-0.005727-0.04830.480825
20-0.033097-0.27890.390574
21-0.089014-0.750.227853
22-0.067216-0.56640.286465
230.0521550.43950.33083
24-0.177388-1.49470.069712
25-0.123769-1.04290.150268
260.0516750.43540.332289
27-0.057867-0.48760.313669
28-0.085336-0.71910.237233
290.1390141.17130.122687
30-0.208655-1.75820.041515
31-0.019288-0.16250.435677
32-0.092472-0.77920.219231
33-0.098379-0.8290.204953
34-0.039029-0.32890.371612
350.0407220.34310.366259
36-0.059227-0.49910.309642
370.0468680.39490.347044
38-0.059905-0.50480.307643
39-0.043963-0.37040.356079
40-0.159644-1.34520.091423
41-0.019064-0.16060.436417
42-0.008564-0.07220.471338
43-0.052263-0.44040.3305
440.0396780.33430.369556
45-0.020984-0.17680.430079
46-0.090093-0.75910.225141
470.0171430.14450.442777
48-0.086697-0.73050.233737


Parameters (Session):
par1 = 48 ; par2 = 1 ; par3 = 1 ; par4 = 0 ; par5 = 12 ; par6 = White Noise ; par7 = 0.95 ;
Parameters (R input):
par1 = 48 ; par2 = 1 ; par3 = 1 ; par4 = 0 ; par5 = 12 ; par6 = White Noise ; par7 = 0.95 ; par8 = ;
R code (references can be found in the software module):
if (par1 == 'Default') {
par1 = 10*log10(length(x))
} else {
par1 <- as.numeric(par1)
}
par2 <- as.numeric(par2)
par3 <- as.numeric(par3)
par4 <- as.numeric(par4)
par5 <- as.numeric(par5)
if (par6 == 'White Noise') par6 <- 'white' else par6 <- 'ma'
par7 <- as.numeric(par7)
if (par8 != '') par8 <- as.numeric(par8)
ox <- x
if (par8 == '') {
if (par2 == 0) {
x <- log(x)
} else {
x <- (x ^ par2 - 1) / par2
}
} else {
x <- log(x,base=par8)
}
if (par3 > 0) x <- diff(x,lag=1,difference=par3)
if (par4 > 0) x <- diff(x,lag=par5,difference=par4)
bitmap(file='picts.png')
op <- par(mfrow=c(2,1))
plot(ox,type='l',main='Original Time Series',xlab='time',ylab='value')
if (par8=='') {
mytitle <- paste('Working Time Series (lambda=',par2,', d=',par3,', D=',par4,')',sep='')
mysub <- paste('(lambda=',par2,', d=',par3,', D=',par4,', CI=', par7, ', CI type=',par6,')',sep='')
} else {
mytitle <- paste('Working Time Series (base=',par8,', d=',par3,', D=',par4,')',sep='')
mysub <- paste('(base=',par8,', d=',par3,', D=',par4,', CI=', par7, ', CI type=',par6,')',sep='')
}
plot(x,type='l', main=mytitle,xlab='time',ylab='value')
par(op)
dev.off()
bitmap(file='pic1.png')
racf <- acf(x, par1, main='Autocorrelation', xlab='time lag', ylab='ACF', ci.type=par6, ci=par7, sub=mysub)
dev.off()
bitmap(file='pic2.png')
rpacf <- pacf(x,par1,main='Partial Autocorrelation',xlab='lags',ylab='PACF',sub=mysub)
dev.off()
(myacf <- c(racf$acf))
(mypacf <- c(rpacf$acf))
lengthx <- length(x)
sqrtn <- sqrt(lengthx)
load(file='createtable')
a<-table.start()
a<-table.row.start(a)
a<-table.element(a,'Autocorrelation Function',4,TRUE)
a<-table.row.end(a)
a<-table.row.start(a)
a<-table.element(a,'Time lag k',header=TRUE)
a<-table.element(a,hyperlink('basics.htm','ACF(k)','click here for more information about the Autocorrelation Function'),header=TRUE)
a<-table.element(a,'T-STAT',header=TRUE)
a<-table.element(a,'P-value',header=TRUE)
a<-table.row.end(a)
for (i in 2:(par1+1)) {
a<-table.row.start(a)
a<-table.element(a,i-1,header=TRUE)
a<-table.element(a,round(myacf[i],6))
mytstat <- myacf[i]*sqrtn
a<-table.element(a,round(mytstat,4))
a<-table.element(a,round(1-pt(abs(mytstat),lengthx),6))
a<-table.row.end(a)
}
a<-table.end(a)
table.save(a,file='mytable.tab')
a<-table.start()
a<-table.row.start(a)
a<-table.element(a,'Partial Autocorrelation Function',4,TRUE)
a<-table.row.end(a)
a<-table.row.start(a)
a<-table.element(a,'Time lag k',header=TRUE)
a<-table.element(a,hyperlink('basics.htm','PACF(k)','click here for more information about the Partial Autocorrelation Function'),header=TRUE)
a<-table.element(a,'T-STAT',header=TRUE)
a<-table.element(a,'P-value',header=TRUE)
a<-table.row.end(a)
for (i in 1:par1) {
a<-table.row.start(a)
a<-table.element(a,i,header=TRUE)
a<-table.element(a,round(mypacf[i],6))
mytstat <- mypacf[i]*sqrtn
a<-table.element(a,round(mytstat,4))
a<-table.element(a,round(1-pt(abs(mytstat),lengthx),6))
a<-table.row.end(a)
}
a<-table.end(a)
table.save(a,file='mytable1.tab')