Free Statistics

of Irreproducible Research!

Author's title

Author*Unverified author*
R Software Modulerwasp_autocorrelation.wasp
Title produced by software(Partial) Autocorrelation Function
Date of computationMon, 09 May 2011 14:40:28 +0000
Cite this page as followsStatistical Computations at FreeStatistics.org, Office for Research Development and Education, URL https://freestatistics.org/blog/index.php?v=date/2011/May/09/t13049518536tvtcu3knj3v5r8.htm/, Retrieved Tue, 14 May 2024 12:40:23 +0000
Statistical Computations at FreeStatistics.org, Office for Research Development and Education, URL https://freestatistics.org/blog/index.php?pk=121278, Retrieved Tue, 14 May 2024 12:40:23 +0000
QR Codes:

Original text written by user:
IsPrivate?No (this computation is public)
User-defined keywordsKDGP2W12
Estimated Impact96
Family? (F = Feedback message, R = changed R code, M = changed R Module, P = changed Parameters, D = changed Data)
-       [(Partial) Autocorrelation Function] [Opgave 6 BIS: Eig...] [2011-05-09 14:40:28] [4bded9ec08f78e1ece38a218e29ff7d2] [Current]
Feedback Forum

Post a new message
Dataseries X:
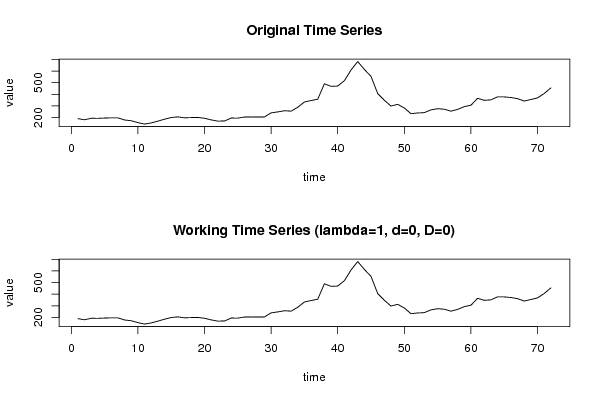
190,2
180,7
193,6
192,8
195,5
197,2
196,9
178,9
172,4
156,4
143,7
153,6
168,8
185,8
199,9
205,4
197,5
199,6
200,5
193,7
179,6
169,1
169,8
195,5
194,8
204,5
203,8
204,8
204,9
240
248,3
258,4
254,9
288,3
333,6
346,3
357,5
490,7
468,2
471,2
517,1
609,2
682
614
554,2
406,8
348,6
298,8
313,7
282,1
232,9
239,3
241,9
265,7
276
271,5
254,6
269,9
293,5
306,1
365,4
347,9
352,1
377,9
377,4
372,2
362,5
341,9
354,8
369,2
406,7
454,7


Summary of computational transaction
Raw Inputview raw input (R code)
Raw Outputview raw output of R engine
Computing time3 seconds
R Server'Gwilym Jenkins' @ www.wessa.org

\begin{tabular}{lllllllll}
\hline
Summary of computational transaction \tabularnewline
Raw Input & view raw input (R code)  \tabularnewline
Raw Output & view raw output of R engine  \tabularnewline
Computing time & 3 seconds \tabularnewline
R Server & 'Gwilym Jenkins' @ www.wessa.org \tabularnewline
\hline
\end{tabular}
%Source: https://freestatistics.org/blog/index.php?pk=121278&T=0

[TABLE]
[ROW][C]Summary of computational transaction[/C][/ROW]
[ROW][C]Raw Input[/C][C]view raw input (R code) [/C][/ROW]
[ROW][C]Raw Output[/C][C]view raw output of R engine [/C][/ROW]
[ROW][C]Computing time[/C][C]3 seconds[/C][/ROW]
[ROW][C]R Server[/C][C]'Gwilym Jenkins' @ www.wessa.org[/C][/ROW]
[/TABLE]
Source: https://freestatistics.org/blog/index.php?pk=121278&T=0

Globally Unique Identifier (entire table): ba.freestatistics.org/blog/index.php?pk=121278&T=0

As an alternative you can also use a QR Code:  

The GUIDs for individual cells are displayed in the table below:

Summary of computational transaction
Raw Inputview raw input (R code)
Raw Outputview raw output of R engine
Computing time3 seconds
R Server'Gwilym Jenkins' @ www.wessa.org


Autocorrelation Function
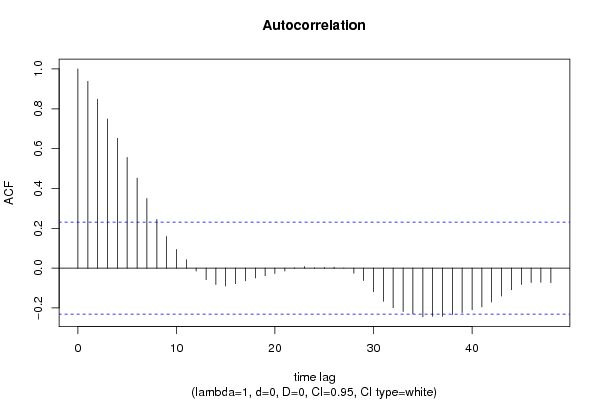
Time lag kACF(k)T-STATP-value
10.93777.95660
20.8479627.19520
30.7485356.35150
40.6514435.52770
50.5556674.7156e-06
60.4518783.83430.000134
70.3489882.96130.002074
80.2444872.07450.020802
90.1589791.3490.090785
100.0932450.79120.215709
110.0419050.35560.3616
12-0.014732-0.1250.450435
13-0.057945-0.49170.312222
14-0.08201-0.69590.244373
15-0.08946-0.75910.225138
16-0.077928-0.66120.255285
17-0.063089-0.53530.297036
18-0.048931-0.41520.339616
19-0.038024-0.32260.37395
20-0.026753-0.2270.410532
21-0.014064-0.11930.452672
220.0007920.00670.497328
230.0075950.06440.474398
240.0023250.01970.492156
250.0033560.02850.48868
260.0044190.03750.485097
27-0.000167-0.00140.499437
28-0.025061-0.21270.4161
29-0.06219-0.52770.299666
30-0.119058-1.01020.157881
31-0.166219-1.41040.081362
32-0.1988-1.68690.047978
33-0.217048-1.84170.034818
34-0.228468-1.93860.028234
35-0.243618-2.06720.021157
36-0.24158-2.04990.02201
37-0.24104-2.04530.022241
38-0.232507-1.97290.026174
39-0.222486-1.88790.031537
40-0.208776-1.77150.040352
41-0.194667-1.65180.051465
42-0.170474-1.44650.076185
43-0.139568-1.18430.1201
44-0.108517-0.92080.180116
45-0.082673-0.70150.242625
46-0.07227-0.61320.270829
47-0.070546-0.59860.275658
48-0.073643-0.62490.267011

\begin{tabular}{lllllllll}
\hline
Autocorrelation Function \tabularnewline
Time lag k & ACF(k) & T-STAT & P-value \tabularnewline
1 & 0.9377 & 7.9566 & 0 \tabularnewline
2 & 0.847962 & 7.1952 & 0 \tabularnewline
3 & 0.748535 & 6.3515 & 0 \tabularnewline
4 & 0.651443 & 5.5277 & 0 \tabularnewline
5 & 0.555667 & 4.715 & 6e-06 \tabularnewline
6 & 0.451878 & 3.8343 & 0.000134 \tabularnewline
7 & 0.348988 & 2.9613 & 0.002074 \tabularnewline
8 & 0.244487 & 2.0745 & 0.020802 \tabularnewline
9 & 0.158979 & 1.349 & 0.090785 \tabularnewline
10 & 0.093245 & 0.7912 & 0.215709 \tabularnewline
11 & 0.041905 & 0.3556 & 0.3616 \tabularnewline
12 & -0.014732 & -0.125 & 0.450435 \tabularnewline
13 & -0.057945 & -0.4917 & 0.312222 \tabularnewline
14 & -0.08201 & -0.6959 & 0.244373 \tabularnewline
15 & -0.08946 & -0.7591 & 0.225138 \tabularnewline
16 & -0.077928 & -0.6612 & 0.255285 \tabularnewline
17 & -0.063089 & -0.5353 & 0.297036 \tabularnewline
18 & -0.048931 & -0.4152 & 0.339616 \tabularnewline
19 & -0.038024 & -0.3226 & 0.37395 \tabularnewline
20 & -0.026753 & -0.227 & 0.410532 \tabularnewline
21 & -0.014064 & -0.1193 & 0.452672 \tabularnewline
22 & 0.000792 & 0.0067 & 0.497328 \tabularnewline
23 & 0.007595 & 0.0644 & 0.474398 \tabularnewline
24 & 0.002325 & 0.0197 & 0.492156 \tabularnewline
25 & 0.003356 & 0.0285 & 0.48868 \tabularnewline
26 & 0.004419 & 0.0375 & 0.485097 \tabularnewline
27 & -0.000167 & -0.0014 & 0.499437 \tabularnewline
28 & -0.025061 & -0.2127 & 0.4161 \tabularnewline
29 & -0.06219 & -0.5277 & 0.299666 \tabularnewline
30 & -0.119058 & -1.0102 & 0.157881 \tabularnewline
31 & -0.166219 & -1.4104 & 0.081362 \tabularnewline
32 & -0.1988 & -1.6869 & 0.047978 \tabularnewline
33 & -0.217048 & -1.8417 & 0.034818 \tabularnewline
34 & -0.228468 & -1.9386 & 0.028234 \tabularnewline
35 & -0.243618 & -2.0672 & 0.021157 \tabularnewline
36 & -0.24158 & -2.0499 & 0.02201 \tabularnewline
37 & -0.24104 & -2.0453 & 0.022241 \tabularnewline
38 & -0.232507 & -1.9729 & 0.026174 \tabularnewline
39 & -0.222486 & -1.8879 & 0.031537 \tabularnewline
40 & -0.208776 & -1.7715 & 0.040352 \tabularnewline
41 & -0.194667 & -1.6518 & 0.051465 \tabularnewline
42 & -0.170474 & -1.4465 & 0.076185 \tabularnewline
43 & -0.139568 & -1.1843 & 0.1201 \tabularnewline
44 & -0.108517 & -0.9208 & 0.180116 \tabularnewline
45 & -0.082673 & -0.7015 & 0.242625 \tabularnewline
46 & -0.07227 & -0.6132 & 0.270829 \tabularnewline
47 & -0.070546 & -0.5986 & 0.275658 \tabularnewline
48 & -0.073643 & -0.6249 & 0.267011 \tabularnewline
\hline
\end{tabular}
%Source: https://freestatistics.org/blog/index.php?pk=121278&T=1

[TABLE]
[ROW][C]Autocorrelation Function[/C][/ROW]
[ROW][C]Time lag k[/C][C]ACF(k)[/C][C]T-STAT[/C][C]P-value[/C][/ROW]
[ROW][C]1[/C][C]0.9377[/C][C]7.9566[/C][C]0[/C][/ROW]
[ROW][C]2[/C][C]0.847962[/C][C]7.1952[/C][C]0[/C][/ROW]
[ROW][C]3[/C][C]0.748535[/C][C]6.3515[/C][C]0[/C][/ROW]
[ROW][C]4[/C][C]0.651443[/C][C]5.5277[/C][C]0[/C][/ROW]
[ROW][C]5[/C][C]0.555667[/C][C]4.715[/C][C]6e-06[/C][/ROW]
[ROW][C]6[/C][C]0.451878[/C][C]3.8343[/C][C]0.000134[/C][/ROW]
[ROW][C]7[/C][C]0.348988[/C][C]2.9613[/C][C]0.002074[/C][/ROW]
[ROW][C]8[/C][C]0.244487[/C][C]2.0745[/C][C]0.020802[/C][/ROW]
[ROW][C]9[/C][C]0.158979[/C][C]1.349[/C][C]0.090785[/C][/ROW]
[ROW][C]10[/C][C]0.093245[/C][C]0.7912[/C][C]0.215709[/C][/ROW]
[ROW][C]11[/C][C]0.041905[/C][C]0.3556[/C][C]0.3616[/C][/ROW]
[ROW][C]12[/C][C]-0.014732[/C][C]-0.125[/C][C]0.450435[/C][/ROW]
[ROW][C]13[/C][C]-0.057945[/C][C]-0.4917[/C][C]0.312222[/C][/ROW]
[ROW][C]14[/C][C]-0.08201[/C][C]-0.6959[/C][C]0.244373[/C][/ROW]
[ROW][C]15[/C][C]-0.08946[/C][C]-0.7591[/C][C]0.225138[/C][/ROW]
[ROW][C]16[/C][C]-0.077928[/C][C]-0.6612[/C][C]0.255285[/C][/ROW]
[ROW][C]17[/C][C]-0.063089[/C][C]-0.5353[/C][C]0.297036[/C][/ROW]
[ROW][C]18[/C][C]-0.048931[/C][C]-0.4152[/C][C]0.339616[/C][/ROW]
[ROW][C]19[/C][C]-0.038024[/C][C]-0.3226[/C][C]0.37395[/C][/ROW]
[ROW][C]20[/C][C]-0.026753[/C][C]-0.227[/C][C]0.410532[/C][/ROW]
[ROW][C]21[/C][C]-0.014064[/C][C]-0.1193[/C][C]0.452672[/C][/ROW]
[ROW][C]22[/C][C]0.000792[/C][C]0.0067[/C][C]0.497328[/C][/ROW]
[ROW][C]23[/C][C]0.007595[/C][C]0.0644[/C][C]0.474398[/C][/ROW]
[ROW][C]24[/C][C]0.002325[/C][C]0.0197[/C][C]0.492156[/C][/ROW]
[ROW][C]25[/C][C]0.003356[/C][C]0.0285[/C][C]0.48868[/C][/ROW]
[ROW][C]26[/C][C]0.004419[/C][C]0.0375[/C][C]0.485097[/C][/ROW]
[ROW][C]27[/C][C]-0.000167[/C][C]-0.0014[/C][C]0.499437[/C][/ROW]
[ROW][C]28[/C][C]-0.025061[/C][C]-0.2127[/C][C]0.4161[/C][/ROW]
[ROW][C]29[/C][C]-0.06219[/C][C]-0.5277[/C][C]0.299666[/C][/ROW]
[ROW][C]30[/C][C]-0.119058[/C][C]-1.0102[/C][C]0.157881[/C][/ROW]
[ROW][C]31[/C][C]-0.166219[/C][C]-1.4104[/C][C]0.081362[/C][/ROW]
[ROW][C]32[/C][C]-0.1988[/C][C]-1.6869[/C][C]0.047978[/C][/ROW]
[ROW][C]33[/C][C]-0.217048[/C][C]-1.8417[/C][C]0.034818[/C][/ROW]
[ROW][C]34[/C][C]-0.228468[/C][C]-1.9386[/C][C]0.028234[/C][/ROW]
[ROW][C]35[/C][C]-0.243618[/C][C]-2.0672[/C][C]0.021157[/C][/ROW]
[ROW][C]36[/C][C]-0.24158[/C][C]-2.0499[/C][C]0.02201[/C][/ROW]
[ROW][C]37[/C][C]-0.24104[/C][C]-2.0453[/C][C]0.022241[/C][/ROW]
[ROW][C]38[/C][C]-0.232507[/C][C]-1.9729[/C][C]0.026174[/C][/ROW]
[ROW][C]39[/C][C]-0.222486[/C][C]-1.8879[/C][C]0.031537[/C][/ROW]
[ROW][C]40[/C][C]-0.208776[/C][C]-1.7715[/C][C]0.040352[/C][/ROW]
[ROW][C]41[/C][C]-0.194667[/C][C]-1.6518[/C][C]0.051465[/C][/ROW]
[ROW][C]42[/C][C]-0.170474[/C][C]-1.4465[/C][C]0.076185[/C][/ROW]
[ROW][C]43[/C][C]-0.139568[/C][C]-1.1843[/C][C]0.1201[/C][/ROW]
[ROW][C]44[/C][C]-0.108517[/C][C]-0.9208[/C][C]0.180116[/C][/ROW]
[ROW][C]45[/C][C]-0.082673[/C][C]-0.7015[/C][C]0.242625[/C][/ROW]
[ROW][C]46[/C][C]-0.07227[/C][C]-0.6132[/C][C]0.270829[/C][/ROW]
[ROW][C]47[/C][C]-0.070546[/C][C]-0.5986[/C][C]0.275658[/C][/ROW]
[ROW][C]48[/C][C]-0.073643[/C][C]-0.6249[/C][C]0.267011[/C][/ROW]
[/TABLE]
Source: https://freestatistics.org/blog/index.php?pk=121278&T=1

Globally Unique Identifier (entire table): ba.freestatistics.org/blog/index.php?pk=121278&T=1

As an alternative you can also use a QR Code:  

The GUIDs for individual cells are displayed in the table below:

Autocorrelation Function
Time lag kACF(k)T-STATP-value
10.93777.95660
20.8479627.19520
30.7485356.35150
40.6514435.52770
50.5556674.7156e-06
60.4518783.83430.000134
70.3489882.96130.002074
80.2444872.07450.020802
90.1589791.3490.090785
100.0932450.79120.215709
110.0419050.35560.3616
12-0.014732-0.1250.450435
13-0.057945-0.49170.312222
14-0.08201-0.69590.244373
15-0.08946-0.75910.225138
16-0.077928-0.66120.255285
17-0.063089-0.53530.297036
18-0.048931-0.41520.339616
19-0.038024-0.32260.37395
20-0.026753-0.2270.410532
21-0.014064-0.11930.452672
220.0007920.00670.497328
230.0075950.06440.474398
240.0023250.01970.492156
250.0033560.02850.48868
260.0044190.03750.485097
27-0.000167-0.00140.499437
28-0.025061-0.21270.4161
29-0.06219-0.52770.299666
30-0.119058-1.01020.157881
31-0.166219-1.41040.081362
32-0.1988-1.68690.047978
33-0.217048-1.84170.034818
34-0.228468-1.93860.028234
35-0.243618-2.06720.021157
36-0.24158-2.04990.02201
37-0.24104-2.04530.022241
38-0.232507-1.97290.026174
39-0.222486-1.88790.031537
40-0.208776-1.77150.040352
41-0.194667-1.65180.051465
42-0.170474-1.44650.076185
43-0.139568-1.18430.1201
44-0.108517-0.92080.180116
45-0.082673-0.70150.242625
46-0.07227-0.61320.270829
47-0.070546-0.59860.275658
48-0.073643-0.62490.267011


Partial Autocorrelation Function
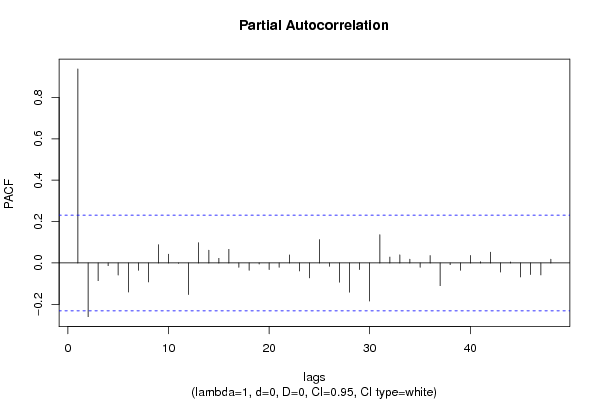
Time lag kPACF(k)T-STATP-value
10.93777.95660
2-0.259438-2.20140.015457
3-0.085369-0.72440.23559
4-0.012754-0.10820.457062
5-0.057903-0.49130.312347
6-0.140501-1.19220.118551
7-0.034895-0.29610.384007
8-0.091306-0.77480.22051
90.0878220.74520.229291
100.0425360.36090.359604
11-0.00135-0.01150.495447
12-0.152639-1.29520.099697
130.0979870.83140.204235
140.0618450.52480.300678
150.0221890.18830.425592
160.0656940.55740.28948
17-0.020951-0.17780.4297
18-0.035191-0.29860.383049
19-0.005323-0.04520.48205
20-0.031214-0.26490.395936
21-0.020793-0.17640.430225
220.0389390.33040.371024
23-0.038201-0.32410.373383
24-0.071934-0.61040.271765
250.1130130.95890.170397
26-0.016088-0.13650.4459
27-0.0925-0.78490.217547
28-0.141023-1.19660.11769
29-0.031735-0.26930.394243
30-0.184128-1.56240.061292
310.1362991.15650.125642
320.0281840.23920.405833
330.0389870.33080.370871
340.0177820.15090.440243
35-0.020828-0.17670.430107
360.0354530.30080.382206
37-0.109405-0.92830.178168
38-0.007909-0.06710.473341
39-0.035229-0.29890.382927
400.0365570.31020.378653
410.0059050.05010.48009
420.0520510.44170.330026
43-0.043284-0.36730.357246
440.0045140.03830.484776
45-0.067147-0.56980.285307
46-0.055495-0.47090.31957
47-0.057715-0.48970.312908
480.0179850.15260.439568

\begin{tabular}{lllllllll}
\hline
Partial Autocorrelation Function \tabularnewline
Time lag k & PACF(k) & T-STAT & P-value \tabularnewline
1 & 0.9377 & 7.9566 & 0 \tabularnewline
2 & -0.259438 & -2.2014 & 0.015457 \tabularnewline
3 & -0.085369 & -0.7244 & 0.23559 \tabularnewline
4 & -0.012754 & -0.1082 & 0.457062 \tabularnewline
5 & -0.057903 & -0.4913 & 0.312347 \tabularnewline
6 & -0.140501 & -1.1922 & 0.118551 \tabularnewline
7 & -0.034895 & -0.2961 & 0.384007 \tabularnewline
8 & -0.091306 & -0.7748 & 0.22051 \tabularnewline
9 & 0.087822 & 0.7452 & 0.229291 \tabularnewline
10 & 0.042536 & 0.3609 & 0.359604 \tabularnewline
11 & -0.00135 & -0.0115 & 0.495447 \tabularnewline
12 & -0.152639 & -1.2952 & 0.099697 \tabularnewline
13 & 0.097987 & 0.8314 & 0.204235 \tabularnewline
14 & 0.061845 & 0.5248 & 0.300678 \tabularnewline
15 & 0.022189 & 0.1883 & 0.425592 \tabularnewline
16 & 0.065694 & 0.5574 & 0.28948 \tabularnewline
17 & -0.020951 & -0.1778 & 0.4297 \tabularnewline
18 & -0.035191 & -0.2986 & 0.383049 \tabularnewline
19 & -0.005323 & -0.0452 & 0.48205 \tabularnewline
20 & -0.031214 & -0.2649 & 0.395936 \tabularnewline
21 & -0.020793 & -0.1764 & 0.430225 \tabularnewline
22 & 0.038939 & 0.3304 & 0.371024 \tabularnewline
23 & -0.038201 & -0.3241 & 0.373383 \tabularnewline
24 & -0.071934 & -0.6104 & 0.271765 \tabularnewline
25 & 0.113013 & 0.9589 & 0.170397 \tabularnewline
26 & -0.016088 & -0.1365 & 0.4459 \tabularnewline
27 & -0.0925 & -0.7849 & 0.217547 \tabularnewline
28 & -0.141023 & -1.1966 & 0.11769 \tabularnewline
29 & -0.031735 & -0.2693 & 0.394243 \tabularnewline
30 & -0.184128 & -1.5624 & 0.061292 \tabularnewline
31 & 0.136299 & 1.1565 & 0.125642 \tabularnewline
32 & 0.028184 & 0.2392 & 0.405833 \tabularnewline
33 & 0.038987 & 0.3308 & 0.370871 \tabularnewline
34 & 0.017782 & 0.1509 & 0.440243 \tabularnewline
35 & -0.020828 & -0.1767 & 0.430107 \tabularnewline
36 & 0.035453 & 0.3008 & 0.382206 \tabularnewline
37 & -0.109405 & -0.9283 & 0.178168 \tabularnewline
38 & -0.007909 & -0.0671 & 0.473341 \tabularnewline
39 & -0.035229 & -0.2989 & 0.382927 \tabularnewline
40 & 0.036557 & 0.3102 & 0.378653 \tabularnewline
41 & 0.005905 & 0.0501 & 0.48009 \tabularnewline
42 & 0.052051 & 0.4417 & 0.330026 \tabularnewline
43 & -0.043284 & -0.3673 & 0.357246 \tabularnewline
44 & 0.004514 & 0.0383 & 0.484776 \tabularnewline
45 & -0.067147 & -0.5698 & 0.285307 \tabularnewline
46 & -0.055495 & -0.4709 & 0.31957 \tabularnewline
47 & -0.057715 & -0.4897 & 0.312908 \tabularnewline
48 & 0.017985 & 0.1526 & 0.439568 \tabularnewline
\hline
\end{tabular}
%Source: https://freestatistics.org/blog/index.php?pk=121278&T=2

[TABLE]
[ROW][C]Partial Autocorrelation Function[/C][/ROW]
[ROW][C]Time lag k[/C][C]PACF(k)[/C][C]T-STAT[/C][C]P-value[/C][/ROW]
[ROW][C]1[/C][C]0.9377[/C][C]7.9566[/C][C]0[/C][/ROW]
[ROW][C]2[/C][C]-0.259438[/C][C]-2.2014[/C][C]0.015457[/C][/ROW]
[ROW][C]3[/C][C]-0.085369[/C][C]-0.7244[/C][C]0.23559[/C][/ROW]
[ROW][C]4[/C][C]-0.012754[/C][C]-0.1082[/C][C]0.457062[/C][/ROW]
[ROW][C]5[/C][C]-0.057903[/C][C]-0.4913[/C][C]0.312347[/C][/ROW]
[ROW][C]6[/C][C]-0.140501[/C][C]-1.1922[/C][C]0.118551[/C][/ROW]
[ROW][C]7[/C][C]-0.034895[/C][C]-0.2961[/C][C]0.384007[/C][/ROW]
[ROW][C]8[/C][C]-0.091306[/C][C]-0.7748[/C][C]0.22051[/C][/ROW]
[ROW][C]9[/C][C]0.087822[/C][C]0.7452[/C][C]0.229291[/C][/ROW]
[ROW][C]10[/C][C]0.042536[/C][C]0.3609[/C][C]0.359604[/C][/ROW]
[ROW][C]11[/C][C]-0.00135[/C][C]-0.0115[/C][C]0.495447[/C][/ROW]
[ROW][C]12[/C][C]-0.152639[/C][C]-1.2952[/C][C]0.099697[/C][/ROW]
[ROW][C]13[/C][C]0.097987[/C][C]0.8314[/C][C]0.204235[/C][/ROW]
[ROW][C]14[/C][C]0.061845[/C][C]0.5248[/C][C]0.300678[/C][/ROW]
[ROW][C]15[/C][C]0.022189[/C][C]0.1883[/C][C]0.425592[/C][/ROW]
[ROW][C]16[/C][C]0.065694[/C][C]0.5574[/C][C]0.28948[/C][/ROW]
[ROW][C]17[/C][C]-0.020951[/C][C]-0.1778[/C][C]0.4297[/C][/ROW]
[ROW][C]18[/C][C]-0.035191[/C][C]-0.2986[/C][C]0.383049[/C][/ROW]
[ROW][C]19[/C][C]-0.005323[/C][C]-0.0452[/C][C]0.48205[/C][/ROW]
[ROW][C]20[/C][C]-0.031214[/C][C]-0.2649[/C][C]0.395936[/C][/ROW]
[ROW][C]21[/C][C]-0.020793[/C][C]-0.1764[/C][C]0.430225[/C][/ROW]
[ROW][C]22[/C][C]0.038939[/C][C]0.3304[/C][C]0.371024[/C][/ROW]
[ROW][C]23[/C][C]-0.038201[/C][C]-0.3241[/C][C]0.373383[/C][/ROW]
[ROW][C]24[/C][C]-0.071934[/C][C]-0.6104[/C][C]0.271765[/C][/ROW]
[ROW][C]25[/C][C]0.113013[/C][C]0.9589[/C][C]0.170397[/C][/ROW]
[ROW][C]26[/C][C]-0.016088[/C][C]-0.1365[/C][C]0.4459[/C][/ROW]
[ROW][C]27[/C][C]-0.0925[/C][C]-0.7849[/C][C]0.217547[/C][/ROW]
[ROW][C]28[/C][C]-0.141023[/C][C]-1.1966[/C][C]0.11769[/C][/ROW]
[ROW][C]29[/C][C]-0.031735[/C][C]-0.2693[/C][C]0.394243[/C][/ROW]
[ROW][C]30[/C][C]-0.184128[/C][C]-1.5624[/C][C]0.061292[/C][/ROW]
[ROW][C]31[/C][C]0.136299[/C][C]1.1565[/C][C]0.125642[/C][/ROW]
[ROW][C]32[/C][C]0.028184[/C][C]0.2392[/C][C]0.405833[/C][/ROW]
[ROW][C]33[/C][C]0.038987[/C][C]0.3308[/C][C]0.370871[/C][/ROW]
[ROW][C]34[/C][C]0.017782[/C][C]0.1509[/C][C]0.440243[/C][/ROW]
[ROW][C]35[/C][C]-0.020828[/C][C]-0.1767[/C][C]0.430107[/C][/ROW]
[ROW][C]36[/C][C]0.035453[/C][C]0.3008[/C][C]0.382206[/C][/ROW]
[ROW][C]37[/C][C]-0.109405[/C][C]-0.9283[/C][C]0.178168[/C][/ROW]
[ROW][C]38[/C][C]-0.007909[/C][C]-0.0671[/C][C]0.473341[/C][/ROW]
[ROW][C]39[/C][C]-0.035229[/C][C]-0.2989[/C][C]0.382927[/C][/ROW]
[ROW][C]40[/C][C]0.036557[/C][C]0.3102[/C][C]0.378653[/C][/ROW]
[ROW][C]41[/C][C]0.005905[/C][C]0.0501[/C][C]0.48009[/C][/ROW]
[ROW][C]42[/C][C]0.052051[/C][C]0.4417[/C][C]0.330026[/C][/ROW]
[ROW][C]43[/C][C]-0.043284[/C][C]-0.3673[/C][C]0.357246[/C][/ROW]
[ROW][C]44[/C][C]0.004514[/C][C]0.0383[/C][C]0.484776[/C][/ROW]
[ROW][C]45[/C][C]-0.067147[/C][C]-0.5698[/C][C]0.285307[/C][/ROW]
[ROW][C]46[/C][C]-0.055495[/C][C]-0.4709[/C][C]0.31957[/C][/ROW]
[ROW][C]47[/C][C]-0.057715[/C][C]-0.4897[/C][C]0.312908[/C][/ROW]
[ROW][C]48[/C][C]0.017985[/C][C]0.1526[/C][C]0.439568[/C][/ROW]
[/TABLE]
Source: https://freestatistics.org/blog/index.php?pk=121278&T=2

Globally Unique Identifier (entire table): ba.freestatistics.org/blog/index.php?pk=121278&T=2

As an alternative you can also use a QR Code:  

The GUIDs for individual cells are displayed in the table below:

Partial Autocorrelation Function
Time lag kPACF(k)T-STATP-value
10.93777.95660
2-0.259438-2.20140.015457
3-0.085369-0.72440.23559
4-0.012754-0.10820.457062
5-0.057903-0.49130.312347
6-0.140501-1.19220.118551
7-0.034895-0.29610.384007
8-0.091306-0.77480.22051
90.0878220.74520.229291
100.0425360.36090.359604
11-0.00135-0.01150.495447
12-0.152639-1.29520.099697
130.0979870.83140.204235
140.0618450.52480.300678
150.0221890.18830.425592
160.0656940.55740.28948
17-0.020951-0.17780.4297
18-0.035191-0.29860.383049
19-0.005323-0.04520.48205
20-0.031214-0.26490.395936
21-0.020793-0.17640.430225
220.0389390.33040.371024
23-0.038201-0.32410.373383
24-0.071934-0.61040.271765
250.1130130.95890.170397
26-0.016088-0.13650.4459
27-0.0925-0.78490.217547
28-0.141023-1.19660.11769
29-0.031735-0.26930.394243
30-0.184128-1.56240.061292
310.1362991.15650.125642
320.0281840.23920.405833
330.0389870.33080.370871
340.0177820.15090.440243
35-0.020828-0.17670.430107
360.0354530.30080.382206
37-0.109405-0.92830.178168
38-0.007909-0.06710.473341
39-0.035229-0.29890.382927
400.0365570.31020.378653
410.0059050.05010.48009
420.0520510.44170.330026
43-0.043284-0.36730.357246
440.0045140.03830.484776
45-0.067147-0.56980.285307
46-0.055495-0.47090.31957
47-0.057715-0.48970.312908
480.0179850.15260.439568


Parameters (Session):
par1 = 48 ; par2 = 1 ; par3 = 0 ; par4 = 0 ; par5 = 12 ; par6 = White Noise ; par7 = 0.95 ;
Parameters (R input):
par1 = 48 ; par2 = 1 ; par3 = 0 ; par4 = 0 ; par5 = 12 ; par6 = White Noise ; par7 = 0.95 ; par8 = ;
R code (references can be found in the software module):
if (par1 == 'Default') {
par1 = 10*log10(length(x))
} else {
par1 <- as.numeric(par1)
}
par2 <- as.numeric(par2)
par3 <- as.numeric(par3)
par4 <- as.numeric(par4)
par5 <- as.numeric(par5)
if (par6 == 'White Noise') par6 <- 'white' else par6 <- 'ma'
par7 <- as.numeric(par7)
if (par8 != '') par8 <- as.numeric(par8)
ox <- x
if (par8 == '') {
if (par2 == 0) {
x <- log(x)
} else {
x <- (x ^ par2 - 1) / par2
}
} else {
x <- log(x,base=par8)
}
if (par3 > 0) x <- diff(x,lag=1,difference=par3)
if (par4 > 0) x <- diff(x,lag=par5,difference=par4)
bitmap(file='picts.png')
op <- par(mfrow=c(2,1))
plot(ox,type='l',main='Original Time Series',xlab='time',ylab='value')
if (par8=='') {
mytitle <- paste('Working Time Series (lambda=',par2,', d=',par3,', D=',par4,')',sep='')
mysub <- paste('(lambda=',par2,', d=',par3,', D=',par4,', CI=', par7, ', CI type=',par6,')',sep='')
} else {
mytitle <- paste('Working Time Series (base=',par8,', d=',par3,', D=',par4,')',sep='')
mysub <- paste('(base=',par8,', d=',par3,', D=',par4,', CI=', par7, ', CI type=',par6,')',sep='')
}
plot(x,type='l', main=mytitle,xlab='time',ylab='value')
par(op)
dev.off()
bitmap(file='pic1.png')
racf <- acf(x, par1, main='Autocorrelation', xlab='time lag', ylab='ACF', ci.type=par6, ci=par7, sub=mysub)
dev.off()
bitmap(file='pic2.png')
rpacf <- pacf(x,par1,main='Partial Autocorrelation',xlab='lags',ylab='PACF',sub=mysub)
dev.off()
(myacf <- c(racf$acf))
(mypacf <- c(rpacf$acf))
lengthx <- length(x)
sqrtn <- sqrt(lengthx)
load(file='createtable')
a<-table.start()
a<-table.row.start(a)
a<-table.element(a,'Autocorrelation Function',4,TRUE)
a<-table.row.end(a)
a<-table.row.start(a)
a<-table.element(a,'Time lag k',header=TRUE)
a<-table.element(a,hyperlink('basics.htm','ACF(k)','click here for more information about the Autocorrelation Function'),header=TRUE)
a<-table.element(a,'T-STAT',header=TRUE)
a<-table.element(a,'P-value',header=TRUE)
a<-table.row.end(a)
for (i in 2:(par1+1)) {
a<-table.row.start(a)
a<-table.element(a,i-1,header=TRUE)
a<-table.element(a,round(myacf[i],6))
mytstat <- myacf[i]*sqrtn
a<-table.element(a,round(mytstat,4))
a<-table.element(a,round(1-pt(abs(mytstat),lengthx),6))
a<-table.row.end(a)
}
a<-table.end(a)
table.save(a,file='mytable.tab')
a<-table.start()
a<-table.row.start(a)
a<-table.element(a,'Partial Autocorrelation Function',4,TRUE)
a<-table.row.end(a)
a<-table.row.start(a)
a<-table.element(a,'Time lag k',header=TRUE)
a<-table.element(a,hyperlink('basics.htm','PACF(k)','click here for more information about the Partial Autocorrelation Function'),header=TRUE)
a<-table.element(a,'T-STAT',header=TRUE)
a<-table.element(a,'P-value',header=TRUE)
a<-table.row.end(a)
for (i in 1:par1) {
a<-table.row.start(a)
a<-table.element(a,i,header=TRUE)
a<-table.element(a,round(mypacf[i],6))
mytstat <- mypacf[i]*sqrtn
a<-table.element(a,round(mytstat,4))
a<-table.element(a,round(1-pt(abs(mytstat),lengthx),6))
a<-table.row.end(a)
}
a<-table.end(a)
table.save(a,file='mytable1.tab')