Free Statistics

of Irreproducible Research!

Author's title

Author*Unverified author*
R Software Modulerwasp_smp.wasp
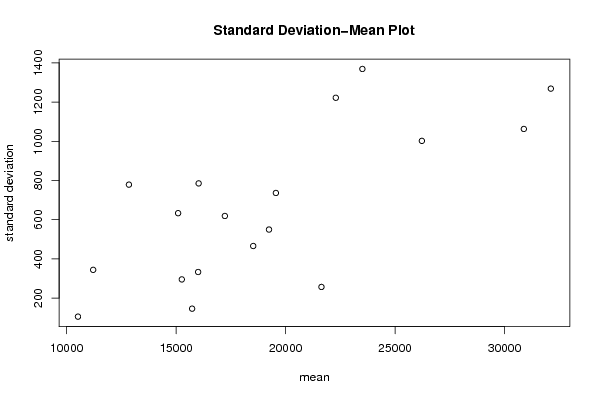
Title produced by softwareStandard Deviation-Mean Plot
Date of computationMon, 09 May 2011 13:28:33 +0000
Cite this page as followsStatistical Computations at FreeStatistics.org, Office for Research Development and Education, URL https://freestatistics.org/blog/index.php?v=date/2011/May/09/t1304947578bos0wvblzmf2vmq.htm/, Retrieved Tue, 14 May 2024 07:21:35 +0000
Statistical Computations at FreeStatistics.org, Office for Research Development and Education, URL https://freestatistics.org/blog/index.php?pk=121265, Retrieved Tue, 14 May 2024 07:21:35 +0000
QR Codes:

Original text written by user:
IsPrivate?No (this computation is public)
User-defined keywordsKDGP2W82
Estimated Impact100
Family? (F = Feedback message, R = changed R code, M = changed R Module, P = changed Parameters, D = changed Data)
-       [Standard Deviation-Mean Plot] [opgave 8 oefening...] [2011-05-09 13:28:33] [58d8a931f127f4dbe815c0a9b73ee0dc] [Current]
Feedback Forum

Post a new message
Dataseries X:
10407
10463
10556
10646
10702
11353
11346
11451
11964
12574
13031
13812
14544
14931
14886
16005
17064
15168
16050
15839
15137
14954
15648
15305
15579
16348
15928
16171
15937
15713
15594
15683
16438
17032
17696
17745
19394
20148
20108
18584
18441
18391
19178
18079
18483
19644
19195
19650
20830
23595
22937
21814
21928
21777
21383
21467
22052
22680
24320
24977
25204
25739
26434
27525
30695
32436
30160
30236
31293
31077
32226
33865
32810


Summary of computational transaction
Raw Inputview raw input (R code)
Raw Outputview raw output of R engine
Computing time2 seconds
R Server'George Udny Yule' @ 216.218.223.82

\begin{tabular}{lllllllll}
\hline
Summary of computational transaction \tabularnewline
Raw Input & view raw input (R code)  \tabularnewline
Raw Output & view raw output of R engine  \tabularnewline
Computing time & 2 seconds \tabularnewline
R Server & 'George Udny Yule' @ 216.218.223.82 \tabularnewline
\hline
\end{tabular}
%Source: https://freestatistics.org/blog/index.php?pk=121265&T=0

[TABLE]
[ROW][C]Summary of computational transaction[/C][/ROW]
[ROW][C]Raw Input[/C][C]view raw input (R code) [/C][/ROW]
[ROW][C]Raw Output[/C][C]view raw output of R engine [/C][/ROW]
[ROW][C]Computing time[/C][C]2 seconds[/C][/ROW]
[ROW][C]R Server[/C][C]'George Udny Yule' @ 216.218.223.82[/C][/ROW]
[/TABLE]
Source: https://freestatistics.org/blog/index.php?pk=121265&T=0

Globally Unique Identifier (entire table): ba.freestatistics.org/blog/index.php?pk=121265&T=0

As an alternative you can also use a QR Code:  

The GUIDs for individual cells are displayed in the table below:

Summary of computational transaction
Raw Inputview raw input (R code)
Raw Outputview raw output of R engine
Computing time2 seconds
R Server'George Udny Yule' @ 216.218.223.82


Standard Deviation-Mean Plot
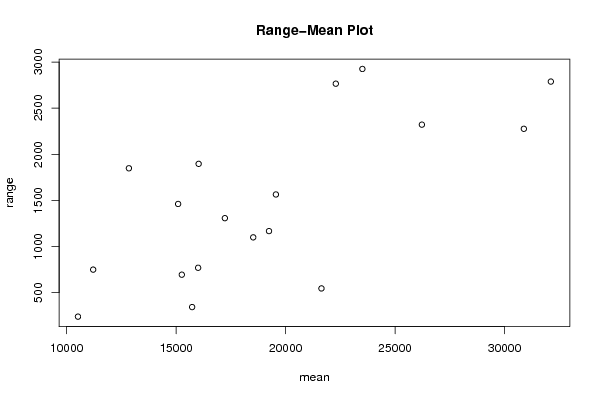
SectionMeanStandard DeviationRange
110518105.157025442906239
211213344.022286099801749
312845.25778.7354600033741848
415091.5633.0426525914351461
516030.25785.0861417704431896
615261295.144032634915694
716006.5332.966965328394769
815731.75145.866091558891343
917227.75618.8238171456131307
1019558.5736.2452037195221564
1118522.25465.584489289181099
1219243549.6526175685881167
13222941221.985542740452765
1421638.75256.700051941301545
1523507.251369.041361683422925
1626225.51002.050730585372321
1730881.751062.776983504382276
1832115.251268.588290187172788

\begin{tabular}{lllllllll}
\hline
Standard Deviation-Mean Plot \tabularnewline
Section & Mean & Standard Deviation & Range \tabularnewline
1 & 10518 & 105.157025442906 & 239 \tabularnewline
2 & 11213 & 344.022286099801 & 749 \tabularnewline
3 & 12845.25 & 778.735460003374 & 1848 \tabularnewline
4 & 15091.5 & 633.042652591435 & 1461 \tabularnewline
5 & 16030.25 & 785.086141770443 & 1896 \tabularnewline
6 & 15261 & 295.144032634915 & 694 \tabularnewline
7 & 16006.5 & 332.966965328394 & 769 \tabularnewline
8 & 15731.75 & 145.866091558891 & 343 \tabularnewline
9 & 17227.75 & 618.823817145613 & 1307 \tabularnewline
10 & 19558.5 & 736.245203719522 & 1564 \tabularnewline
11 & 18522.25 & 465.58448928918 & 1099 \tabularnewline
12 & 19243 & 549.652617568588 & 1167 \tabularnewline
13 & 22294 & 1221.98554274045 & 2765 \tabularnewline
14 & 21638.75 & 256.700051941301 & 545 \tabularnewline
15 & 23507.25 & 1369.04136168342 & 2925 \tabularnewline
16 & 26225.5 & 1002.05073058537 & 2321 \tabularnewline
17 & 30881.75 & 1062.77698350438 & 2276 \tabularnewline
18 & 32115.25 & 1268.58829018717 & 2788 \tabularnewline
\hline
\end{tabular}
%Source: https://freestatistics.org/blog/index.php?pk=121265&T=1

[TABLE]
[ROW][C]Standard Deviation-Mean Plot[/C][/ROW]
[ROW][C]Section[/C][C]Mean[/C][C]Standard Deviation[/C][C]Range[/C][/ROW]
[ROW][C]1[/C][C]10518[/C][C]105.157025442906[/C][C]239[/C][/ROW]
[ROW][C]2[/C][C]11213[/C][C]344.022286099801[/C][C]749[/C][/ROW]
[ROW][C]3[/C][C]12845.25[/C][C]778.735460003374[/C][C]1848[/C][/ROW]
[ROW][C]4[/C][C]15091.5[/C][C]633.042652591435[/C][C]1461[/C][/ROW]
[ROW][C]5[/C][C]16030.25[/C][C]785.086141770443[/C][C]1896[/C][/ROW]
[ROW][C]6[/C][C]15261[/C][C]295.144032634915[/C][C]694[/C][/ROW]
[ROW][C]7[/C][C]16006.5[/C][C]332.966965328394[/C][C]769[/C][/ROW]
[ROW][C]8[/C][C]15731.75[/C][C]145.866091558891[/C][C]343[/C][/ROW]
[ROW][C]9[/C][C]17227.75[/C][C]618.823817145613[/C][C]1307[/C][/ROW]
[ROW][C]10[/C][C]19558.5[/C][C]736.245203719522[/C][C]1564[/C][/ROW]
[ROW][C]11[/C][C]18522.25[/C][C]465.58448928918[/C][C]1099[/C][/ROW]
[ROW][C]12[/C][C]19243[/C][C]549.652617568588[/C][C]1167[/C][/ROW]
[ROW][C]13[/C][C]22294[/C][C]1221.98554274045[/C][C]2765[/C][/ROW]
[ROW][C]14[/C][C]21638.75[/C][C]256.700051941301[/C][C]545[/C][/ROW]
[ROW][C]15[/C][C]23507.25[/C][C]1369.04136168342[/C][C]2925[/C][/ROW]
[ROW][C]16[/C][C]26225.5[/C][C]1002.05073058537[/C][C]2321[/C][/ROW]
[ROW][C]17[/C][C]30881.75[/C][C]1062.77698350438[/C][C]2276[/C][/ROW]
[ROW][C]18[/C][C]32115.25[/C][C]1268.58829018717[/C][C]2788[/C][/ROW]
[/TABLE]
Source: https://freestatistics.org/blog/index.php?pk=121265&T=1

Globally Unique Identifier (entire table): ba.freestatistics.org/blog/index.php?pk=121265&T=1

As an alternative you can also use a QR Code:  

The GUIDs for individual cells are displayed in the table below:

Standard Deviation-Mean Plot
SectionMeanStandard DeviationRange
110518105.157025442906239
211213344.022286099801749
312845.25778.7354600033741848
415091.5633.0426525914351461
516030.25785.0861417704431896
615261295.144032634915694
716006.5332.966965328394769
815731.75145.866091558891343
917227.75618.8238171456131307
1019558.5736.2452037195221564
1118522.25465.584489289181099
1219243549.6526175685881167
13222941221.985542740452765
1421638.75256.700051941301545
1523507.251369.041361683422925
1626225.51002.050730585372321
1730881.751062.776983504382276
1832115.251268.588290187172788


Regression: S.E.(k) = alpha + beta * Mean(k)
alpha-224.807941445433
beta0.0465760067163053
S.D.0.0111003606801798
T-STAT4.19590030074149
p-value0.000684336831869554

\begin{tabular}{lllllllll}
\hline
Regression: S.E.(k) = alpha + beta * Mean(k) \tabularnewline
alpha & -224.807941445433 \tabularnewline
beta & 0.0465760067163053 \tabularnewline
S.D. & 0.0111003606801798 \tabularnewline
T-STAT & 4.19590030074149 \tabularnewline
p-value & 0.000684336831869554 \tabularnewline
\hline
\end{tabular}
%Source: https://freestatistics.org/blog/index.php?pk=121265&T=2

[TABLE]
[ROW][C]Regression: S.E.(k) = alpha + beta * Mean(k)[/C][/ROW]
[ROW][C]alpha[/C][C]-224.807941445433[/C][/ROW]
[ROW][C]beta[/C][C]0.0465760067163053[/C][/ROW]
[ROW][C]S.D.[/C][C]0.0111003606801798[/C][/ROW]
[ROW][C]T-STAT[/C][C]4.19590030074149[/C][/ROW]
[ROW][C]p-value[/C][C]0.000684336831869554[/C][/ROW]
[/TABLE]
Source: https://freestatistics.org/blog/index.php?pk=121265&T=2

Globally Unique Identifier (entire table): ba.freestatistics.org/blog/index.php?pk=121265&T=2

As an alternative you can also use a QR Code:  

The GUIDs for individual cells are displayed in the table below:

Regression: S.E.(k) = alpha + beta * Mean(k)
alpha-224.807941445433
beta0.0465760067163053
S.D.0.0111003606801798
T-STAT4.19590030074149
p-value0.000684336831869554


Regression: ln S.E.(k) = alpha + beta * ln Mean(k)
alpha-9.2407704893113
beta1.58244866471027
S.D.0.439256550953785
T-STAT3.60256133067158
p-value0.0023862656525937
Lambda-0.582448664710274

\begin{tabular}{lllllllll}
\hline
Regression: ln S.E.(k) = alpha + beta * ln Mean(k) \tabularnewline
alpha & -9.2407704893113 \tabularnewline
beta & 1.58244866471027 \tabularnewline
S.D. & 0.439256550953785 \tabularnewline
T-STAT & 3.60256133067158 \tabularnewline
p-value & 0.0023862656525937 \tabularnewline
Lambda & -0.582448664710274 \tabularnewline
\hline
\end{tabular}
%Source: https://freestatistics.org/blog/index.php?pk=121265&T=3

[TABLE]
[ROW][C]Regression: ln S.E.(k) = alpha + beta * ln Mean(k)[/C][/ROW]
[ROW][C]alpha[/C][C]-9.2407704893113[/C][/ROW]
[ROW][C]beta[/C][C]1.58244866471027[/C][/ROW]
[ROW][C]S.D.[/C][C]0.439256550953785[/C][/ROW]
[ROW][C]T-STAT[/C][C]3.60256133067158[/C][/ROW]
[ROW][C]p-value[/C][C]0.0023862656525937[/C][/ROW]
[ROW][C]Lambda[/C][C]-0.582448664710274[/C][/ROW]
[/TABLE]
Source: https://freestatistics.org/blog/index.php?pk=121265&T=3

Globally Unique Identifier (entire table): ba.freestatistics.org/blog/index.php?pk=121265&T=3

As an alternative you can also use a QR Code:  

The GUIDs for individual cells are displayed in the table below:

Regression: ln S.E.(k) = alpha + beta * ln Mean(k)
alpha-9.2407704893113
beta1.58244866471027
S.D.0.439256550953785
T-STAT3.60256133067158
p-value0.0023862656525937
Lambda-0.582448664710274


Parameters (Session):
par1 = 4 ;
Parameters (R input):
par1 = 4 ;
R code (references can be found in the software module):
par1 <- as.numeric(par1)
(n <- length(x))
(np <- floor(n / par1))
arr <- array(NA,dim=c(par1,np))
j <- 0
k <- 1
for (i in 1:(np*par1))
{
j = j + 1
arr[j,k] <- x[i]
if (j == par1) {
j = 0
k=k+1
}
}
arr
arr.mean <- array(NA,dim=np)
arr.sd <- array(NA,dim=np)
arr.range <- array(NA,dim=np)
for (j in 1:np)
{
arr.mean[j] <- mean(arr[,j],na.rm=TRUE)
arr.sd[j] <- sd(arr[,j],na.rm=TRUE)
arr.range[j] <- max(arr[,j],na.rm=TRUE) - min(arr[,j],na.rm=TRUE)
}
arr.mean
arr.sd
arr.range
(lm1 <- lm(arr.sd~arr.mean))
(lnlm1 <- lm(log(arr.sd)~log(arr.mean)))
(lm2 <- lm(arr.range~arr.mean))
bitmap(file='test1.png')
plot(arr.mean,arr.sd,main='Standard Deviation-Mean Plot',xlab='mean',ylab='standard deviation')
dev.off()
bitmap(file='test2.png')
plot(arr.mean,arr.range,main='Range-Mean Plot',xlab='mean',ylab='range')
dev.off()
load(file='createtable')
a<-table.start()
a<-table.row.start(a)
a<-table.element(a,'Standard Deviation-Mean Plot',4,TRUE)
a<-table.row.end(a)
a<-table.row.start(a)
a<-table.element(a,'Section',header=TRUE)
a<-table.element(a,'Mean',header=TRUE)
a<-table.element(a,'Standard Deviation',header=TRUE)
a<-table.element(a,'Range',header=TRUE)
a<-table.row.end(a)
for (j in 1:np) {
a<-table.row.start(a)
a<-table.element(a,j,header=TRUE)
a<-table.element(a,arr.mean[j])
a<-table.element(a,arr.sd[j] )
a<-table.element(a,arr.range[j] )
a<-table.row.end(a)
}
a<-table.end(a)
table.save(a,file='mytable.tab')
a<-table.start()
a<-table.row.start(a)
a<-table.element(a,'Regression: S.E.(k) = alpha + beta * Mean(k)',2,TRUE)
a<-table.row.end(a)
a<-table.row.start(a)
a<-table.element(a,'alpha',header=TRUE)
a<-table.element(a,lm1$coefficients[[1]])
a<-table.row.end(a)
a<-table.row.start(a)
a<-table.element(a,'beta',header=TRUE)
a<-table.element(a,lm1$coefficients[[2]])
a<-table.row.end(a)
a<-table.row.start(a)
a<-table.element(a,'S.D.',header=TRUE)
a<-table.element(a,summary(lm1)$coefficients[2,2])
a<-table.row.end(a)
a<-table.row.start(a)
a<-table.element(a,'T-STAT',header=TRUE)
a<-table.element(a,summary(lm1)$coefficients[2,3])
a<-table.row.end(a)
a<-table.row.start(a)
a<-table.element(a,'p-value',header=TRUE)
a<-table.element(a,summary(lm1)$coefficients[2,4])
a<-table.row.end(a)
a<-table.end(a)
table.save(a,file='mytable1.tab')
a<-table.start()
a<-table.row.start(a)
a<-table.element(a,'Regression: ln S.E.(k) = alpha + beta * ln Mean(k)',2,TRUE)
a<-table.row.end(a)
a<-table.row.start(a)
a<-table.element(a,'alpha',header=TRUE)
a<-table.element(a,lnlm1$coefficients[[1]])
a<-table.row.end(a)
a<-table.row.start(a)
a<-table.element(a,'beta',header=TRUE)
a<-table.element(a,lnlm1$coefficients[[2]])
a<-table.row.end(a)
a<-table.row.start(a)
a<-table.element(a,'S.D.',header=TRUE)
a<-table.element(a,summary(lnlm1)$coefficients[2,2])
a<-table.row.end(a)
a<-table.row.start(a)
a<-table.element(a,'T-STAT',header=TRUE)
a<-table.element(a,summary(lnlm1)$coefficients[2,3])
a<-table.row.end(a)
a<-table.row.start(a)
a<-table.element(a,'p-value',header=TRUE)
a<-table.element(a,summary(lnlm1)$coefficients[2,4])
a<-table.row.end(a)
a<-table.row.start(a)
a<-table.element(a,'Lambda',header=TRUE)
a<-table.element(a,1-lnlm1$coefficients[[2]])
a<-table.row.end(a)
a<-table.end(a)
table.save(a,file='mytable2.tab')