Free Statistics

of Irreproducible Research!

Author's title

Opdracht 8 IKO - Bouwvergunningen - standard deviation-Mean plot - Nathan J...

Author*Unverified author*
R Software Modulerwasp_smp.wasp
Title produced by softwareStandard Deviation-Mean Plot
Date of computationMon, 09 May 2011 08:54:40 +0000
Cite this page as followsStatistical Computations at FreeStatistics.org, Office for Research Development and Education, URL https://freestatistics.org/blog/index.php?v=date/2011/May/09/t13049310837b65u2rayqo4a73.htm/, Retrieved Tue, 14 May 2024 16:19:38 +0000
Statistical Computations at FreeStatistics.org, Office for Research Development and Education, URL https://freestatistics.org/blog/index.php?pk=121225, Retrieved Tue, 14 May 2024 16:19:38 +0000
QR Codes:

Original text written by user:
IsPrivate?No (this computation is public)
User-defined keywordsKDGP2W83
Estimated Impact134
Family? (F = Feedback message, R = changed R code, M = changed R Module, P = changed Parameters, D = changed Data)
-       [Standard Deviation-Mean Plot] [Opdracht 8 IKO - ...] [2011-05-09 08:54:40] [fed4ddbd9eb0782ff87cd8e1cc4aa0f9] [Current]
Feedback Forum

Post a new message
Dataseries X:
1394
1657
2411
3595
3336
3249
2920
2113
2040
1853
1832
2093
2164
2368
2072
2521
1819
1947
2226
1754
1787
2072
1846
2137
2467
2154
2289
2628
2074
2798
2194
2442
2565
2063
2069
2539
1898
2139
2408
2725
2201
2311
2548
2276
2351
2280
2057
2479
2379
2295
2456
2546
2844
2260
2981
2678
3440
2842
2450
2669
2570
2540
2318
2930
2947
2799
2695
2498
2260
2160
2058
2533
2150
2172
2155
3016
2333
2355
2825
2214
2360
2299
1746
2069
2267
1878
2266
2282
2085
2277
2251
1828
1954
1851
1570
1852
2187
1855
2218


Summary of computational transaction
Raw Inputview raw input (R code)
Raw Outputview raw output of R engine
Computing time2 seconds
R Server'Gwilym Jenkins' @ www.wessa.org

\begin{tabular}{lllllllll}
\hline
Summary of computational transaction \tabularnewline
Raw Input & view raw input (R code)  \tabularnewline
Raw Output & view raw output of R engine  \tabularnewline
Computing time & 2 seconds \tabularnewline
R Server & 'Gwilym Jenkins' @ www.wessa.org \tabularnewline
\hline
\end{tabular}
%Source: https://freestatistics.org/blog/index.php?pk=121225&T=0

[TABLE]
[ROW][C]Summary of computational transaction[/C][/ROW]
[ROW][C]Raw Input[/C][C]view raw input (R code) [/C][/ROW]
[ROW][C]Raw Output[/C][C]view raw output of R engine [/C][/ROW]
[ROW][C]Computing time[/C][C]2 seconds[/C][/ROW]
[ROW][C]R Server[/C][C]'Gwilym Jenkins' @ www.wessa.org[/C][/ROW]
[/TABLE]
Source: https://freestatistics.org/blog/index.php?pk=121225&T=0

Globally Unique Identifier (entire table): ba.freestatistics.org/blog/index.php?pk=121225&T=0

As an alternative you can also use a QR Code:  

The GUIDs for individual cells are displayed in the table below:

Summary of computational transaction
Raw Inputview raw input (R code)
Raw Outputview raw output of R engine
Computing time2 seconds
R Server'Gwilym Jenkins' @ www.wessa.org


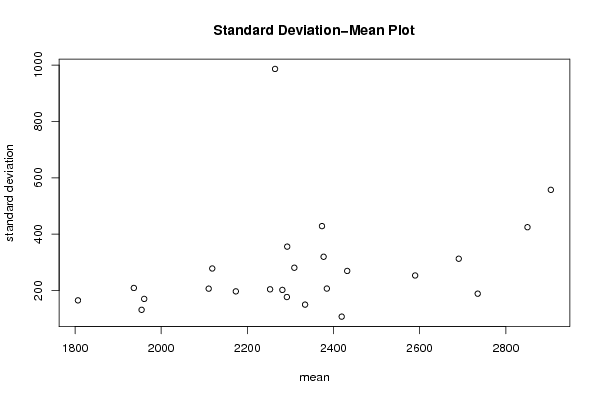
Standard Deviation-Mean Plot
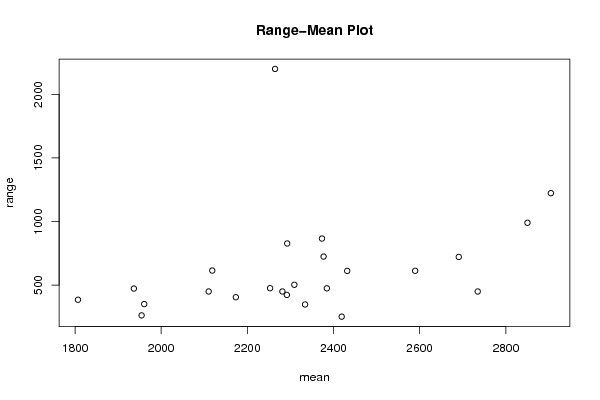
SectionMeanStandard DeviationRange
12264.25986.3263067227462201
22904.5557.2506916400671223
31954.5131.403957322449261
42281.25202.104552150613449
51936.5208.992025366201472
61960.5170.095071455152350
72384.5206.840518274346474
82377319.77283603625724
92309280.803608713753502
102292.5355.710087946163827
112334149.864383138347
122291.75176.841501539279422
132419107.197636789872251
142690.75312.750566213183721
152850.25424.627189426207990
162589.5253.30021713374612
172734.75188.687351634037449
182252.75204.224345594088475
192373.25428.603449200618866
202431.75269.383710222674611
212118.5278.15403406506614
222173.25196.969329253736404
232110.25206.493543079035449
241806.75165.064381378903384

\begin{tabular}{lllllllll}
\hline
Standard Deviation-Mean Plot \tabularnewline
Section & Mean & Standard Deviation & Range \tabularnewline
1 & 2264.25 & 986.326306722746 & 2201 \tabularnewline
2 & 2904.5 & 557.250691640067 & 1223 \tabularnewline
3 & 1954.5 & 131.403957322449 & 261 \tabularnewline
4 & 2281.25 & 202.104552150613 & 449 \tabularnewline
5 & 1936.5 & 208.992025366201 & 472 \tabularnewline
6 & 1960.5 & 170.095071455152 & 350 \tabularnewline
7 & 2384.5 & 206.840518274346 & 474 \tabularnewline
8 & 2377 & 319.77283603625 & 724 \tabularnewline
9 & 2309 & 280.803608713753 & 502 \tabularnewline
10 & 2292.5 & 355.710087946163 & 827 \tabularnewline
11 & 2334 & 149.864383138 & 347 \tabularnewline
12 & 2291.75 & 176.841501539279 & 422 \tabularnewline
13 & 2419 & 107.197636789872 & 251 \tabularnewline
14 & 2690.75 & 312.750566213183 & 721 \tabularnewline
15 & 2850.25 & 424.627189426207 & 990 \tabularnewline
16 & 2589.5 & 253.30021713374 & 612 \tabularnewline
17 & 2734.75 & 188.687351634037 & 449 \tabularnewline
18 & 2252.75 & 204.224345594088 & 475 \tabularnewline
19 & 2373.25 & 428.603449200618 & 866 \tabularnewline
20 & 2431.75 & 269.383710222674 & 611 \tabularnewline
21 & 2118.5 & 278.15403406506 & 614 \tabularnewline
22 & 2173.25 & 196.969329253736 & 404 \tabularnewline
23 & 2110.25 & 206.493543079035 & 449 \tabularnewline
24 & 1806.75 & 165.064381378903 & 384 \tabularnewline
\hline
\end{tabular}
%Source: https://freestatistics.org/blog/index.php?pk=121225&T=1

[TABLE]
[ROW][C]Standard Deviation-Mean Plot[/C][/ROW]
[ROW][C]Section[/C][C]Mean[/C][C]Standard Deviation[/C][C]Range[/C][/ROW]
[ROW][C]1[/C][C]2264.25[/C][C]986.326306722746[/C][C]2201[/C][/ROW]
[ROW][C]2[/C][C]2904.5[/C][C]557.250691640067[/C][C]1223[/C][/ROW]
[ROW][C]3[/C][C]1954.5[/C][C]131.403957322449[/C][C]261[/C][/ROW]
[ROW][C]4[/C][C]2281.25[/C][C]202.104552150613[/C][C]449[/C][/ROW]
[ROW][C]5[/C][C]1936.5[/C][C]208.992025366201[/C][C]472[/C][/ROW]
[ROW][C]6[/C][C]1960.5[/C][C]170.095071455152[/C][C]350[/C][/ROW]
[ROW][C]7[/C][C]2384.5[/C][C]206.840518274346[/C][C]474[/C][/ROW]
[ROW][C]8[/C][C]2377[/C][C]319.77283603625[/C][C]724[/C][/ROW]
[ROW][C]9[/C][C]2309[/C][C]280.803608713753[/C][C]502[/C][/ROW]
[ROW][C]10[/C][C]2292.5[/C][C]355.710087946163[/C][C]827[/C][/ROW]
[ROW][C]11[/C][C]2334[/C][C]149.864383138[/C][C]347[/C][/ROW]
[ROW][C]12[/C][C]2291.75[/C][C]176.841501539279[/C][C]422[/C][/ROW]
[ROW][C]13[/C][C]2419[/C][C]107.197636789872[/C][C]251[/C][/ROW]
[ROW][C]14[/C][C]2690.75[/C][C]312.750566213183[/C][C]721[/C][/ROW]
[ROW][C]15[/C][C]2850.25[/C][C]424.627189426207[/C][C]990[/C][/ROW]
[ROW][C]16[/C][C]2589.5[/C][C]253.30021713374[/C][C]612[/C][/ROW]
[ROW][C]17[/C][C]2734.75[/C][C]188.687351634037[/C][C]449[/C][/ROW]
[ROW][C]18[/C][C]2252.75[/C][C]204.224345594088[/C][C]475[/C][/ROW]
[ROW][C]19[/C][C]2373.25[/C][C]428.603449200618[/C][C]866[/C][/ROW]
[ROW][C]20[/C][C]2431.75[/C][C]269.383710222674[/C][C]611[/C][/ROW]
[ROW][C]21[/C][C]2118.5[/C][C]278.15403406506[/C][C]614[/C][/ROW]
[ROW][C]22[/C][C]2173.25[/C][C]196.969329253736[/C][C]404[/C][/ROW]
[ROW][C]23[/C][C]2110.25[/C][C]206.493543079035[/C][C]449[/C][/ROW]
[ROW][C]24[/C][C]1806.75[/C][C]165.064381378903[/C][C]384[/C][/ROW]
[/TABLE]
Source: https://freestatistics.org/blog/index.php?pk=121225&T=1

Globally Unique Identifier (entire table): ba.freestatistics.org/blog/index.php?pk=121225&T=1

As an alternative you can also use a QR Code:  

The GUIDs for individual cells are displayed in the table below:

Standard Deviation-Mean Plot
SectionMeanStandard DeviationRange
12264.25986.3263067227462201
22904.5557.2506916400671223
31954.5131.403957322449261
42281.25202.104552150613449
51936.5208.992025366201472
61960.5170.095071455152350
72384.5206.840518274346474
82377319.77283603625724
92309280.803608713753502
102292.5355.710087946163827
112334149.864383138347
122291.75176.841501539279422
132419107.197636789872251
142690.75312.750566213183721
152850.25424.627189426207990
162589.5253.30021713374612
172734.75188.687351634037449
182252.75204.224345594088475
192373.25428.603449200618866
202431.75269.383710222674611
212118.5278.15403406506614
222173.25196.969329253736404
232110.25206.493543079035449
241806.75165.064381378903384


Regression: S.E.(k) = alpha + beta * Mean(k)
alpha-186.555791307553
beta0.201622468897001
S.D.0.13208791500896
T-STAT1.52642631147085
p-value0.141153233455201

\begin{tabular}{lllllllll}
\hline
Regression: S.E.(k) = alpha + beta * Mean(k) \tabularnewline
alpha & -186.555791307553 \tabularnewline
beta & 0.201622468897001 \tabularnewline
S.D. & 0.13208791500896 \tabularnewline
T-STAT & 1.52642631147085 \tabularnewline
p-value & 0.141153233455201 \tabularnewline
\hline
\end{tabular}
%Source: https://freestatistics.org/blog/index.php?pk=121225&T=2

[TABLE]
[ROW][C]Regression: S.E.(k) = alpha + beta * Mean(k)[/C][/ROW]
[ROW][C]alpha[/C][C]-186.555791307553[/C][/ROW]
[ROW][C]beta[/C][C]0.201622468897001[/C][/ROW]
[ROW][C]S.D.[/C][C]0.13208791500896[/C][/ROW]
[ROW][C]T-STAT[/C][C]1.52642631147085[/C][/ROW]
[ROW][C]p-value[/C][C]0.141153233455201[/C][/ROW]
[/TABLE]
Source: https://freestatistics.org/blog/index.php?pk=121225&T=2

Globally Unique Identifier (entire table): ba.freestatistics.org/blog/index.php?pk=121225&T=2

As an alternative you can also use a QR Code:  

The GUIDs for individual cells are displayed in the table below:

Regression: S.E.(k) = alpha + beta * Mean(k)
alpha-186.555791307553
beta0.201622468897001
S.D.0.13208791500896
T-STAT1.52642631147085
p-value0.141153233455201


Regression: ln S.E.(k) = alpha + beta * ln Mean(k)
alpha-7.52722859266762
beta1.68330940247369
S.D.0.786292278552138
T-STAT2.14081894022068
p-value0.0436226715360495
Lambda-0.683309402473693

\begin{tabular}{lllllllll}
\hline
Regression: ln S.E.(k) = alpha + beta * ln Mean(k) \tabularnewline
alpha & -7.52722859266762 \tabularnewline
beta & 1.68330940247369 \tabularnewline
S.D. & 0.786292278552138 \tabularnewline
T-STAT & 2.14081894022068 \tabularnewline
p-value & 0.0436226715360495 \tabularnewline
Lambda & -0.683309402473693 \tabularnewline
\hline
\end{tabular}
%Source: https://freestatistics.org/blog/index.php?pk=121225&T=3

[TABLE]
[ROW][C]Regression: ln S.E.(k) = alpha + beta * ln Mean(k)[/C][/ROW]
[ROW][C]alpha[/C][C]-7.52722859266762[/C][/ROW]
[ROW][C]beta[/C][C]1.68330940247369[/C][/ROW]
[ROW][C]S.D.[/C][C]0.786292278552138[/C][/ROW]
[ROW][C]T-STAT[/C][C]2.14081894022068[/C][/ROW]
[ROW][C]p-value[/C][C]0.0436226715360495[/C][/ROW]
[ROW][C]Lambda[/C][C]-0.683309402473693[/C][/ROW]
[/TABLE]
Source: https://freestatistics.org/blog/index.php?pk=121225&T=3

Globally Unique Identifier (entire table): ba.freestatistics.org/blog/index.php?pk=121225&T=3

As an alternative you can also use a QR Code:  

The GUIDs for individual cells are displayed in the table below:

Regression: ln S.E.(k) = alpha + beta * ln Mean(k)
alpha-7.52722859266762
beta1.68330940247369
S.D.0.786292278552138
T-STAT2.14081894022068
p-value0.0436226715360495
Lambda-0.683309402473693


Parameters (Session):
par1 = 4 ;
Parameters (R input):
par1 = 4 ;
R code (references can be found in the software module):
par1 <- as.numeric(par1)
(n <- length(x))
(np <- floor(n / par1))
arr <- array(NA,dim=c(par1,np))
j <- 0
k <- 1
for (i in 1:(np*par1))
{
j = j + 1
arr[j,k] <- x[i]
if (j == par1) {
j = 0
k=k+1
}
}
arr
arr.mean <- array(NA,dim=np)
arr.sd <- array(NA,dim=np)
arr.range <- array(NA,dim=np)
for (j in 1:np)
{
arr.mean[j] <- mean(arr[,j],na.rm=TRUE)
arr.sd[j] <- sd(arr[,j],na.rm=TRUE)
arr.range[j] <- max(arr[,j],na.rm=TRUE) - min(arr[,j],na.rm=TRUE)
}
arr.mean
arr.sd
arr.range
(lm1 <- lm(arr.sd~arr.mean))
(lnlm1 <- lm(log(arr.sd)~log(arr.mean)))
(lm2 <- lm(arr.range~arr.mean))
bitmap(file='test1.png')
plot(arr.mean,arr.sd,main='Standard Deviation-Mean Plot',xlab='mean',ylab='standard deviation')
dev.off()
bitmap(file='test2.png')
plot(arr.mean,arr.range,main='Range-Mean Plot',xlab='mean',ylab='range')
dev.off()
load(file='createtable')
a<-table.start()
a<-table.row.start(a)
a<-table.element(a,'Standard Deviation-Mean Plot',4,TRUE)
a<-table.row.end(a)
a<-table.row.start(a)
a<-table.element(a,'Section',header=TRUE)
a<-table.element(a,'Mean',header=TRUE)
a<-table.element(a,'Standard Deviation',header=TRUE)
a<-table.element(a,'Range',header=TRUE)
a<-table.row.end(a)
for (j in 1:np) {
a<-table.row.start(a)
a<-table.element(a,j,header=TRUE)
a<-table.element(a,arr.mean[j])
a<-table.element(a,arr.sd[j] )
a<-table.element(a,arr.range[j] )
a<-table.row.end(a)
}
a<-table.end(a)
table.save(a,file='mytable.tab')
a<-table.start()
a<-table.row.start(a)
a<-table.element(a,'Regression: S.E.(k) = alpha + beta * Mean(k)',2,TRUE)
a<-table.row.end(a)
a<-table.row.start(a)
a<-table.element(a,'alpha',header=TRUE)
a<-table.element(a,lm1$coefficients[[1]])
a<-table.row.end(a)
a<-table.row.start(a)
a<-table.element(a,'beta',header=TRUE)
a<-table.element(a,lm1$coefficients[[2]])
a<-table.row.end(a)
a<-table.row.start(a)
a<-table.element(a,'S.D.',header=TRUE)
a<-table.element(a,summary(lm1)$coefficients[2,2])
a<-table.row.end(a)
a<-table.row.start(a)
a<-table.element(a,'T-STAT',header=TRUE)
a<-table.element(a,summary(lm1)$coefficients[2,3])
a<-table.row.end(a)
a<-table.row.start(a)
a<-table.element(a,'p-value',header=TRUE)
a<-table.element(a,summary(lm1)$coefficients[2,4])
a<-table.row.end(a)
a<-table.end(a)
table.save(a,file='mytable1.tab')
a<-table.start()
a<-table.row.start(a)
a<-table.element(a,'Regression: ln S.E.(k) = alpha + beta * ln Mean(k)',2,TRUE)
a<-table.row.end(a)
a<-table.row.start(a)
a<-table.element(a,'alpha',header=TRUE)
a<-table.element(a,lnlm1$coefficients[[1]])
a<-table.row.end(a)
a<-table.row.start(a)
a<-table.element(a,'beta',header=TRUE)
a<-table.element(a,lnlm1$coefficients[[2]])
a<-table.row.end(a)
a<-table.row.start(a)
a<-table.element(a,'S.D.',header=TRUE)
a<-table.element(a,summary(lnlm1)$coefficients[2,2])
a<-table.row.end(a)
a<-table.row.start(a)
a<-table.element(a,'T-STAT',header=TRUE)
a<-table.element(a,summary(lnlm1)$coefficients[2,3])
a<-table.row.end(a)
a<-table.row.start(a)
a<-table.element(a,'p-value',header=TRUE)
a<-table.element(a,summary(lnlm1)$coefficients[2,4])
a<-table.row.end(a)
a<-table.row.start(a)
a<-table.element(a,'Lambda',header=TRUE)
a<-table.element(a,1-lnlm1$coefficients[[2]])
a<-table.row.end(a)
a<-table.end(a)
table.save(a,file='mytable2.tab')