Free Statistics

of Irreproducible Research!

Author's title

Author*Unverified author*
R Software Modulerwasp_smp.wasp
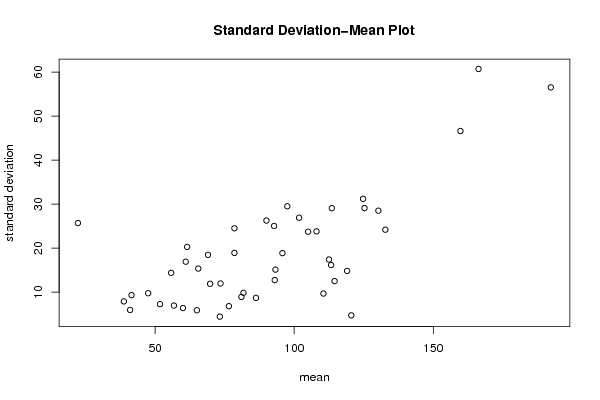
Title produced by softwareStandard Deviation-Mean Plot
Date of computationFri, 06 May 2011 12:15:16 +0000
Cite this page as followsStatistical Computations at FreeStatistics.org, Office for Research Development and Education, URL https://freestatistics.org/blog/index.php?v=date/2011/May/06/t1304683912m6kkya8ozs7c4us.htm/, Retrieved Sun, 12 May 2024 23:05:33 +0000
Statistical Computations at FreeStatistics.org, Office for Research Development and Education, URL https://freestatistics.org/blog/index.php?pk=121157, Retrieved Sun, 12 May 2024 23:05:33 +0000
QR Codes:

Original text written by user:
IsPrivate?No (this computation is public)
User-defined keywordsKDGP2W83
Estimated Impact167
Family? (F = Feedback message, R = changed R code, M = changed R Module, P = changed Parameters, D = changed Data)
-       [Standard Deviation-Mean Plot] [Standard Deviatio...] [2011-05-06 12:15:16] [693533e1fc7e34c5ef37684486948ac1] [Current]
Feedback Forum

Post a new message
Dataseries X:
112
118
129
99
116
168
118
129
205
147
150
267
126
129
124
97
102
127
222
214
118
141
154
226
89
77
82
97
127
121
117
117
106
112
134
169
75
108
115
85
101
108
109
124
105
95
135
164
88
85
112
87
91
87
87
142
95
108
139
159
61
82
124
93
108
75
87
103
90
108
123
129
57
65
67
71
76
67
110
118
99
85
107
141
58
65
70
86
93
74
87
73
101
100
96
157
63
115
70
66
67
83
79
77
102
116
100
135
71
60
89
74
73
91
86
74
87
87
109
137
43
69
73
77
69
76
78
70
83
65
110
132
54
55
66
65
60
65
96
55
71
63
74
106
34
47
56
53
53
55
67
52
46
51
58
91
33
40
46
45
41
55
57
54
46
52
48
77
30
35
42
48
44
45
0
0
46
51
63
84
30
39
45
52
28
40
62


Summary of computational transaction
Raw Inputview raw input (R code)
Raw Outputview raw output of R engine
Computing time1 seconds
R Server'Gwilym Jenkins' @ www.wessa.org

\begin{tabular}{lllllllll}
\hline
Summary of computational transaction \tabularnewline
Raw Input & view raw input (R code)  \tabularnewline
Raw Output & view raw output of R engine  \tabularnewline
Computing time & 1 seconds \tabularnewline
R Server & 'Gwilym Jenkins' @ www.wessa.org \tabularnewline
\hline
\end{tabular}
%Source: https://freestatistics.org/blog/index.php?pk=121157&T=0

[TABLE]
[ROW][C]Summary of computational transaction[/C][/ROW]
[ROW][C]Raw Input[/C][C]view raw input (R code) [/C][/ROW]
[ROW][C]Raw Output[/C][C]view raw output of R engine [/C][/ROW]
[ROW][C]Computing time[/C][C]1 seconds[/C][/ROW]
[ROW][C]R Server[/C][C]'Gwilym Jenkins' @ www.wessa.org[/C][/ROW]
[/TABLE]
Source: https://freestatistics.org/blog/index.php?pk=121157&T=0

Globally Unique Identifier (entire table): ba.freestatistics.org/blog/index.php?pk=121157&T=0

As an alternative you can also use a QR Code:  

The GUIDs for individual cells are displayed in the table below:

Summary of computational transaction
Raw Inputview raw input (R code)
Raw Outputview raw output of R engine
Computing time1 seconds
R Server'Gwilym Jenkins' @ www.wessa.org


Standard Deviation-Mean Plot
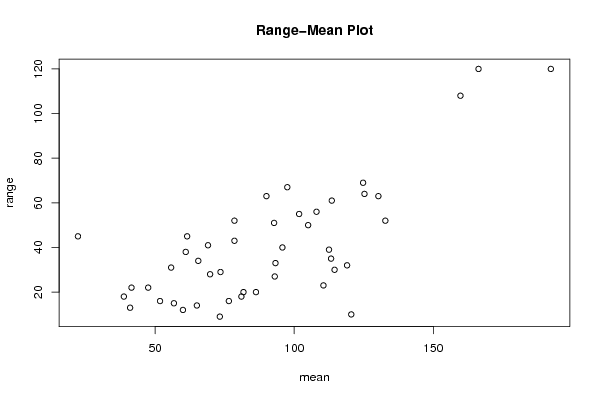
SectionMeanStandard DeviationRange
1114.512.503332889007430
2132.7524.185050478894352
3192.2556.5176963437117120
411914.809906594348732
5166.2560.7090053726244120
6159.7546.6074028454708108
786.258.6938675704966520
8120.54.7258156262526110
9130.2528.563
1095.7518.856917386819440
11110.59.6781540939719823
12124.7531.20229692399869
139312.727922061357927
14101.7526.899504332484155
15125.2529.101832702884364
169026.267851073127463
1793.2515.107944929738133
18112.517.406895185529239
19655.887840577551914
2092.7525.024987512484451
2110823.804761428476256
2269.7511.898879499067728
2381.759.8446262837482420
24113.529.080348461919561
2578.524.501700621249452
2676.56.8068592855540516
27113.2516.152915113584535
2873.511.958260743101429
29818.9069261439249218
3010523.720595832876350
3165.515.351438586225934
3273.254.425306015783929
3397.529.512709126747467
34606.3770421565696612
356918.457157599876241
3678.518.912077270005743
3747.59.7467943448089622
3856.756.946221994724915
3961.520.273134932713345
40415.9441848333756713
4151.757.2743842809317316
4255.7514.384598244882231
4338.757.8898669190297518
4422.2525.695330315059245
456116.911534525287838
4641.59.3273790530888222

\begin{tabular}{lllllllll}
\hline
Standard Deviation-Mean Plot \tabularnewline
Section & Mean & Standard Deviation & Range \tabularnewline
1 & 114.5 & 12.5033328890074 & 30 \tabularnewline
2 & 132.75 & 24.1850504788943 & 52 \tabularnewline
3 & 192.25 & 56.5176963437117 & 120 \tabularnewline
4 & 119 & 14.8099065943487 & 32 \tabularnewline
5 & 166.25 & 60.7090053726244 & 120 \tabularnewline
6 & 159.75 & 46.6074028454708 & 108 \tabularnewline
7 & 86.25 & 8.69386757049665 & 20 \tabularnewline
8 & 120.5 & 4.72581562625261 & 10 \tabularnewline
9 & 130.25 & 28.5 & 63 \tabularnewline
10 & 95.75 & 18.8569173868194 & 40 \tabularnewline
11 & 110.5 & 9.67815409397198 & 23 \tabularnewline
12 & 124.75 & 31.202296923998 & 69 \tabularnewline
13 & 93 & 12.7279220613579 & 27 \tabularnewline
14 & 101.75 & 26.8995043324841 & 55 \tabularnewline
15 & 125.25 & 29.1018327028843 & 64 \tabularnewline
16 & 90 & 26.2678510731274 & 63 \tabularnewline
17 & 93.25 & 15.1079449297381 & 33 \tabularnewline
18 & 112.5 & 17.4068951855292 & 39 \tabularnewline
19 & 65 & 5.8878405775519 & 14 \tabularnewline
20 & 92.75 & 25.0249875124844 & 51 \tabularnewline
21 & 108 & 23.8047614284762 & 56 \tabularnewline
22 & 69.75 & 11.8988794990677 & 28 \tabularnewline
23 & 81.75 & 9.84462628374824 & 20 \tabularnewline
24 & 113.5 & 29.0803484619195 & 61 \tabularnewline
25 & 78.5 & 24.5017006212494 & 52 \tabularnewline
26 & 76.5 & 6.80685928555405 & 16 \tabularnewline
27 & 113.25 & 16.1529151135845 & 35 \tabularnewline
28 & 73.5 & 11.9582607431014 & 29 \tabularnewline
29 & 81 & 8.90692614392492 & 18 \tabularnewline
30 & 105 & 23.7205958328763 & 50 \tabularnewline
31 & 65.5 & 15.3514385862259 & 34 \tabularnewline
32 & 73.25 & 4.42530601578392 & 9 \tabularnewline
33 & 97.5 & 29.5127091267474 & 67 \tabularnewline
34 & 60 & 6.37704215656966 & 12 \tabularnewline
35 & 69 & 18.4571575998762 & 41 \tabularnewline
36 & 78.5 & 18.9120772700057 & 43 \tabularnewline
37 & 47.5 & 9.74679434480896 & 22 \tabularnewline
38 & 56.75 & 6.9462219947249 & 15 \tabularnewline
39 & 61.5 & 20.2731349327133 & 45 \tabularnewline
40 & 41 & 5.94418483337567 & 13 \tabularnewline
41 & 51.75 & 7.27438428093173 & 16 \tabularnewline
42 & 55.75 & 14.3845982448822 & 31 \tabularnewline
43 & 38.75 & 7.88986691902975 & 18 \tabularnewline
44 & 22.25 & 25.6953303150592 & 45 \tabularnewline
45 & 61 & 16.9115345252878 & 38 \tabularnewline
46 & 41.5 & 9.32737905308882 & 22 \tabularnewline
\hline
\end{tabular}
%Source: https://freestatistics.org/blog/index.php?pk=121157&T=1

[TABLE]
[ROW][C]Standard Deviation-Mean Plot[/C][/ROW]
[ROW][C]Section[/C][C]Mean[/C][C]Standard Deviation[/C][C]Range[/C][/ROW]
[ROW][C]1[/C][C]114.5[/C][C]12.5033328890074[/C][C]30[/C][/ROW]
[ROW][C]2[/C][C]132.75[/C][C]24.1850504788943[/C][C]52[/C][/ROW]
[ROW][C]3[/C][C]192.25[/C][C]56.5176963437117[/C][C]120[/C][/ROW]
[ROW][C]4[/C][C]119[/C][C]14.8099065943487[/C][C]32[/C][/ROW]
[ROW][C]5[/C][C]166.25[/C][C]60.7090053726244[/C][C]120[/C][/ROW]
[ROW][C]6[/C][C]159.75[/C][C]46.6074028454708[/C][C]108[/C][/ROW]
[ROW][C]7[/C][C]86.25[/C][C]8.69386757049665[/C][C]20[/C][/ROW]
[ROW][C]8[/C][C]120.5[/C][C]4.72581562625261[/C][C]10[/C][/ROW]
[ROW][C]9[/C][C]130.25[/C][C]28.5[/C][C]63[/C][/ROW]
[ROW][C]10[/C][C]95.75[/C][C]18.8569173868194[/C][C]40[/C][/ROW]
[ROW][C]11[/C][C]110.5[/C][C]9.67815409397198[/C][C]23[/C][/ROW]
[ROW][C]12[/C][C]124.75[/C][C]31.202296923998[/C][C]69[/C][/ROW]
[ROW][C]13[/C][C]93[/C][C]12.7279220613579[/C][C]27[/C][/ROW]
[ROW][C]14[/C][C]101.75[/C][C]26.8995043324841[/C][C]55[/C][/ROW]
[ROW][C]15[/C][C]125.25[/C][C]29.1018327028843[/C][C]64[/C][/ROW]
[ROW][C]16[/C][C]90[/C][C]26.2678510731274[/C][C]63[/C][/ROW]
[ROW][C]17[/C][C]93.25[/C][C]15.1079449297381[/C][C]33[/C][/ROW]
[ROW][C]18[/C][C]112.5[/C][C]17.4068951855292[/C][C]39[/C][/ROW]
[ROW][C]19[/C][C]65[/C][C]5.8878405775519[/C][C]14[/C][/ROW]
[ROW][C]20[/C][C]92.75[/C][C]25.0249875124844[/C][C]51[/C][/ROW]
[ROW][C]21[/C][C]108[/C][C]23.8047614284762[/C][C]56[/C][/ROW]
[ROW][C]22[/C][C]69.75[/C][C]11.8988794990677[/C][C]28[/C][/ROW]
[ROW][C]23[/C][C]81.75[/C][C]9.84462628374824[/C][C]20[/C][/ROW]
[ROW][C]24[/C][C]113.5[/C][C]29.0803484619195[/C][C]61[/C][/ROW]
[ROW][C]25[/C][C]78.5[/C][C]24.5017006212494[/C][C]52[/C][/ROW]
[ROW][C]26[/C][C]76.5[/C][C]6.80685928555405[/C][C]16[/C][/ROW]
[ROW][C]27[/C][C]113.25[/C][C]16.1529151135845[/C][C]35[/C][/ROW]
[ROW][C]28[/C][C]73.5[/C][C]11.9582607431014[/C][C]29[/C][/ROW]
[ROW][C]29[/C][C]81[/C][C]8.90692614392492[/C][C]18[/C][/ROW]
[ROW][C]30[/C][C]105[/C][C]23.7205958328763[/C][C]50[/C][/ROW]
[ROW][C]31[/C][C]65.5[/C][C]15.3514385862259[/C][C]34[/C][/ROW]
[ROW][C]32[/C][C]73.25[/C][C]4.42530601578392[/C][C]9[/C][/ROW]
[ROW][C]33[/C][C]97.5[/C][C]29.5127091267474[/C][C]67[/C][/ROW]
[ROW][C]34[/C][C]60[/C][C]6.37704215656966[/C][C]12[/C][/ROW]
[ROW][C]35[/C][C]69[/C][C]18.4571575998762[/C][C]41[/C][/ROW]
[ROW][C]36[/C][C]78.5[/C][C]18.9120772700057[/C][C]43[/C][/ROW]
[ROW][C]37[/C][C]47.5[/C][C]9.74679434480896[/C][C]22[/C][/ROW]
[ROW][C]38[/C][C]56.75[/C][C]6.9462219947249[/C][C]15[/C][/ROW]
[ROW][C]39[/C][C]61.5[/C][C]20.2731349327133[/C][C]45[/C][/ROW]
[ROW][C]40[/C][C]41[/C][C]5.94418483337567[/C][C]13[/C][/ROW]
[ROW][C]41[/C][C]51.75[/C][C]7.27438428093173[/C][C]16[/C][/ROW]
[ROW][C]42[/C][C]55.75[/C][C]14.3845982448822[/C][C]31[/C][/ROW]
[ROW][C]43[/C][C]38.75[/C][C]7.88986691902975[/C][C]18[/C][/ROW]
[ROW][C]44[/C][C]22.25[/C][C]25.6953303150592[/C][C]45[/C][/ROW]
[ROW][C]45[/C][C]61[/C][C]16.9115345252878[/C][C]38[/C][/ROW]
[ROW][C]46[/C][C]41.5[/C][C]9.32737905308882[/C][C]22[/C][/ROW]
[/TABLE]
Source: https://freestatistics.org/blog/index.php?pk=121157&T=1

Globally Unique Identifier (entire table): ba.freestatistics.org/blog/index.php?pk=121157&T=1

As an alternative you can also use a QR Code:  

The GUIDs for individual cells are displayed in the table below:

Standard Deviation-Mean Plot
SectionMeanStandard DeviationRange
1114.512.503332889007430
2132.7524.185050478894352
3192.2556.5176963437117120
411914.809906594348732
5166.2560.7090053726244120
6159.7546.6074028454708108
786.258.6938675704966520
8120.54.7258156262526110
9130.2528.563
1095.7518.856917386819440
11110.59.6781540939719823
12124.7531.20229692399869
139312.727922061357927
14101.7526.899504332484155
15125.2529.101832702884364
169026.267851073127463
1793.2515.107944929738133
18112.517.406895185529239
19655.887840577551914
2092.7525.024987512484451
2110823.804761428476256
2269.7511.898879499067728
2381.759.8446262837482420
24113.529.080348461919561
2578.524.501700621249452
2676.56.8068592855540516
27113.2516.152915113584535
2873.511.958260743101429
29818.9069261439249218
3010523.720595832876350
3165.515.351438586225934
3273.254.425306015783929
3397.529.512709126747467
34606.3770421565696612
356918.457157599876241
3678.518.912077270005743
3747.59.7467943448089622
3856.756.946221994724915
3961.520.273134932713345
40415.9441848333756713
4151.757.2743842809317316
4255.7514.384598244882231
4338.757.8898669190297518
4422.2525.695330315059245
456116.911534525287838
4641.59.3273790530888222


Regression: S.E.(k) = alpha + beta * Mean(k)
alpha-4.27277179517082
beta0.254581271787193
S.D.0.0375986662340017
T-STAT6.77101868993872
p-value2.47803103168554e-08

\begin{tabular}{lllllllll}
\hline
Regression: S.E.(k) = alpha + beta * Mean(k) \tabularnewline
alpha & -4.27277179517082 \tabularnewline
beta & 0.254581271787193 \tabularnewline
S.D. & 0.0375986662340017 \tabularnewline
T-STAT & 6.77101868993872 \tabularnewline
p-value & 2.47803103168554e-08 \tabularnewline
\hline
\end{tabular}
%Source: https://freestatistics.org/blog/index.php?pk=121157&T=2

[TABLE]
[ROW][C]Regression: S.E.(k) = alpha + beta * Mean(k)[/C][/ROW]
[ROW][C]alpha[/C][C]-4.27277179517082[/C][/ROW]
[ROW][C]beta[/C][C]0.254581271787193[/C][/ROW]
[ROW][C]S.D.[/C][C]0.0375986662340017[/C][/ROW]
[ROW][C]T-STAT[/C][C]6.77101868993872[/C][/ROW]
[ROW][C]p-value[/C][C]2.47803103168554e-08[/C][/ROW]
[/TABLE]
Source: https://freestatistics.org/blog/index.php?pk=121157&T=2

Globally Unique Identifier (entire table): ba.freestatistics.org/blog/index.php?pk=121157&T=2

As an alternative you can also use a QR Code:  

The GUIDs for individual cells are displayed in the table below:

Regression: S.E.(k) = alpha + beta * Mean(k)
alpha-4.27277179517082
beta0.254581271787193
S.D.0.0375986662340017
T-STAT6.77101868993872
p-value2.47803103168554e-08


Regression: ln S.E.(k) = alpha + beta * ln Mean(k)
alpha-0.785279816628025
beta0.794729085718174
S.D.0.195881850605647
T-STAT4.05718591722995
p-value0.000200155046367259
Lambda0.205270914281826

\begin{tabular}{lllllllll}
\hline
Regression: ln S.E.(k) = alpha + beta * ln Mean(k) \tabularnewline
alpha & -0.785279816628025 \tabularnewline
beta & 0.794729085718174 \tabularnewline
S.D. & 0.195881850605647 \tabularnewline
T-STAT & 4.05718591722995 \tabularnewline
p-value & 0.000200155046367259 \tabularnewline
Lambda & 0.205270914281826 \tabularnewline
\hline
\end{tabular}
%Source: https://freestatistics.org/blog/index.php?pk=121157&T=3

[TABLE]
[ROW][C]Regression: ln S.E.(k) = alpha + beta * ln Mean(k)[/C][/ROW]
[ROW][C]alpha[/C][C]-0.785279816628025[/C][/ROW]
[ROW][C]beta[/C][C]0.794729085718174[/C][/ROW]
[ROW][C]S.D.[/C][C]0.195881850605647[/C][/ROW]
[ROW][C]T-STAT[/C][C]4.05718591722995[/C][/ROW]
[ROW][C]p-value[/C][C]0.000200155046367259[/C][/ROW]
[ROW][C]Lambda[/C][C]0.205270914281826[/C][/ROW]
[/TABLE]
Source: https://freestatistics.org/blog/index.php?pk=121157&T=3

Globally Unique Identifier (entire table): ba.freestatistics.org/blog/index.php?pk=121157&T=3

As an alternative you can also use a QR Code:  

The GUIDs for individual cells are displayed in the table below:

Regression: ln S.E.(k) = alpha + beta * ln Mean(k)
alpha-0.785279816628025
beta0.794729085718174
S.D.0.195881850605647
T-STAT4.05718591722995
p-value0.000200155046367259
Lambda0.205270914281826


Parameters (Session):
par1 = 4 ;
Parameters (R input):
par1 = 4 ;
R code (references can be found in the software module):
par1 <- as.numeric(par1)
(n <- length(x))
(np <- floor(n / par1))
arr <- array(NA,dim=c(par1,np))
j <- 0
k <- 1
for (i in 1:(np*par1))
{
j = j + 1
arr[j,k] <- x[i]
if (j == par1) {
j = 0
k=k+1
}
}
arr
arr.mean <- array(NA,dim=np)
arr.sd <- array(NA,dim=np)
arr.range <- array(NA,dim=np)
for (j in 1:np)
{
arr.mean[j] <- mean(arr[,j],na.rm=TRUE)
arr.sd[j] <- sd(arr[,j],na.rm=TRUE)
arr.range[j] <- max(arr[,j],na.rm=TRUE) - min(arr[,j],na.rm=TRUE)
}
arr.mean
arr.sd
arr.range
(lm1 <- lm(arr.sd~arr.mean))
(lnlm1 <- lm(log(arr.sd)~log(arr.mean)))
(lm2 <- lm(arr.range~arr.mean))
bitmap(file='test1.png')
plot(arr.mean,arr.sd,main='Standard Deviation-Mean Plot',xlab='mean',ylab='standard deviation')
dev.off()
bitmap(file='test2.png')
plot(arr.mean,arr.range,main='Range-Mean Plot',xlab='mean',ylab='range')
dev.off()
load(file='createtable')
a<-table.start()
a<-table.row.start(a)
a<-table.element(a,'Standard Deviation-Mean Plot',4,TRUE)
a<-table.row.end(a)
a<-table.row.start(a)
a<-table.element(a,'Section',header=TRUE)
a<-table.element(a,'Mean',header=TRUE)
a<-table.element(a,'Standard Deviation',header=TRUE)
a<-table.element(a,'Range',header=TRUE)
a<-table.row.end(a)
for (j in 1:np) {
a<-table.row.start(a)
a<-table.element(a,j,header=TRUE)
a<-table.element(a,arr.mean[j])
a<-table.element(a,arr.sd[j] )
a<-table.element(a,arr.range[j] )
a<-table.row.end(a)
}
a<-table.end(a)
table.save(a,file='mytable.tab')
a<-table.start()
a<-table.row.start(a)
a<-table.element(a,'Regression: S.E.(k) = alpha + beta * Mean(k)',2,TRUE)
a<-table.row.end(a)
a<-table.row.start(a)
a<-table.element(a,'alpha',header=TRUE)
a<-table.element(a,lm1$coefficients[[1]])
a<-table.row.end(a)
a<-table.row.start(a)
a<-table.element(a,'beta',header=TRUE)
a<-table.element(a,lm1$coefficients[[2]])
a<-table.row.end(a)
a<-table.row.start(a)
a<-table.element(a,'S.D.',header=TRUE)
a<-table.element(a,summary(lm1)$coefficients[2,2])
a<-table.row.end(a)
a<-table.row.start(a)
a<-table.element(a,'T-STAT',header=TRUE)
a<-table.element(a,summary(lm1)$coefficients[2,3])
a<-table.row.end(a)
a<-table.row.start(a)
a<-table.element(a,'p-value',header=TRUE)
a<-table.element(a,summary(lm1)$coefficients[2,4])
a<-table.row.end(a)
a<-table.end(a)
table.save(a,file='mytable1.tab')
a<-table.start()
a<-table.row.start(a)
a<-table.element(a,'Regression: ln S.E.(k) = alpha + beta * ln Mean(k)',2,TRUE)
a<-table.row.end(a)
a<-table.row.start(a)
a<-table.element(a,'alpha',header=TRUE)
a<-table.element(a,lnlm1$coefficients[[1]])
a<-table.row.end(a)
a<-table.row.start(a)
a<-table.element(a,'beta',header=TRUE)
a<-table.element(a,lnlm1$coefficients[[2]])
a<-table.row.end(a)
a<-table.row.start(a)
a<-table.element(a,'S.D.',header=TRUE)
a<-table.element(a,summary(lnlm1)$coefficients[2,2])
a<-table.row.end(a)
a<-table.row.start(a)
a<-table.element(a,'T-STAT',header=TRUE)
a<-table.element(a,summary(lnlm1)$coefficients[2,3])
a<-table.row.end(a)
a<-table.row.start(a)
a<-table.element(a,'p-value',header=TRUE)
a<-table.element(a,summary(lnlm1)$coefficients[2,4])
a<-table.row.end(a)
a<-table.row.start(a)
a<-table.element(a,'Lambda',header=TRUE)
a<-table.element(a,1-lnlm1$coefficients[[2]])
a<-table.row.end(a)
a<-table.end(a)
table.save(a,file='mytable2.tab')