Free Statistics

of Irreproducible Research!

Author's title

Author*Unverified author*
R Software Modulerwasp_smp.wasp
Title produced by softwareStandard Deviation-Mean Plot
Date of computationFri, 06 May 2011 09:04:35 +0000
Cite this page as followsStatistical Computations at FreeStatistics.org, Office for Research Development and Education, URL https://freestatistics.org/blog/index.php?v=date/2011/May/06/t1304672436qd2uobnjwizc2f6.htm/, Retrieved Sun, 12 May 2024 13:01:54 +0000
Statistical Computations at FreeStatistics.org, Office for Research Development and Education, URL https://freestatistics.org/blog/index.php?pk=121145, Retrieved Sun, 12 May 2024 13:01:54 +0000
QR Codes:

Original text written by user:
IsPrivate?No (this computation is public)
User-defined keywordsKDGP2W83
Estimated Impact170
Family? (F = Feedback message, R = changed R code, M = changed R Module, P = changed Parameters, D = changed Data)
-       [Standard Deviation-Mean Plot] [] [2011-05-06 09:04:35] [dc16c24fae4397a85c64c2b70586e631] [Current]
Feedback Forum

Post a new message
Dataseries X:
12544
12264
13783
11214
11453
10883
10381
10348
10024
10805
10796
11907
12261
11377
12689
11474
10992
10764
12164
10409
10398
10349
10865
11630
12221
10884
12019
11021
10799
10423
10484
10450
9906
11049
11281
12485
12849
11380
12079
11366
11328
10444
10854
10434
10137
10992
10906
12367
14371
11695
11546
10922
10670
10254
10573
10239
10253
11176
10719
11817
12503
11510
12012
10941
11252
10662
11114
10415
10626
11411
10936
12513


Summary of computational transaction
Raw Inputview raw input (R code)
Raw Outputview raw output of R engine
Computing time1 seconds
R Server'Gwilym Jenkins' @ www.wessa.org

\begin{tabular}{lllllllll}
\hline
Summary of computational transaction \tabularnewline
Raw Input & view raw input (R code)  \tabularnewline
Raw Output & view raw output of R engine  \tabularnewline
Computing time & 1 seconds \tabularnewline
R Server & 'Gwilym Jenkins' @ www.wessa.org \tabularnewline
\hline
\end{tabular}
%Source: https://freestatistics.org/blog/index.php?pk=121145&T=0

[TABLE]
[ROW][C]Summary of computational transaction[/C][/ROW]
[ROW][C]Raw Input[/C][C]view raw input (R code) [/C][/ROW]
[ROW][C]Raw Output[/C][C]view raw output of R engine [/C][/ROW]
[ROW][C]Computing time[/C][C]1 seconds[/C][/ROW]
[ROW][C]R Server[/C][C]'Gwilym Jenkins' @ www.wessa.org[/C][/ROW]
[/TABLE]
Source: https://freestatistics.org/blog/index.php?pk=121145&T=0

Globally Unique Identifier (entire table): ba.freestatistics.org/blog/index.php?pk=121145&T=0

As an alternative you can also use a QR Code:  

The GUIDs for individual cells are displayed in the table below:

Summary of computational transaction
Raw Inputview raw input (R code)
Raw Outputview raw output of R engine
Computing time1 seconds
R Server'Gwilym Jenkins' @ www.wessa.org


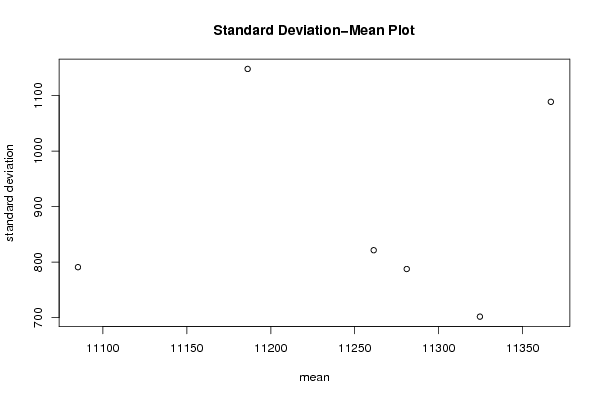
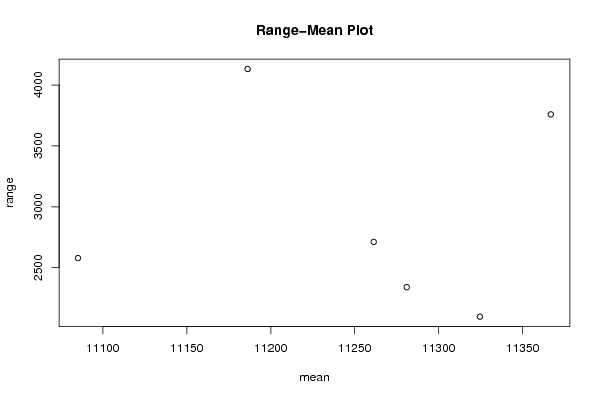
Standard Deviation-Mean Plot
SectionMeanStandard DeviationRange
111366.83333333331088.775194538533759
211281787.5959970349362340
311085.1666666667790.9469391849622579
411261.3333333333821.4514131964372712
511186.251147.998188547834132
611324.5833333333701.7842789934982098

\begin{tabular}{lllllllll}
\hline
Standard Deviation-Mean Plot \tabularnewline
Section & Mean & Standard Deviation & Range \tabularnewline
1 & 11366.8333333333 & 1088.77519453853 & 3759 \tabularnewline
2 & 11281 & 787.595997034936 & 2340 \tabularnewline
3 & 11085.1666666667 & 790.946939184962 & 2579 \tabularnewline
4 & 11261.3333333333 & 821.451413196437 & 2712 \tabularnewline
5 & 11186.25 & 1147.99818854783 & 4132 \tabularnewline
6 & 11324.5833333333 & 701.784278993498 & 2098 \tabularnewline
\hline
\end{tabular}
%Source: https://freestatistics.org/blog/index.php?pk=121145&T=1

[TABLE]
[ROW][C]Standard Deviation-Mean Plot[/C][/ROW]
[ROW][C]Section[/C][C]Mean[/C][C]Standard Deviation[/C][C]Range[/C][/ROW]
[ROW][C]1[/C][C]11366.8333333333[/C][C]1088.77519453853[/C][C]3759[/C][/ROW]
[ROW][C]2[/C][C]11281[/C][C]787.595997034936[/C][C]2340[/C][/ROW]
[ROW][C]3[/C][C]11085.1666666667[/C][C]790.946939184962[/C][C]2579[/C][/ROW]
[ROW][C]4[/C][C]11261.3333333333[/C][C]821.451413196437[/C][C]2712[/C][/ROW]
[ROW][C]5[/C][C]11186.25[/C][C]1147.99818854783[/C][C]4132[/C][/ROW]
[ROW][C]6[/C][C]11324.5833333333[/C][C]701.784278993498[/C][C]2098[/C][/ROW]
[/TABLE]
Source: https://freestatistics.org/blog/index.php?pk=121145&T=1

Globally Unique Identifier (entire table): ba.freestatistics.org/blog/index.php?pk=121145&T=1

As an alternative you can also use a QR Code:  

The GUIDs for individual cells are displayed in the table below:

Standard Deviation-Mean Plot
SectionMeanStandard DeviationRange
111366.83333333331088.775194538533759
211281787.5959970349362340
311085.1666666667790.9469391849622579
411261.3333333333821.4514131964372712
511186.251147.998188547834132
611324.5833333333701.7842789934982098


Regression: S.E.(k) = alpha + beta * Mean(k)
alpha-227.103982334078
beta0.099269081707336
S.D.0.897370072287462
T-STAT0.110622233538825
p-value0.91724416559178

\begin{tabular}{lllllllll}
\hline
Regression: S.E.(k) = alpha + beta * Mean(k) \tabularnewline
alpha & -227.103982334078 \tabularnewline
beta & 0.099269081707336 \tabularnewline
S.D. & 0.897370072287462 \tabularnewline
T-STAT & 0.110622233538825 \tabularnewline
p-value & 0.91724416559178 \tabularnewline
\hline
\end{tabular}
%Source: https://freestatistics.org/blog/index.php?pk=121145&T=2

[TABLE]
[ROW][C]Regression: S.E.(k) = alpha + beta * Mean(k)[/C][/ROW]
[ROW][C]alpha[/C][C]-227.103982334078[/C][/ROW]
[ROW][C]beta[/C][C]0.099269081707336[/C][/ROW]
[ROW][C]S.D.[/C][C]0.897370072287462[/C][/ROW]
[ROW][C]T-STAT[/C][C]0.110622233538825[/C][/ROW]
[ROW][C]p-value[/C][C]0.91724416559178[/C][/ROW]
[/TABLE]
Source: https://freestatistics.org/blog/index.php?pk=121145&T=2

Globally Unique Identifier (entire table): ba.freestatistics.org/blog/index.php?pk=121145&T=2

As an alternative you can also use a QR Code:  

The GUIDs for individual cells are displayed in the table below:

Regression: S.E.(k) = alpha + beta * Mean(k)
alpha-227.103982334078
beta0.099269081707336
S.D.0.897370072287462
T-STAT0.110622233538825
p-value0.91724416559178


Regression: ln S.E.(k) = alpha + beta * ln Mean(k)
alpha-2.23182506386563
beta0.965471125771264
S.D.10.9175000787621
T-STAT0.088433351848506
p-value0.933782825568919
Lambda0.0345288742287364

\begin{tabular}{lllllllll}
\hline
Regression: ln S.E.(k) = alpha + beta * ln Mean(k) \tabularnewline
alpha & -2.23182506386563 \tabularnewline
beta & 0.965471125771264 \tabularnewline
S.D. & 10.9175000787621 \tabularnewline
T-STAT & 0.088433351848506 \tabularnewline
p-value & 0.933782825568919 \tabularnewline
Lambda & 0.0345288742287364 \tabularnewline
\hline
\end{tabular}
%Source: https://freestatistics.org/blog/index.php?pk=121145&T=3

[TABLE]
[ROW][C]Regression: ln S.E.(k) = alpha + beta * ln Mean(k)[/C][/ROW]
[ROW][C]alpha[/C][C]-2.23182506386563[/C][/ROW]
[ROW][C]beta[/C][C]0.965471125771264[/C][/ROW]
[ROW][C]S.D.[/C][C]10.9175000787621[/C][/ROW]
[ROW][C]T-STAT[/C][C]0.088433351848506[/C][/ROW]
[ROW][C]p-value[/C][C]0.933782825568919[/C][/ROW]
[ROW][C]Lambda[/C][C]0.0345288742287364[/C][/ROW]
[/TABLE]
Source: https://freestatistics.org/blog/index.php?pk=121145&T=3

Globally Unique Identifier (entire table): ba.freestatistics.org/blog/index.php?pk=121145&T=3

As an alternative you can also use a QR Code:  

The GUIDs for individual cells are displayed in the table below:

Regression: ln S.E.(k) = alpha + beta * ln Mean(k)
alpha-2.23182506386563
beta0.965471125771264
S.D.10.9175000787621
T-STAT0.088433351848506
p-value0.933782825568919
Lambda0.0345288742287364


Parameters (Session):
par1 = 12 ;
Parameters (R input):
par1 = 12 ;
R code (references can be found in the software module):
par1 <- as.numeric(par1)
(n <- length(x))
(np <- floor(n / par1))
arr <- array(NA,dim=c(par1,np))
j <- 0
k <- 1
for (i in 1:(np*par1))
{
j = j + 1
arr[j,k] <- x[i]
if (j == par1) {
j = 0
k=k+1
}
}
arr
arr.mean <- array(NA,dim=np)
arr.sd <- array(NA,dim=np)
arr.range <- array(NA,dim=np)
for (j in 1:np)
{
arr.mean[j] <- mean(arr[,j],na.rm=TRUE)
arr.sd[j] <- sd(arr[,j],na.rm=TRUE)
arr.range[j] <- max(arr[,j],na.rm=TRUE) - min(arr[,j],na.rm=TRUE)
}
arr.mean
arr.sd
arr.range
(lm1 <- lm(arr.sd~arr.mean))
(lnlm1 <- lm(log(arr.sd)~log(arr.mean)))
(lm2 <- lm(arr.range~arr.mean))
bitmap(file='test1.png')
plot(arr.mean,arr.sd,main='Standard Deviation-Mean Plot',xlab='mean',ylab='standard deviation')
dev.off()
bitmap(file='test2.png')
plot(arr.mean,arr.range,main='Range-Mean Plot',xlab='mean',ylab='range')
dev.off()
load(file='createtable')
a<-table.start()
a<-table.row.start(a)
a<-table.element(a,'Standard Deviation-Mean Plot',4,TRUE)
a<-table.row.end(a)
a<-table.row.start(a)
a<-table.element(a,'Section',header=TRUE)
a<-table.element(a,'Mean',header=TRUE)
a<-table.element(a,'Standard Deviation',header=TRUE)
a<-table.element(a,'Range',header=TRUE)
a<-table.row.end(a)
for (j in 1:np) {
a<-table.row.start(a)
a<-table.element(a,j,header=TRUE)
a<-table.element(a,arr.mean[j])
a<-table.element(a,arr.sd[j] )
a<-table.element(a,arr.range[j] )
a<-table.row.end(a)
}
a<-table.end(a)
table.save(a,file='mytable.tab')
a<-table.start()
a<-table.row.start(a)
a<-table.element(a,'Regression: S.E.(k) = alpha + beta * Mean(k)',2,TRUE)
a<-table.row.end(a)
a<-table.row.start(a)
a<-table.element(a,'alpha',header=TRUE)
a<-table.element(a,lm1$coefficients[[1]])
a<-table.row.end(a)
a<-table.row.start(a)
a<-table.element(a,'beta',header=TRUE)
a<-table.element(a,lm1$coefficients[[2]])
a<-table.row.end(a)
a<-table.row.start(a)
a<-table.element(a,'S.D.',header=TRUE)
a<-table.element(a,summary(lm1)$coefficients[2,2])
a<-table.row.end(a)
a<-table.row.start(a)
a<-table.element(a,'T-STAT',header=TRUE)
a<-table.element(a,summary(lm1)$coefficients[2,3])
a<-table.row.end(a)
a<-table.row.start(a)
a<-table.element(a,'p-value',header=TRUE)
a<-table.element(a,summary(lm1)$coefficients[2,4])
a<-table.row.end(a)
a<-table.end(a)
table.save(a,file='mytable1.tab')
a<-table.start()
a<-table.row.start(a)
a<-table.element(a,'Regression: ln S.E.(k) = alpha + beta * ln Mean(k)',2,TRUE)
a<-table.row.end(a)
a<-table.row.start(a)
a<-table.element(a,'alpha',header=TRUE)
a<-table.element(a,lnlm1$coefficients[[1]])
a<-table.row.end(a)
a<-table.row.start(a)
a<-table.element(a,'beta',header=TRUE)
a<-table.element(a,lnlm1$coefficients[[2]])
a<-table.row.end(a)
a<-table.row.start(a)
a<-table.element(a,'S.D.',header=TRUE)
a<-table.element(a,summary(lnlm1)$coefficients[2,2])
a<-table.row.end(a)
a<-table.row.start(a)
a<-table.element(a,'T-STAT',header=TRUE)
a<-table.element(a,summary(lnlm1)$coefficients[2,3])
a<-table.row.end(a)
a<-table.row.start(a)
a<-table.element(a,'p-value',header=TRUE)
a<-table.element(a,summary(lnlm1)$coefficients[2,4])
a<-table.row.end(a)
a<-table.row.start(a)
a<-table.element(a,'Lambda',header=TRUE)
a<-table.element(a,1-lnlm1$coefficients[[2]])
a<-table.row.end(a)
a<-table.end(a)
table.save(a,file='mytable2.tab')