Free Statistics

of Irreproducible Research!

Author's title

Author*Unverified author*
R Software Modulerwasp_smp.wasp
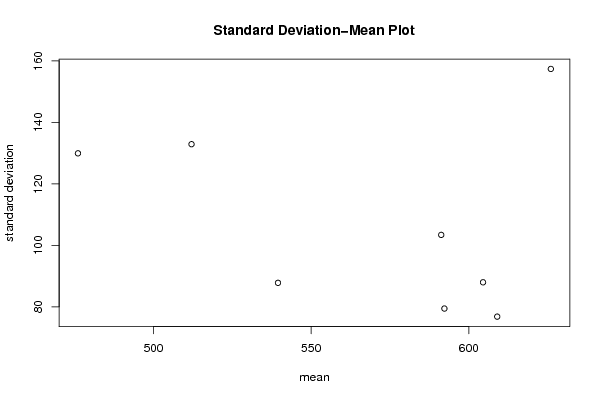
Title produced by softwareStandard Deviation-Mean Plot
Date of computationWed, 04 May 2011 17:49:55 +0000
Cite this page as followsStatistical Computations at FreeStatistics.org, Office for Research Development and Education, URL https://freestatistics.org/blog/index.php?v=date/2011/May/04/t1304531268eted4mrdehom0mc.htm/, Retrieved Sun, 12 May 2024 21:33:42 +0000
Statistical Computations at FreeStatistics.org, Office for Research Development and Education, URL https://freestatistics.org/blog/index.php?pk=120984, Retrieved Sun, 12 May 2024 21:33:42 +0000
QR Codes:

Original text written by user:
IsPrivate?No (this computation is public)
User-defined keywordsKDGP2W83
Estimated Impact74
Family? (F = Feedback message, R = changed R code, M = changed R Module, P = changed Parameters, D = changed Data)
-       [Standard Deviation-Mean Plot] [standard deviatio...] [2011-05-04 17:49:55] [fc42f3d005062709f652b08fadb3432c] [Current]
Feedback Forum

Post a new message
Dataseries X:
600
425
398
582
458
455
621
635
589
220
351
379
683
524
536
598
581
632
645
722
689
645
354
486
423
479
684
601
608
463
602
485
563
645
486
435
479
579
563
202
389
467
466
706
546
689
531
528
579
684
651
637
548
496
582
467
693
615
708
648
899
852
745
689
582
674
684
542
489
472
398
486
549
766
654
628
689
648
578
536
548
496
475
687
642
584
596
609
678
694
485
489
537
706
489
598


Summary of computational transaction
Raw Inputview raw input (R code)
Raw Outputview raw output of R engine
Computing time2 seconds
R Server'RServer@AstonUniversity' @ vre.aston.ac.uk

\begin{tabular}{lllllllll}
\hline
Summary of computational transaction \tabularnewline
Raw Input & view raw input (R code)  \tabularnewline
Raw Output & view raw output of R engine  \tabularnewline
Computing time & 2 seconds \tabularnewline
R Server & 'RServer@AstonUniversity' @ vre.aston.ac.uk \tabularnewline
\hline
\end{tabular}
%Source: https://freestatistics.org/blog/index.php?pk=120984&T=0

[TABLE]
[ROW][C]Summary of computational transaction[/C][/ROW]
[ROW][C]Raw Input[/C][C]view raw input (R code) [/C][/ROW]
[ROW][C]Raw Output[/C][C]view raw output of R engine [/C][/ROW]
[ROW][C]Computing time[/C][C]2 seconds[/C][/ROW]
[ROW][C]R Server[/C][C]'RServer@AstonUniversity' @ vre.aston.ac.uk[/C][/ROW]
[/TABLE]
Source: https://freestatistics.org/blog/index.php?pk=120984&T=0

Globally Unique Identifier (entire table): ba.freestatistics.org/blog/index.php?pk=120984&T=0

As an alternative you can also use a QR Code:  

The GUIDs for individual cells are displayed in the table below:

Summary of computational transaction
Raw Inputview raw input (R code)
Raw Outputview raw output of R engine
Computing time2 seconds
R Server'RServer@AstonUniversity' @ vre.aston.ac.uk


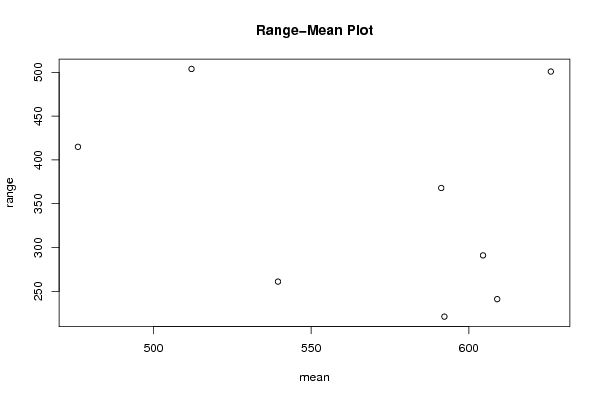
Standard Deviation-Mean Plot
SectionMeanStandard DeviationRange
1476.083333333333129.932470805788415
2591.25103.396083097959368
3539.587.7915920596251261
4512.083333333333132.900139088328504
560976.793702393313241
6626157.383145684201501
7604.587.9736530807016291
8592.2579.4253508877132221

\begin{tabular}{lllllllll}
\hline
Standard Deviation-Mean Plot \tabularnewline
Section & Mean & Standard Deviation & Range \tabularnewline
1 & 476.083333333333 & 129.932470805788 & 415 \tabularnewline
2 & 591.25 & 103.396083097959 & 368 \tabularnewline
3 & 539.5 & 87.7915920596251 & 261 \tabularnewline
4 & 512.083333333333 & 132.900139088328 & 504 \tabularnewline
5 & 609 & 76.793702393313 & 241 \tabularnewline
6 & 626 & 157.383145684201 & 501 \tabularnewline
7 & 604.5 & 87.9736530807016 & 291 \tabularnewline
8 & 592.25 & 79.4253508877132 & 221 \tabularnewline
\hline
\end{tabular}
%Source: https://freestatistics.org/blog/index.php?pk=120984&T=1

[TABLE]
[ROW][C]Standard Deviation-Mean Plot[/C][/ROW]
[ROW][C]Section[/C][C]Mean[/C][C]Standard Deviation[/C][C]Range[/C][/ROW]
[ROW][C]1[/C][C]476.083333333333[/C][C]129.932470805788[/C][C]415[/C][/ROW]
[ROW][C]2[/C][C]591.25[/C][C]103.396083097959[/C][C]368[/C][/ROW]
[ROW][C]3[/C][C]539.5[/C][C]87.7915920596251[/C][C]261[/C][/ROW]
[ROW][C]4[/C][C]512.083333333333[/C][C]132.900139088328[/C][C]504[/C][/ROW]
[ROW][C]5[/C][C]609[/C][C]76.793702393313[/C][C]241[/C][/ROW]
[ROW][C]6[/C][C]626[/C][C]157.383145684201[/C][C]501[/C][/ROW]
[ROW][C]7[/C][C]604.5[/C][C]87.9736530807016[/C][C]291[/C][/ROW]
[ROW][C]8[/C][C]592.25[/C][C]79.4253508877132[/C][C]221[/C][/ROW]
[/TABLE]
Source: https://freestatistics.org/blog/index.php?pk=120984&T=1

Globally Unique Identifier (entire table): ba.freestatistics.org/blog/index.php?pk=120984&T=1

As an alternative you can also use a QR Code:  

The GUIDs for individual cells are displayed in the table below:

Standard Deviation-Mean Plot
SectionMeanStandard DeviationRange
1476.083333333333129.932470805788415
2591.25103.396083097959368
3539.587.7915920596251261
4512.083333333333132.900139088328504
560976.793702393313241
6626157.383145684201501
7604.587.9736530807016291
8592.2579.4253508877132221


Regression: S.E.(k) = alpha + beta * Mean(k)
alpha186.22050580003
beta-0.139357143854954
S.D.0.21981343174601
T-STAT-0.633979201125333
p-value0.549485030902312

\begin{tabular}{lllllllll}
\hline
Regression: S.E.(k) = alpha + beta * Mean(k) \tabularnewline
alpha & 186.22050580003 \tabularnewline
beta & -0.139357143854954 \tabularnewline
S.D. & 0.21981343174601 \tabularnewline
T-STAT & -0.633979201125333 \tabularnewline
p-value & 0.549485030902312 \tabularnewline
\hline
\end{tabular}
%Source: https://freestatistics.org/blog/index.php?pk=120984&T=2

[TABLE]
[ROW][C]Regression: S.E.(k) = alpha + beta * Mean(k)[/C][/ROW]
[ROW][C]alpha[/C][C]186.22050580003[/C][/ROW]
[ROW][C]beta[/C][C]-0.139357143854954[/C][/ROW]
[ROW][C]S.D.[/C][C]0.21981343174601[/C][/ROW]
[ROW][C]T-STAT[/C][C]-0.633979201125333[/C][/ROW]
[ROW][C]p-value[/C][C]0.549485030902312[/C][/ROW]
[/TABLE]
Source: https://freestatistics.org/blog/index.php?pk=120984&T=2

Globally Unique Identifier (entire table): ba.freestatistics.org/blog/index.php?pk=120984&T=2

As an alternative you can also use a QR Code:  

The GUIDs for individual cells are displayed in the table below:

Regression: S.E.(k) = alpha + beta * Mean(k)
alpha186.22050580003
beta-0.139357143854954
S.D.0.21981343174601
T-STAT-0.633979201125333
p-value0.549485030902312


Regression: ln S.E.(k) = alpha + beta * ln Mean(k)
alpha10.2896632057445
beta-0.891140629093059
S.D.1.06577168689104
T-STAT-0.836145902592517
p-value0.43510111122594
Lambda1.89114062909306

\begin{tabular}{lllllllll}
\hline
Regression: ln S.E.(k) = alpha + beta * ln Mean(k) \tabularnewline
alpha & 10.2896632057445 \tabularnewline
beta & -0.891140629093059 \tabularnewline
S.D. & 1.06577168689104 \tabularnewline
T-STAT & -0.836145902592517 \tabularnewline
p-value & 0.43510111122594 \tabularnewline
Lambda & 1.89114062909306 \tabularnewline
\hline
\end{tabular}
%Source: https://freestatistics.org/blog/index.php?pk=120984&T=3

[TABLE]
[ROW][C]Regression: ln S.E.(k) = alpha + beta * ln Mean(k)[/C][/ROW]
[ROW][C]alpha[/C][C]10.2896632057445[/C][/ROW]
[ROW][C]beta[/C][C]-0.891140629093059[/C][/ROW]
[ROW][C]S.D.[/C][C]1.06577168689104[/C][/ROW]
[ROW][C]T-STAT[/C][C]-0.836145902592517[/C][/ROW]
[ROW][C]p-value[/C][C]0.43510111122594[/C][/ROW]
[ROW][C]Lambda[/C][C]1.89114062909306[/C][/ROW]
[/TABLE]
Source: https://freestatistics.org/blog/index.php?pk=120984&T=3

Globally Unique Identifier (entire table): ba.freestatistics.org/blog/index.php?pk=120984&T=3

As an alternative you can also use a QR Code:  

The GUIDs for individual cells are displayed in the table below:

Regression: ln S.E.(k) = alpha + beta * ln Mean(k)
alpha10.2896632057445
beta-0.891140629093059
S.D.1.06577168689104
T-STAT-0.836145902592517
p-value0.43510111122594
Lambda1.89114062909306


Parameters (Session):
par1 = 12 ;
Parameters (R input):
par1 = 12 ;
R code (references can be found in the software module):
par1 <- as.numeric(par1)
(n <- length(x))
(np <- floor(n / par1))
arr <- array(NA,dim=c(par1,np))
j <- 0
k <- 1
for (i in 1:(np*par1))
{
j = j + 1
arr[j,k] <- x[i]
if (j == par1) {
j = 0
k=k+1
}
}
arr
arr.mean <- array(NA,dim=np)
arr.sd <- array(NA,dim=np)
arr.range <- array(NA,dim=np)
for (j in 1:np)
{
arr.mean[j] <- mean(arr[,j],na.rm=TRUE)
arr.sd[j] <- sd(arr[,j],na.rm=TRUE)
arr.range[j] <- max(arr[,j],na.rm=TRUE) - min(arr[,j],na.rm=TRUE)
}
arr.mean
arr.sd
arr.range
(lm1 <- lm(arr.sd~arr.mean))
(lnlm1 <- lm(log(arr.sd)~log(arr.mean)))
(lm2 <- lm(arr.range~arr.mean))
bitmap(file='test1.png')
plot(arr.mean,arr.sd,main='Standard Deviation-Mean Plot',xlab='mean',ylab='standard deviation')
dev.off()
bitmap(file='test2.png')
plot(arr.mean,arr.range,main='Range-Mean Plot',xlab='mean',ylab='range')
dev.off()
load(file='createtable')
a<-table.start()
a<-table.row.start(a)
a<-table.element(a,'Standard Deviation-Mean Plot',4,TRUE)
a<-table.row.end(a)
a<-table.row.start(a)
a<-table.element(a,'Section',header=TRUE)
a<-table.element(a,'Mean',header=TRUE)
a<-table.element(a,'Standard Deviation',header=TRUE)
a<-table.element(a,'Range',header=TRUE)
a<-table.row.end(a)
for (j in 1:np) {
a<-table.row.start(a)
a<-table.element(a,j,header=TRUE)
a<-table.element(a,arr.mean[j])
a<-table.element(a,arr.sd[j] )
a<-table.element(a,arr.range[j] )
a<-table.row.end(a)
}
a<-table.end(a)
table.save(a,file='mytable.tab')
a<-table.start()
a<-table.row.start(a)
a<-table.element(a,'Regression: S.E.(k) = alpha + beta * Mean(k)',2,TRUE)
a<-table.row.end(a)
a<-table.row.start(a)
a<-table.element(a,'alpha',header=TRUE)
a<-table.element(a,lm1$coefficients[[1]])
a<-table.row.end(a)
a<-table.row.start(a)
a<-table.element(a,'beta',header=TRUE)
a<-table.element(a,lm1$coefficients[[2]])
a<-table.row.end(a)
a<-table.row.start(a)
a<-table.element(a,'S.D.',header=TRUE)
a<-table.element(a,summary(lm1)$coefficients[2,2])
a<-table.row.end(a)
a<-table.row.start(a)
a<-table.element(a,'T-STAT',header=TRUE)
a<-table.element(a,summary(lm1)$coefficients[2,3])
a<-table.row.end(a)
a<-table.row.start(a)
a<-table.element(a,'p-value',header=TRUE)
a<-table.element(a,summary(lm1)$coefficients[2,4])
a<-table.row.end(a)
a<-table.end(a)
table.save(a,file='mytable1.tab')
a<-table.start()
a<-table.row.start(a)
a<-table.element(a,'Regression: ln S.E.(k) = alpha + beta * ln Mean(k)',2,TRUE)
a<-table.row.end(a)
a<-table.row.start(a)
a<-table.element(a,'alpha',header=TRUE)
a<-table.element(a,lnlm1$coefficients[[1]])
a<-table.row.end(a)
a<-table.row.start(a)
a<-table.element(a,'beta',header=TRUE)
a<-table.element(a,lnlm1$coefficients[[2]])
a<-table.row.end(a)
a<-table.row.start(a)
a<-table.element(a,'S.D.',header=TRUE)
a<-table.element(a,summary(lnlm1)$coefficients[2,2])
a<-table.row.end(a)
a<-table.row.start(a)
a<-table.element(a,'T-STAT',header=TRUE)
a<-table.element(a,summary(lnlm1)$coefficients[2,3])
a<-table.row.end(a)
a<-table.row.start(a)
a<-table.element(a,'p-value',header=TRUE)
a<-table.element(a,summary(lnlm1)$coefficients[2,4])
a<-table.row.end(a)
a<-table.row.start(a)
a<-table.element(a,'Lambda',header=TRUE)
a<-table.element(a,1-lnlm1$coefficients[[2]])
a<-table.row.end(a)
a<-table.end(a)
table.save(a,file='mytable2.tab')