Free Statistics

of Irreproducible Research!

Author's title

Author*Unverified author*
R Software Modulerwasp_autocorrelation.wasp
Title produced by software(Partial) Autocorrelation Function
Date of computationWed, 04 May 2011 16:48:57 +0000
Cite this page as followsStatistical Computations at FreeStatistics.org, Office for Research Development and Education, URL https://freestatistics.org/blog/index.php?v=date/2011/May/04/t13045275958p49aw0ighvlvlg.htm/, Retrieved Sun, 12 May 2024 15:16:42 +0000
Statistical Computations at FreeStatistics.org, Office for Research Development and Education, URL https://freestatistics.org/blog/index.php?pk=120980, Retrieved Sun, 12 May 2024 15:16:42 +0000
QR Codes:

Original text written by user:
IsPrivate?No (this computation is public)
User-defined keywordsKDGP2W12
Estimated Impact86
Family? (F = Feedback message, R = changed R code, M = changed R Module, P = changed Parameters, D = changed Data)
-       [(Partial) Autocorrelation Function] [] [2011-05-04 16:48:57] [60509181c3aa3f51e201bae3996eda3b] [Current]
Feedback Forum

Post a new message
Dataseries X:
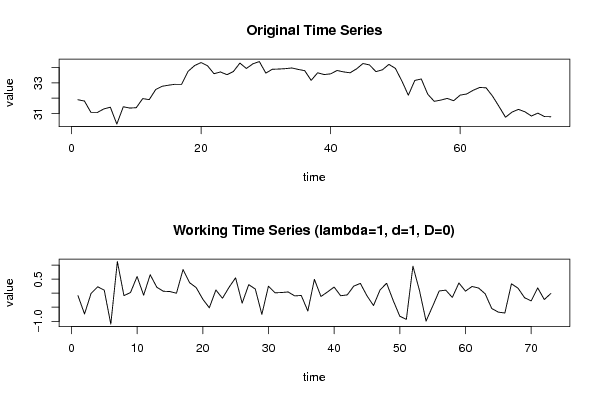
31.900
31.815
31.075
31.070
31.300
31.410
30.310
31.440
31.355
31.380
31.975
31.905
32.565
32.780
32.850
32.910
32.910
33.755
34.130
34.330
34.120
33.600
33.715
33.535
33.745
34.295
33.940
34.245
34.395
33.640
33.890
33.905
33.930
33.975
33.880
33.800
33.165
33.660
33.545
33.590
33.810
33.720
33.660
33.915
34.265
34.175
33.735
33.855
34.210
33.950
33.130
32.195
33.160
33.255
32.260
31.795
31.875
31.985
31.835
32.200
32.275
32.515
32.700
32.680
32.135
31.460
30.755
31.090
31.270
31.110
30.835
31.025
30.800
30.790


Summary of computational transaction
Raw Inputview raw input (R code)
Raw Outputview raw output of R engine
Computing time2 seconds
R Server'George Udny Yule' @ 216.218.223.82

\begin{tabular}{lllllllll}
\hline
Summary of computational transaction \tabularnewline
Raw Input & view raw input (R code)  \tabularnewline
Raw Output & view raw output of R engine  \tabularnewline
Computing time & 2 seconds \tabularnewline
R Server & 'George Udny Yule' @ 216.218.223.82 \tabularnewline
\hline
\end{tabular}
%Source: https://freestatistics.org/blog/index.php?pk=120980&T=0

[TABLE]
[ROW][C]Summary of computational transaction[/C][/ROW]
[ROW][C]Raw Input[/C][C]view raw input (R code) [/C][/ROW]
[ROW][C]Raw Output[/C][C]view raw output of R engine [/C][/ROW]
[ROW][C]Computing time[/C][C]2 seconds[/C][/ROW]
[ROW][C]R Server[/C][C]'George Udny Yule' @ 216.218.223.82[/C][/ROW]
[/TABLE]
Source: https://freestatistics.org/blog/index.php?pk=120980&T=0

Globally Unique Identifier (entire table): ba.freestatistics.org/blog/index.php?pk=120980&T=0

As an alternative you can also use a QR Code:  

The GUIDs for individual cells are displayed in the table below:

Summary of computational transaction
Raw Inputview raw input (R code)
Raw Outputview raw output of R engine
Computing time2 seconds
R Server'George Udny Yule' @ 216.218.223.82


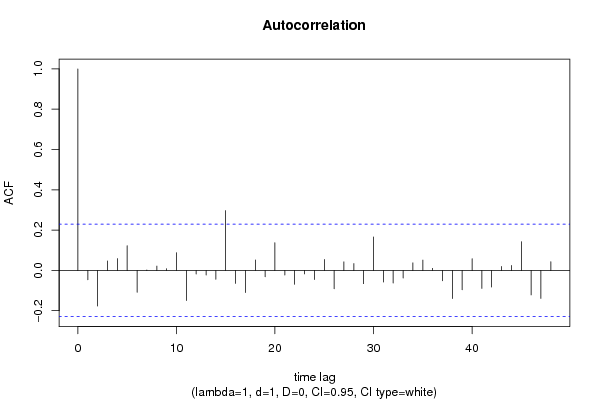
Autocorrelation Function
Time lag kACF(k)T-STATP-value
1-0.046533-0.39760.34605
2-0.176619-1.5090.067803
30.0466130.39830.345799
40.0584590.49950.309474
50.1228761.04980.148625
6-0.108458-0.92670.178578
70.0025840.02210.491223
80.0213690.18260.42782
90.0083570.07140.471636
100.0881680.75330.226845
11-0.149265-1.27530.10312
12-0.017408-0.14870.441087
13-0.022553-0.19270.423868
14-0.043429-0.37110.355836
150.297072.53820.006638
16-0.064333-0.54970.292115
17-0.109255-0.93350.176825
180.0517210.44190.329933
19-0.03126-0.26710.395078
200.1373551.17360.122193
21-0.023048-0.19690.422219
22-0.068956-0.58920.278785
23-0.017283-0.14770.441506
24-0.045287-0.38690.349966
250.0542820.46380.322089
26-0.09106-0.7780.219537
270.042580.36380.358528
280.0340020.29050.386125
29-0.0655-0.55960.288721
300.166131.41940.080017
31-0.057052-0.48750.313698
32-0.062308-0.53240.298046
33-0.037398-0.31950.375118
340.0374130.31970.375072
350.0513410.43870.331102
360.0101830.0870.465453
37-0.051138-0.43690.331727
38-0.139247-1.18970.119004
39-0.095784-0.81840.207901
400.0579670.49530.310949
41-0.089002-0.76040.224723
42-0.082035-0.70090.242795
430.0194570.16620.434214
440.0249170.21290.416003
450.1424411.2170.113759
46-0.12153-1.03840.151267
47-0.138732-1.18530.119867
480.0434510.37120.355765

\begin{tabular}{lllllllll}
\hline
Autocorrelation Function \tabularnewline
Time lag k & ACF(k) & T-STAT & P-value \tabularnewline
1 & -0.046533 & -0.3976 & 0.34605 \tabularnewline
2 & -0.176619 & -1.509 & 0.067803 \tabularnewline
3 & 0.046613 & 0.3983 & 0.345799 \tabularnewline
4 & 0.058459 & 0.4995 & 0.309474 \tabularnewline
5 & 0.122876 & 1.0498 & 0.148625 \tabularnewline
6 & -0.108458 & -0.9267 & 0.178578 \tabularnewline
7 & 0.002584 & 0.0221 & 0.491223 \tabularnewline
8 & 0.021369 & 0.1826 & 0.42782 \tabularnewline
9 & 0.008357 & 0.0714 & 0.471636 \tabularnewline
10 & 0.088168 & 0.7533 & 0.226845 \tabularnewline
11 & -0.149265 & -1.2753 & 0.10312 \tabularnewline
12 & -0.017408 & -0.1487 & 0.441087 \tabularnewline
13 & -0.022553 & -0.1927 & 0.423868 \tabularnewline
14 & -0.043429 & -0.3711 & 0.355836 \tabularnewline
15 & 0.29707 & 2.5382 & 0.006638 \tabularnewline
16 & -0.064333 & -0.5497 & 0.292115 \tabularnewline
17 & -0.109255 & -0.9335 & 0.176825 \tabularnewline
18 & 0.051721 & 0.4419 & 0.329933 \tabularnewline
19 & -0.03126 & -0.2671 & 0.395078 \tabularnewline
20 & 0.137355 & 1.1736 & 0.122193 \tabularnewline
21 & -0.023048 & -0.1969 & 0.422219 \tabularnewline
22 & -0.068956 & -0.5892 & 0.278785 \tabularnewline
23 & -0.017283 & -0.1477 & 0.441506 \tabularnewline
24 & -0.045287 & -0.3869 & 0.349966 \tabularnewline
25 & 0.054282 & 0.4638 & 0.322089 \tabularnewline
26 & -0.09106 & -0.778 & 0.219537 \tabularnewline
27 & 0.04258 & 0.3638 & 0.358528 \tabularnewline
28 & 0.034002 & 0.2905 & 0.386125 \tabularnewline
29 & -0.0655 & -0.5596 & 0.288721 \tabularnewline
30 & 0.16613 & 1.4194 & 0.080017 \tabularnewline
31 & -0.057052 & -0.4875 & 0.313698 \tabularnewline
32 & -0.062308 & -0.5324 & 0.298046 \tabularnewline
33 & -0.037398 & -0.3195 & 0.375118 \tabularnewline
34 & 0.037413 & 0.3197 & 0.375072 \tabularnewline
35 & 0.051341 & 0.4387 & 0.331102 \tabularnewline
36 & 0.010183 & 0.087 & 0.465453 \tabularnewline
37 & -0.051138 & -0.4369 & 0.331727 \tabularnewline
38 & -0.139247 & -1.1897 & 0.119004 \tabularnewline
39 & -0.095784 & -0.8184 & 0.207901 \tabularnewline
40 & 0.057967 & 0.4953 & 0.310949 \tabularnewline
41 & -0.089002 & -0.7604 & 0.224723 \tabularnewline
42 & -0.082035 & -0.7009 & 0.242795 \tabularnewline
43 & 0.019457 & 0.1662 & 0.434214 \tabularnewline
44 & 0.024917 & 0.2129 & 0.416003 \tabularnewline
45 & 0.142441 & 1.217 & 0.113759 \tabularnewline
46 & -0.12153 & -1.0384 & 0.151267 \tabularnewline
47 & -0.138732 & -1.1853 & 0.119867 \tabularnewline
48 & 0.043451 & 0.3712 & 0.355765 \tabularnewline
\hline
\end{tabular}
%Source: https://freestatistics.org/blog/index.php?pk=120980&T=1

[TABLE]
[ROW][C]Autocorrelation Function[/C][/ROW]
[ROW][C]Time lag k[/C][C]ACF(k)[/C][C]T-STAT[/C][C]P-value[/C][/ROW]
[ROW][C]1[/C][C]-0.046533[/C][C]-0.3976[/C][C]0.34605[/C][/ROW]
[ROW][C]2[/C][C]-0.176619[/C][C]-1.509[/C][C]0.067803[/C][/ROW]
[ROW][C]3[/C][C]0.046613[/C][C]0.3983[/C][C]0.345799[/C][/ROW]
[ROW][C]4[/C][C]0.058459[/C][C]0.4995[/C][C]0.309474[/C][/ROW]
[ROW][C]5[/C][C]0.122876[/C][C]1.0498[/C][C]0.148625[/C][/ROW]
[ROW][C]6[/C][C]-0.108458[/C][C]-0.9267[/C][C]0.178578[/C][/ROW]
[ROW][C]7[/C][C]0.002584[/C][C]0.0221[/C][C]0.491223[/C][/ROW]
[ROW][C]8[/C][C]0.021369[/C][C]0.1826[/C][C]0.42782[/C][/ROW]
[ROW][C]9[/C][C]0.008357[/C][C]0.0714[/C][C]0.471636[/C][/ROW]
[ROW][C]10[/C][C]0.088168[/C][C]0.7533[/C][C]0.226845[/C][/ROW]
[ROW][C]11[/C][C]-0.149265[/C][C]-1.2753[/C][C]0.10312[/C][/ROW]
[ROW][C]12[/C][C]-0.017408[/C][C]-0.1487[/C][C]0.441087[/C][/ROW]
[ROW][C]13[/C][C]-0.022553[/C][C]-0.1927[/C][C]0.423868[/C][/ROW]
[ROW][C]14[/C][C]-0.043429[/C][C]-0.3711[/C][C]0.355836[/C][/ROW]
[ROW][C]15[/C][C]0.29707[/C][C]2.5382[/C][C]0.006638[/C][/ROW]
[ROW][C]16[/C][C]-0.064333[/C][C]-0.5497[/C][C]0.292115[/C][/ROW]
[ROW][C]17[/C][C]-0.109255[/C][C]-0.9335[/C][C]0.176825[/C][/ROW]
[ROW][C]18[/C][C]0.051721[/C][C]0.4419[/C][C]0.329933[/C][/ROW]
[ROW][C]19[/C][C]-0.03126[/C][C]-0.2671[/C][C]0.395078[/C][/ROW]
[ROW][C]20[/C][C]0.137355[/C][C]1.1736[/C][C]0.122193[/C][/ROW]
[ROW][C]21[/C][C]-0.023048[/C][C]-0.1969[/C][C]0.422219[/C][/ROW]
[ROW][C]22[/C][C]-0.068956[/C][C]-0.5892[/C][C]0.278785[/C][/ROW]
[ROW][C]23[/C][C]-0.017283[/C][C]-0.1477[/C][C]0.441506[/C][/ROW]
[ROW][C]24[/C][C]-0.045287[/C][C]-0.3869[/C][C]0.349966[/C][/ROW]
[ROW][C]25[/C][C]0.054282[/C][C]0.4638[/C][C]0.322089[/C][/ROW]
[ROW][C]26[/C][C]-0.09106[/C][C]-0.778[/C][C]0.219537[/C][/ROW]
[ROW][C]27[/C][C]0.04258[/C][C]0.3638[/C][C]0.358528[/C][/ROW]
[ROW][C]28[/C][C]0.034002[/C][C]0.2905[/C][C]0.386125[/C][/ROW]
[ROW][C]29[/C][C]-0.0655[/C][C]-0.5596[/C][C]0.288721[/C][/ROW]
[ROW][C]30[/C][C]0.16613[/C][C]1.4194[/C][C]0.080017[/C][/ROW]
[ROW][C]31[/C][C]-0.057052[/C][C]-0.4875[/C][C]0.313698[/C][/ROW]
[ROW][C]32[/C][C]-0.062308[/C][C]-0.5324[/C][C]0.298046[/C][/ROW]
[ROW][C]33[/C][C]-0.037398[/C][C]-0.3195[/C][C]0.375118[/C][/ROW]
[ROW][C]34[/C][C]0.037413[/C][C]0.3197[/C][C]0.375072[/C][/ROW]
[ROW][C]35[/C][C]0.051341[/C][C]0.4387[/C][C]0.331102[/C][/ROW]
[ROW][C]36[/C][C]0.010183[/C][C]0.087[/C][C]0.465453[/C][/ROW]
[ROW][C]37[/C][C]-0.051138[/C][C]-0.4369[/C][C]0.331727[/C][/ROW]
[ROW][C]38[/C][C]-0.139247[/C][C]-1.1897[/C][C]0.119004[/C][/ROW]
[ROW][C]39[/C][C]-0.095784[/C][C]-0.8184[/C][C]0.207901[/C][/ROW]
[ROW][C]40[/C][C]0.057967[/C][C]0.4953[/C][C]0.310949[/C][/ROW]
[ROW][C]41[/C][C]-0.089002[/C][C]-0.7604[/C][C]0.224723[/C][/ROW]
[ROW][C]42[/C][C]-0.082035[/C][C]-0.7009[/C][C]0.242795[/C][/ROW]
[ROW][C]43[/C][C]0.019457[/C][C]0.1662[/C][C]0.434214[/C][/ROW]
[ROW][C]44[/C][C]0.024917[/C][C]0.2129[/C][C]0.416003[/C][/ROW]
[ROW][C]45[/C][C]0.142441[/C][C]1.217[/C][C]0.113759[/C][/ROW]
[ROW][C]46[/C][C]-0.12153[/C][C]-1.0384[/C][C]0.151267[/C][/ROW]
[ROW][C]47[/C][C]-0.138732[/C][C]-1.1853[/C][C]0.119867[/C][/ROW]
[ROW][C]48[/C][C]0.043451[/C][C]0.3712[/C][C]0.355765[/C][/ROW]
[/TABLE]
Source: https://freestatistics.org/blog/index.php?pk=120980&T=1

Globally Unique Identifier (entire table): ba.freestatistics.org/blog/index.php?pk=120980&T=1

As an alternative you can also use a QR Code:  

The GUIDs for individual cells are displayed in the table below:

Autocorrelation Function
Time lag kACF(k)T-STATP-value
1-0.046533-0.39760.34605
2-0.176619-1.5090.067803
30.0466130.39830.345799
40.0584590.49950.309474
50.1228761.04980.148625
6-0.108458-0.92670.178578
70.0025840.02210.491223
80.0213690.18260.42782
90.0083570.07140.471636
100.0881680.75330.226845
11-0.149265-1.27530.10312
12-0.017408-0.14870.441087
13-0.022553-0.19270.423868
14-0.043429-0.37110.355836
150.297072.53820.006638
16-0.064333-0.54970.292115
17-0.109255-0.93350.176825
180.0517210.44190.329933
19-0.03126-0.26710.395078
200.1373551.17360.122193
21-0.023048-0.19690.422219
22-0.068956-0.58920.278785
23-0.017283-0.14770.441506
24-0.045287-0.38690.349966
250.0542820.46380.322089
26-0.09106-0.7780.219537
270.042580.36380.358528
280.0340020.29050.386125
29-0.0655-0.55960.288721
300.166131.41940.080017
31-0.057052-0.48750.313698
32-0.062308-0.53240.298046
33-0.037398-0.31950.375118
340.0374130.31970.375072
350.0513410.43870.331102
360.0101830.0870.465453
37-0.051138-0.43690.331727
38-0.139247-1.18970.119004
39-0.095784-0.81840.207901
400.0579670.49530.310949
41-0.089002-0.76040.224723
42-0.082035-0.70090.242795
430.0194570.16620.434214
440.0249170.21290.416003
450.1424411.2170.113759
46-0.12153-1.03840.151267
47-0.138732-1.18530.119867
480.0434510.37120.355765


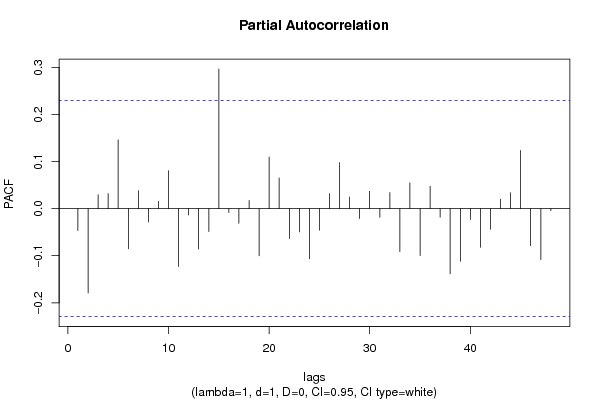
Partial Autocorrelation Function
Time lag kPACF(k)T-STATP-value
1-0.046533-0.39760.34605
2-0.179173-1.53090.065064
30.0295970.25290.400537
40.0319060.27260.392962
50.1460951.24820.107966
6-0.085066-0.72680.234836
70.0379370.32410.373381
8-0.028261-0.24150.404938
90.0154230.13180.447762
100.0805540.68830.246738
11-0.122832-1.04950.14871
12-0.013402-0.11450.454574
13-0.085616-0.73150.233408
14-0.04858-0.41510.339656
150.2966652.53470.006699
16-0.008237-0.07040.472044
17-0.030877-0.26380.396334
180.0171320.14640.442016
19-0.0999-0.85350.198073
200.1097380.93760.17577
210.0650380.55570.290061
22-0.063559-0.5430.294375
23-0.049316-0.42140.337368
24-0.106441-0.90940.183058
25-0.045641-0.390.348852
260.03190.27260.392981
270.0976790.83460.203341
280.0245480.20970.417227
29-0.021005-0.17950.429034
300.0367050.31360.377357
31-0.018161-0.15520.438558
320.0341080.29140.38578
33-0.091165-0.77890.219275
340.054650.46690.320971
35-0.099545-0.85050.19891
360.047470.40560.343117
37-0.018118-0.15480.438703
38-0.138291-1.18160.120608
39-0.111784-0.95510.171345
40-0.023022-0.19670.422303
41-0.081984-0.70050.242929
42-0.043762-0.37390.35478
430.0197810.1690.433129
440.0335940.2870.387452
450.1234671.05490.147475
46-0.078626-0.67180.251923
47-0.10799-0.92270.179609
48-0.004226-0.03610.485649

\begin{tabular}{lllllllll}
\hline
Partial Autocorrelation Function \tabularnewline
Time lag k & PACF(k) & T-STAT & P-value \tabularnewline
1 & -0.046533 & -0.3976 & 0.34605 \tabularnewline
2 & -0.179173 & -1.5309 & 0.065064 \tabularnewline
3 & 0.029597 & 0.2529 & 0.400537 \tabularnewline
4 & 0.031906 & 0.2726 & 0.392962 \tabularnewline
5 & 0.146095 & 1.2482 & 0.107966 \tabularnewline
6 & -0.085066 & -0.7268 & 0.234836 \tabularnewline
7 & 0.037937 & 0.3241 & 0.373381 \tabularnewline
8 & -0.028261 & -0.2415 & 0.404938 \tabularnewline
9 & 0.015423 & 0.1318 & 0.447762 \tabularnewline
10 & 0.080554 & 0.6883 & 0.246738 \tabularnewline
11 & -0.122832 & -1.0495 & 0.14871 \tabularnewline
12 & -0.013402 & -0.1145 & 0.454574 \tabularnewline
13 & -0.085616 & -0.7315 & 0.233408 \tabularnewline
14 & -0.04858 & -0.4151 & 0.339656 \tabularnewline
15 & 0.296665 & 2.5347 & 0.006699 \tabularnewline
16 & -0.008237 & -0.0704 & 0.472044 \tabularnewline
17 & -0.030877 & -0.2638 & 0.396334 \tabularnewline
18 & 0.017132 & 0.1464 & 0.442016 \tabularnewline
19 & -0.0999 & -0.8535 & 0.198073 \tabularnewline
20 & 0.109738 & 0.9376 & 0.17577 \tabularnewline
21 & 0.065038 & 0.5557 & 0.290061 \tabularnewline
22 & -0.063559 & -0.543 & 0.294375 \tabularnewline
23 & -0.049316 & -0.4214 & 0.337368 \tabularnewline
24 & -0.106441 & -0.9094 & 0.183058 \tabularnewline
25 & -0.045641 & -0.39 & 0.348852 \tabularnewline
26 & 0.0319 & 0.2726 & 0.392981 \tabularnewline
27 & 0.097679 & 0.8346 & 0.203341 \tabularnewline
28 & 0.024548 & 0.2097 & 0.417227 \tabularnewline
29 & -0.021005 & -0.1795 & 0.429034 \tabularnewline
30 & 0.036705 & 0.3136 & 0.377357 \tabularnewline
31 & -0.018161 & -0.1552 & 0.438558 \tabularnewline
32 & 0.034108 & 0.2914 & 0.38578 \tabularnewline
33 & -0.091165 & -0.7789 & 0.219275 \tabularnewline
34 & 0.05465 & 0.4669 & 0.320971 \tabularnewline
35 & -0.099545 & -0.8505 & 0.19891 \tabularnewline
36 & 0.04747 & 0.4056 & 0.343117 \tabularnewline
37 & -0.018118 & -0.1548 & 0.438703 \tabularnewline
38 & -0.138291 & -1.1816 & 0.120608 \tabularnewline
39 & -0.111784 & -0.9551 & 0.171345 \tabularnewline
40 & -0.023022 & -0.1967 & 0.422303 \tabularnewline
41 & -0.081984 & -0.7005 & 0.242929 \tabularnewline
42 & -0.043762 & -0.3739 & 0.35478 \tabularnewline
43 & 0.019781 & 0.169 & 0.433129 \tabularnewline
44 & 0.033594 & 0.287 & 0.387452 \tabularnewline
45 & 0.123467 & 1.0549 & 0.147475 \tabularnewline
46 & -0.078626 & -0.6718 & 0.251923 \tabularnewline
47 & -0.10799 & -0.9227 & 0.179609 \tabularnewline
48 & -0.004226 & -0.0361 & 0.485649 \tabularnewline
\hline
\end{tabular}
%Source: https://freestatistics.org/blog/index.php?pk=120980&T=2

[TABLE]
[ROW][C]Partial Autocorrelation Function[/C][/ROW]
[ROW][C]Time lag k[/C][C]PACF(k)[/C][C]T-STAT[/C][C]P-value[/C][/ROW]
[ROW][C]1[/C][C]-0.046533[/C][C]-0.3976[/C][C]0.34605[/C][/ROW]
[ROW][C]2[/C][C]-0.179173[/C][C]-1.5309[/C][C]0.065064[/C][/ROW]
[ROW][C]3[/C][C]0.029597[/C][C]0.2529[/C][C]0.400537[/C][/ROW]
[ROW][C]4[/C][C]0.031906[/C][C]0.2726[/C][C]0.392962[/C][/ROW]
[ROW][C]5[/C][C]0.146095[/C][C]1.2482[/C][C]0.107966[/C][/ROW]
[ROW][C]6[/C][C]-0.085066[/C][C]-0.7268[/C][C]0.234836[/C][/ROW]
[ROW][C]7[/C][C]0.037937[/C][C]0.3241[/C][C]0.373381[/C][/ROW]
[ROW][C]8[/C][C]-0.028261[/C][C]-0.2415[/C][C]0.404938[/C][/ROW]
[ROW][C]9[/C][C]0.015423[/C][C]0.1318[/C][C]0.447762[/C][/ROW]
[ROW][C]10[/C][C]0.080554[/C][C]0.6883[/C][C]0.246738[/C][/ROW]
[ROW][C]11[/C][C]-0.122832[/C][C]-1.0495[/C][C]0.14871[/C][/ROW]
[ROW][C]12[/C][C]-0.013402[/C][C]-0.1145[/C][C]0.454574[/C][/ROW]
[ROW][C]13[/C][C]-0.085616[/C][C]-0.7315[/C][C]0.233408[/C][/ROW]
[ROW][C]14[/C][C]-0.04858[/C][C]-0.4151[/C][C]0.339656[/C][/ROW]
[ROW][C]15[/C][C]0.296665[/C][C]2.5347[/C][C]0.006699[/C][/ROW]
[ROW][C]16[/C][C]-0.008237[/C][C]-0.0704[/C][C]0.472044[/C][/ROW]
[ROW][C]17[/C][C]-0.030877[/C][C]-0.2638[/C][C]0.396334[/C][/ROW]
[ROW][C]18[/C][C]0.017132[/C][C]0.1464[/C][C]0.442016[/C][/ROW]
[ROW][C]19[/C][C]-0.0999[/C][C]-0.8535[/C][C]0.198073[/C][/ROW]
[ROW][C]20[/C][C]0.109738[/C][C]0.9376[/C][C]0.17577[/C][/ROW]
[ROW][C]21[/C][C]0.065038[/C][C]0.5557[/C][C]0.290061[/C][/ROW]
[ROW][C]22[/C][C]-0.063559[/C][C]-0.543[/C][C]0.294375[/C][/ROW]
[ROW][C]23[/C][C]-0.049316[/C][C]-0.4214[/C][C]0.337368[/C][/ROW]
[ROW][C]24[/C][C]-0.106441[/C][C]-0.9094[/C][C]0.183058[/C][/ROW]
[ROW][C]25[/C][C]-0.045641[/C][C]-0.39[/C][C]0.348852[/C][/ROW]
[ROW][C]26[/C][C]0.0319[/C][C]0.2726[/C][C]0.392981[/C][/ROW]
[ROW][C]27[/C][C]0.097679[/C][C]0.8346[/C][C]0.203341[/C][/ROW]
[ROW][C]28[/C][C]0.024548[/C][C]0.2097[/C][C]0.417227[/C][/ROW]
[ROW][C]29[/C][C]-0.021005[/C][C]-0.1795[/C][C]0.429034[/C][/ROW]
[ROW][C]30[/C][C]0.036705[/C][C]0.3136[/C][C]0.377357[/C][/ROW]
[ROW][C]31[/C][C]-0.018161[/C][C]-0.1552[/C][C]0.438558[/C][/ROW]
[ROW][C]32[/C][C]0.034108[/C][C]0.2914[/C][C]0.38578[/C][/ROW]
[ROW][C]33[/C][C]-0.091165[/C][C]-0.7789[/C][C]0.219275[/C][/ROW]
[ROW][C]34[/C][C]0.05465[/C][C]0.4669[/C][C]0.320971[/C][/ROW]
[ROW][C]35[/C][C]-0.099545[/C][C]-0.8505[/C][C]0.19891[/C][/ROW]
[ROW][C]36[/C][C]0.04747[/C][C]0.4056[/C][C]0.343117[/C][/ROW]
[ROW][C]37[/C][C]-0.018118[/C][C]-0.1548[/C][C]0.438703[/C][/ROW]
[ROW][C]38[/C][C]-0.138291[/C][C]-1.1816[/C][C]0.120608[/C][/ROW]
[ROW][C]39[/C][C]-0.111784[/C][C]-0.9551[/C][C]0.171345[/C][/ROW]
[ROW][C]40[/C][C]-0.023022[/C][C]-0.1967[/C][C]0.422303[/C][/ROW]
[ROW][C]41[/C][C]-0.081984[/C][C]-0.7005[/C][C]0.242929[/C][/ROW]
[ROW][C]42[/C][C]-0.043762[/C][C]-0.3739[/C][C]0.35478[/C][/ROW]
[ROW][C]43[/C][C]0.019781[/C][C]0.169[/C][C]0.433129[/C][/ROW]
[ROW][C]44[/C][C]0.033594[/C][C]0.287[/C][C]0.387452[/C][/ROW]
[ROW][C]45[/C][C]0.123467[/C][C]1.0549[/C][C]0.147475[/C][/ROW]
[ROW][C]46[/C][C]-0.078626[/C][C]-0.6718[/C][C]0.251923[/C][/ROW]
[ROW][C]47[/C][C]-0.10799[/C][C]-0.9227[/C][C]0.179609[/C][/ROW]
[ROW][C]48[/C][C]-0.004226[/C][C]-0.0361[/C][C]0.485649[/C][/ROW]
[/TABLE]
Source: https://freestatistics.org/blog/index.php?pk=120980&T=2

Globally Unique Identifier (entire table): ba.freestatistics.org/blog/index.php?pk=120980&T=2

As an alternative you can also use a QR Code:  

The GUIDs for individual cells are displayed in the table below:

Partial Autocorrelation Function
Time lag kPACF(k)T-STATP-value
1-0.046533-0.39760.34605
2-0.179173-1.53090.065064
30.0295970.25290.400537
40.0319060.27260.392962
50.1460951.24820.107966
6-0.085066-0.72680.234836
70.0379370.32410.373381
8-0.028261-0.24150.404938
90.0154230.13180.447762
100.0805540.68830.246738
11-0.122832-1.04950.14871
12-0.013402-0.11450.454574
13-0.085616-0.73150.233408
14-0.04858-0.41510.339656
150.2966652.53470.006699
16-0.008237-0.07040.472044
17-0.030877-0.26380.396334
180.0171320.14640.442016
19-0.0999-0.85350.198073
200.1097380.93760.17577
210.0650380.55570.290061
22-0.063559-0.5430.294375
23-0.049316-0.42140.337368
24-0.106441-0.90940.183058
25-0.045641-0.390.348852
260.03190.27260.392981
270.0976790.83460.203341
280.0245480.20970.417227
29-0.021005-0.17950.429034
300.0367050.31360.377357
31-0.018161-0.15520.438558
320.0341080.29140.38578
33-0.091165-0.77890.219275
340.054650.46690.320971
35-0.099545-0.85050.19891
360.047470.40560.343117
37-0.018118-0.15480.438703
38-0.138291-1.18160.120608
39-0.111784-0.95510.171345
40-0.023022-0.19670.422303
41-0.081984-0.70050.242929
42-0.043762-0.37390.35478
430.0197810.1690.433129
440.0335940.2870.387452
450.1234671.05490.147475
46-0.078626-0.67180.251923
47-0.10799-0.92270.179609
48-0.004226-0.03610.485649


Parameters (Session):
par1 = 48 ; par2 = 1 ; par3 = 1 ; par4 = 0 ; par5 = 12 ; par6 = White Noise ; par7 = 0.95 ;
Parameters (R input):
par1 = 48 ; par2 = 1 ; par3 = 1 ; par4 = 0 ; par5 = 12 ; par6 = White Noise ; par7 = 0.95 ; par8 = ;
R code (references can be found in the software module):
if (par1 == 'Default') {
par1 = 10*log10(length(x))
} else {
par1 <- as.numeric(par1)
}
par2 <- as.numeric(par2)
par3 <- as.numeric(par3)
par4 <- as.numeric(par4)
par5 <- as.numeric(par5)
if (par6 == 'White Noise') par6 <- 'white' else par6 <- 'ma'
par7 <- as.numeric(par7)
if (par8 != '') par8 <- as.numeric(par8)
ox <- x
if (par8 == '') {
if (par2 == 0) {
x <- log(x)
} else {
x <- (x ^ par2 - 1) / par2
}
} else {
x <- log(x,base=par8)
}
if (par3 > 0) x <- diff(x,lag=1,difference=par3)
if (par4 > 0) x <- diff(x,lag=par5,difference=par4)
bitmap(file='picts.png')
op <- par(mfrow=c(2,1))
plot(ox,type='l',main='Original Time Series',xlab='time',ylab='value')
if (par8=='') {
mytitle <- paste('Working Time Series (lambda=',par2,', d=',par3,', D=',par4,')',sep='')
mysub <- paste('(lambda=',par2,', d=',par3,', D=',par4,', CI=', par7, ', CI type=',par6,')',sep='')
} else {
mytitle <- paste('Working Time Series (base=',par8,', d=',par3,', D=',par4,')',sep='')
mysub <- paste('(base=',par8,', d=',par3,', D=',par4,', CI=', par7, ', CI type=',par6,')',sep='')
}
plot(x,type='l', main=mytitle,xlab='time',ylab='value')
par(op)
dev.off()
bitmap(file='pic1.png')
racf <- acf(x, par1, main='Autocorrelation', xlab='time lag', ylab='ACF', ci.type=par6, ci=par7, sub=mysub)
dev.off()
bitmap(file='pic2.png')
rpacf <- pacf(x,par1,main='Partial Autocorrelation',xlab='lags',ylab='PACF',sub=mysub)
dev.off()
(myacf <- c(racf$acf))
(mypacf <- c(rpacf$acf))
lengthx <- length(x)
sqrtn <- sqrt(lengthx)
load(file='createtable')
a<-table.start()
a<-table.row.start(a)
a<-table.element(a,'Autocorrelation Function',4,TRUE)
a<-table.row.end(a)
a<-table.row.start(a)
a<-table.element(a,'Time lag k',header=TRUE)
a<-table.element(a,hyperlink('basics.htm','ACF(k)','click here for more information about the Autocorrelation Function'),header=TRUE)
a<-table.element(a,'T-STAT',header=TRUE)
a<-table.element(a,'P-value',header=TRUE)
a<-table.row.end(a)
for (i in 2:(par1+1)) {
a<-table.row.start(a)
a<-table.element(a,i-1,header=TRUE)
a<-table.element(a,round(myacf[i],6))
mytstat <- myacf[i]*sqrtn
a<-table.element(a,round(mytstat,4))
a<-table.element(a,round(1-pt(abs(mytstat),lengthx),6))
a<-table.row.end(a)
}
a<-table.end(a)
table.save(a,file='mytable.tab')
a<-table.start()
a<-table.row.start(a)
a<-table.element(a,'Partial Autocorrelation Function',4,TRUE)
a<-table.row.end(a)
a<-table.row.start(a)
a<-table.element(a,'Time lag k',header=TRUE)
a<-table.element(a,hyperlink('basics.htm','PACF(k)','click here for more information about the Partial Autocorrelation Function'),header=TRUE)
a<-table.element(a,'T-STAT',header=TRUE)
a<-table.element(a,'P-value',header=TRUE)
a<-table.row.end(a)
for (i in 1:par1) {
a<-table.row.start(a)
a<-table.element(a,i,header=TRUE)
a<-table.element(a,round(mypacf[i],6))
mytstat <- mypacf[i]*sqrtn
a<-table.element(a,round(mytstat,4))
a<-table.element(a,round(1-pt(abs(mytstat),lengthx),6))
a<-table.row.end(a)
}
a<-table.end(a)
table.save(a,file='mytable1.tab')