Free Statistics

of Irreproducible Research!

Author's title

Author*Unverified author*
R Software Modulerwasp_autocorrelation.wasp
Title produced by software(Partial) Autocorrelation Function
Date of computationWed, 04 May 2011 16:42:53 +0000
Cite this page as followsStatistical Computations at FreeStatistics.org, Office for Research Development and Education, URL https://freestatistics.org/blog/index.php?v=date/2011/May/04/t1304527277s2ay4hym7y276b5.htm/, Retrieved Mon, 13 May 2024 04:26:35 +0000
Statistical Computations at FreeStatistics.org, Office for Research Development and Education, URL https://freestatistics.org/blog/index.php?pk=120979, Retrieved Mon, 13 May 2024 04:26:35 +0000
QR Codes:

Original text written by user:
IsPrivate?No (this computation is public)
User-defined keywordsKDGP2W11
Estimated Impact85
Family? (F = Feedback message, R = changed R code, M = changed R Module, P = changed Parameters, D = changed Data)
-       [(Partial) Autocorrelation Function] [] [2011-05-04 16:42:53] [60509181c3aa3f51e201bae3996eda3b] [Current]
Feedback Forum

Post a new message
Dataseries X:
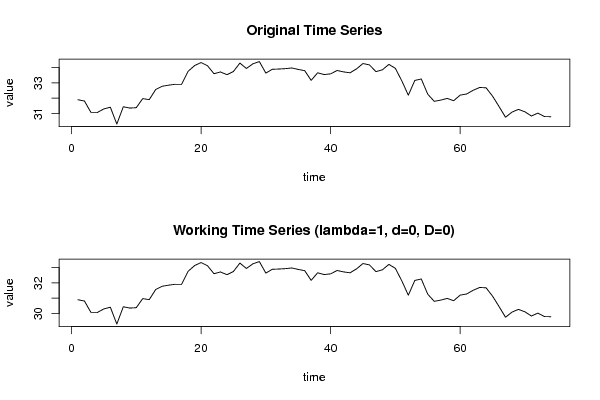
31.900
31.815
31.075
31.070
31.300
31.410
30.310
31.440
31.355
31.380
31.975
31.905
32.565
32.780
32.850
32.910
32.910
33.755
34.130
34.330
34.120
33.600
33.715
33.535
33.745
34.295
33.940
34.245
34.395
33.640
33.890
33.905
33.930
33.975
33.880
33.800
33.165
33.660
33.545
33.590
33.810
33.720
33.660
33.915
34.265
34.175
33.735
33.855
34.210
33.950
33.130
32.195
33.160
33.255
32.260
31.795
31.875
31.985
31.835
32.200
32.275
32.515
32.700
32.680
32.135
31.460
30.755
31.090
31.270
31.110
30.835
31.025
30.800
30.790


Summary of computational transaction
Raw Inputview raw input (R code)
Raw Outputview raw output of R engine
Computing time1 seconds
R Server'George Udny Yule' @ 216.218.223.82

\begin{tabular}{lllllllll}
\hline
Summary of computational transaction \tabularnewline
Raw Input & view raw input (R code)  \tabularnewline
Raw Output & view raw output of R engine  \tabularnewline
Computing time & 1 seconds \tabularnewline
R Server & 'George Udny Yule' @ 216.218.223.82 \tabularnewline
\hline
\end{tabular}
%Source: https://freestatistics.org/blog/index.php?pk=120979&T=0

[TABLE]
[ROW][C]Summary of computational transaction[/C][/ROW]
[ROW][C]Raw Input[/C][C]view raw input (R code) [/C][/ROW]
[ROW][C]Raw Output[/C][C]view raw output of R engine [/C][/ROW]
[ROW][C]Computing time[/C][C]1 seconds[/C][/ROW]
[ROW][C]R Server[/C][C]'George Udny Yule' @ 216.218.223.82[/C][/ROW]
[/TABLE]
Source: https://freestatistics.org/blog/index.php?pk=120979&T=0

Globally Unique Identifier (entire table): ba.freestatistics.org/blog/index.php?pk=120979&T=0

As an alternative you can also use a QR Code:  

The GUIDs for individual cells are displayed in the table below:

Summary of computational transaction
Raw Inputview raw input (R code)
Raw Outputview raw output of R engine
Computing time1 seconds
R Server'George Udny Yule' @ 216.218.223.82


Autocorrelation Function
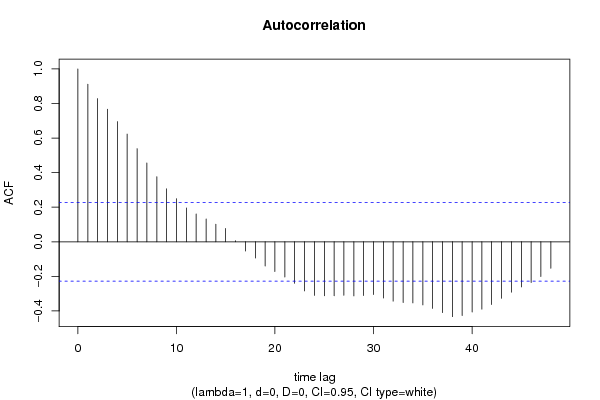
Time lag kACF(k)T-STATP-value
10.911577.84160
20.8285657.12760
30.7668236.59650
40.6951935.98030
50.623145.36050
60.5389714.63647e-06
70.4563263.92559.6e-05
80.376293.2370.000904
90.3064122.63590.00511
100.2488432.14060.017799
110.1954061.68090.048495
120.1614431.38880.084532
130.1317261.13320.130404
140.1020260.87770.191485
150.0770310.66260.254809
160.0062870.05410.478508
17-0.05328-0.45830.324029
18-0.093813-0.8070.211125
19-0.1399-1.20350.116317
20-0.17152-1.47550.072164
21-0.203802-1.75320.041857
22-0.239421-2.05960.021478
23-0.284028-2.44330.008469
24-0.309856-2.66550.004717
25-0.312071-2.68450.004479
26-0.311775-2.6820.00451
27-0.3095-2.66240.004756
28-0.312696-2.68990.004414
29-0.31064-2.67220.004632
30-0.304608-2.62030.005327
31-0.325114-2.79670.003287
32-0.343065-2.95120.002119
33-0.351568-3.02430.001712
34-0.353137-3.03780.001646
35-0.36481-3.13820.00122
36-0.384889-3.31090.00072
37-0.409455-3.52230.000369
38-0.432888-3.72380.00019
39-0.426747-3.6710.000227
40-0.406151-3.49380.000404
41-0.389519-3.35080.000636
42-0.362908-3.12190.001282
43-0.326586-2.80940.003173
44-0.29105-2.50370.007247
45-0.260867-2.24410.01391
46-0.235549-2.02630.023171
47-0.200952-1.72870.044021
48-0.153151-1.31750.095875

\begin{tabular}{lllllllll}
\hline
Autocorrelation Function \tabularnewline
Time lag k & ACF(k) & T-STAT & P-value \tabularnewline
1 & 0.91157 & 7.8416 & 0 \tabularnewline
2 & 0.828565 & 7.1276 & 0 \tabularnewline
3 & 0.766823 & 6.5965 & 0 \tabularnewline
4 & 0.695193 & 5.9803 & 0 \tabularnewline
5 & 0.62314 & 5.3605 & 0 \tabularnewline
6 & 0.538971 & 4.6364 & 7e-06 \tabularnewline
7 & 0.456326 & 3.9255 & 9.6e-05 \tabularnewline
8 & 0.37629 & 3.237 & 0.000904 \tabularnewline
9 & 0.306412 & 2.6359 & 0.00511 \tabularnewline
10 & 0.248843 & 2.1406 & 0.017799 \tabularnewline
11 & 0.195406 & 1.6809 & 0.048495 \tabularnewline
12 & 0.161443 & 1.3888 & 0.084532 \tabularnewline
13 & 0.131726 & 1.1332 & 0.130404 \tabularnewline
14 & 0.102026 & 0.8777 & 0.191485 \tabularnewline
15 & 0.077031 & 0.6626 & 0.254809 \tabularnewline
16 & 0.006287 & 0.0541 & 0.478508 \tabularnewline
17 & -0.05328 & -0.4583 & 0.324029 \tabularnewline
18 & -0.093813 & -0.807 & 0.211125 \tabularnewline
19 & -0.1399 & -1.2035 & 0.116317 \tabularnewline
20 & -0.17152 & -1.4755 & 0.072164 \tabularnewline
21 & -0.203802 & -1.7532 & 0.041857 \tabularnewline
22 & -0.239421 & -2.0596 & 0.021478 \tabularnewline
23 & -0.284028 & -2.4433 & 0.008469 \tabularnewline
24 & -0.309856 & -2.6655 & 0.004717 \tabularnewline
25 & -0.312071 & -2.6845 & 0.004479 \tabularnewline
26 & -0.311775 & -2.682 & 0.00451 \tabularnewline
27 & -0.3095 & -2.6624 & 0.004756 \tabularnewline
28 & -0.312696 & -2.6899 & 0.004414 \tabularnewline
29 & -0.31064 & -2.6722 & 0.004632 \tabularnewline
30 & -0.304608 & -2.6203 & 0.005327 \tabularnewline
31 & -0.325114 & -2.7967 & 0.003287 \tabularnewline
32 & -0.343065 & -2.9512 & 0.002119 \tabularnewline
33 & -0.351568 & -3.0243 & 0.001712 \tabularnewline
34 & -0.353137 & -3.0378 & 0.001646 \tabularnewline
35 & -0.36481 & -3.1382 & 0.00122 \tabularnewline
36 & -0.384889 & -3.3109 & 0.00072 \tabularnewline
37 & -0.409455 & -3.5223 & 0.000369 \tabularnewline
38 & -0.432888 & -3.7238 & 0.00019 \tabularnewline
39 & -0.426747 & -3.671 & 0.000227 \tabularnewline
40 & -0.406151 & -3.4938 & 0.000404 \tabularnewline
41 & -0.389519 & -3.3508 & 0.000636 \tabularnewline
42 & -0.362908 & -3.1219 & 0.001282 \tabularnewline
43 & -0.326586 & -2.8094 & 0.003173 \tabularnewline
44 & -0.29105 & -2.5037 & 0.007247 \tabularnewline
45 & -0.260867 & -2.2441 & 0.01391 \tabularnewline
46 & -0.235549 & -2.0263 & 0.023171 \tabularnewline
47 & -0.200952 & -1.7287 & 0.044021 \tabularnewline
48 & -0.153151 & -1.3175 & 0.095875 \tabularnewline
\hline
\end{tabular}
%Source: https://freestatistics.org/blog/index.php?pk=120979&T=1

[TABLE]
[ROW][C]Autocorrelation Function[/C][/ROW]
[ROW][C]Time lag k[/C][C]ACF(k)[/C][C]T-STAT[/C][C]P-value[/C][/ROW]
[ROW][C]1[/C][C]0.91157[/C][C]7.8416[/C][C]0[/C][/ROW]
[ROW][C]2[/C][C]0.828565[/C][C]7.1276[/C][C]0[/C][/ROW]
[ROW][C]3[/C][C]0.766823[/C][C]6.5965[/C][C]0[/C][/ROW]
[ROW][C]4[/C][C]0.695193[/C][C]5.9803[/C][C]0[/C][/ROW]
[ROW][C]5[/C][C]0.62314[/C][C]5.3605[/C][C]0[/C][/ROW]
[ROW][C]6[/C][C]0.538971[/C][C]4.6364[/C][C]7e-06[/C][/ROW]
[ROW][C]7[/C][C]0.456326[/C][C]3.9255[/C][C]9.6e-05[/C][/ROW]
[ROW][C]8[/C][C]0.37629[/C][C]3.237[/C][C]0.000904[/C][/ROW]
[ROW][C]9[/C][C]0.306412[/C][C]2.6359[/C][C]0.00511[/C][/ROW]
[ROW][C]10[/C][C]0.248843[/C][C]2.1406[/C][C]0.017799[/C][/ROW]
[ROW][C]11[/C][C]0.195406[/C][C]1.6809[/C][C]0.048495[/C][/ROW]
[ROW][C]12[/C][C]0.161443[/C][C]1.3888[/C][C]0.084532[/C][/ROW]
[ROW][C]13[/C][C]0.131726[/C][C]1.1332[/C][C]0.130404[/C][/ROW]
[ROW][C]14[/C][C]0.102026[/C][C]0.8777[/C][C]0.191485[/C][/ROW]
[ROW][C]15[/C][C]0.077031[/C][C]0.6626[/C][C]0.254809[/C][/ROW]
[ROW][C]16[/C][C]0.006287[/C][C]0.0541[/C][C]0.478508[/C][/ROW]
[ROW][C]17[/C][C]-0.05328[/C][C]-0.4583[/C][C]0.324029[/C][/ROW]
[ROW][C]18[/C][C]-0.093813[/C][C]-0.807[/C][C]0.211125[/C][/ROW]
[ROW][C]19[/C][C]-0.1399[/C][C]-1.2035[/C][C]0.116317[/C][/ROW]
[ROW][C]20[/C][C]-0.17152[/C][C]-1.4755[/C][C]0.072164[/C][/ROW]
[ROW][C]21[/C][C]-0.203802[/C][C]-1.7532[/C][C]0.041857[/C][/ROW]
[ROW][C]22[/C][C]-0.239421[/C][C]-2.0596[/C][C]0.021478[/C][/ROW]
[ROW][C]23[/C][C]-0.284028[/C][C]-2.4433[/C][C]0.008469[/C][/ROW]
[ROW][C]24[/C][C]-0.309856[/C][C]-2.6655[/C][C]0.004717[/C][/ROW]
[ROW][C]25[/C][C]-0.312071[/C][C]-2.6845[/C][C]0.004479[/C][/ROW]
[ROW][C]26[/C][C]-0.311775[/C][C]-2.682[/C][C]0.00451[/C][/ROW]
[ROW][C]27[/C][C]-0.3095[/C][C]-2.6624[/C][C]0.004756[/C][/ROW]
[ROW][C]28[/C][C]-0.312696[/C][C]-2.6899[/C][C]0.004414[/C][/ROW]
[ROW][C]29[/C][C]-0.31064[/C][C]-2.6722[/C][C]0.004632[/C][/ROW]
[ROW][C]30[/C][C]-0.304608[/C][C]-2.6203[/C][C]0.005327[/C][/ROW]
[ROW][C]31[/C][C]-0.325114[/C][C]-2.7967[/C][C]0.003287[/C][/ROW]
[ROW][C]32[/C][C]-0.343065[/C][C]-2.9512[/C][C]0.002119[/C][/ROW]
[ROW][C]33[/C][C]-0.351568[/C][C]-3.0243[/C][C]0.001712[/C][/ROW]
[ROW][C]34[/C][C]-0.353137[/C][C]-3.0378[/C][C]0.001646[/C][/ROW]
[ROW][C]35[/C][C]-0.36481[/C][C]-3.1382[/C][C]0.00122[/C][/ROW]
[ROW][C]36[/C][C]-0.384889[/C][C]-3.3109[/C][C]0.00072[/C][/ROW]
[ROW][C]37[/C][C]-0.409455[/C][C]-3.5223[/C][C]0.000369[/C][/ROW]
[ROW][C]38[/C][C]-0.432888[/C][C]-3.7238[/C][C]0.00019[/C][/ROW]
[ROW][C]39[/C][C]-0.426747[/C][C]-3.671[/C][C]0.000227[/C][/ROW]
[ROW][C]40[/C][C]-0.406151[/C][C]-3.4938[/C][C]0.000404[/C][/ROW]
[ROW][C]41[/C][C]-0.389519[/C][C]-3.3508[/C][C]0.000636[/C][/ROW]
[ROW][C]42[/C][C]-0.362908[/C][C]-3.1219[/C][C]0.001282[/C][/ROW]
[ROW][C]43[/C][C]-0.326586[/C][C]-2.8094[/C][C]0.003173[/C][/ROW]
[ROW][C]44[/C][C]-0.29105[/C][C]-2.5037[/C][C]0.007247[/C][/ROW]
[ROW][C]45[/C][C]-0.260867[/C][C]-2.2441[/C][C]0.01391[/C][/ROW]
[ROW][C]46[/C][C]-0.235549[/C][C]-2.0263[/C][C]0.023171[/C][/ROW]
[ROW][C]47[/C][C]-0.200952[/C][C]-1.7287[/C][C]0.044021[/C][/ROW]
[ROW][C]48[/C][C]-0.153151[/C][C]-1.3175[/C][C]0.095875[/C][/ROW]
[/TABLE]
Source: https://freestatistics.org/blog/index.php?pk=120979&T=1

Globally Unique Identifier (entire table): ba.freestatistics.org/blog/index.php?pk=120979&T=1

As an alternative you can also use a QR Code:  

The GUIDs for individual cells are displayed in the table below:

Autocorrelation Function
Time lag kACF(k)T-STATP-value
10.911577.84160
20.8285657.12760
30.7668236.59650
40.6951935.98030
50.623145.36050
60.5389714.63647e-06
70.4563263.92559.6e-05
80.376293.2370.000904
90.3064122.63590.00511
100.2488432.14060.017799
110.1954061.68090.048495
120.1614431.38880.084532
130.1317261.13320.130404
140.1020260.87770.191485
150.0770310.66260.254809
160.0062870.05410.478508
17-0.05328-0.45830.324029
18-0.093813-0.8070.211125
19-0.1399-1.20350.116317
20-0.17152-1.47550.072164
21-0.203802-1.75320.041857
22-0.239421-2.05960.021478
23-0.284028-2.44330.008469
24-0.309856-2.66550.004717
25-0.312071-2.68450.004479
26-0.311775-2.6820.00451
27-0.3095-2.66240.004756
28-0.312696-2.68990.004414
29-0.31064-2.67220.004632
30-0.304608-2.62030.005327
31-0.325114-2.79670.003287
32-0.343065-2.95120.002119
33-0.351568-3.02430.001712
34-0.353137-3.03780.001646
35-0.36481-3.13820.00122
36-0.384889-3.31090.00072
37-0.409455-3.52230.000369
38-0.432888-3.72380.00019
39-0.426747-3.6710.000227
40-0.406151-3.49380.000404
41-0.389519-3.35080.000636
42-0.362908-3.12190.001282
43-0.326586-2.80940.003173
44-0.29105-2.50370.007247
45-0.260867-2.24410.01391
46-0.235549-2.02630.023171
47-0.200952-1.72870.044021
48-0.153151-1.31750.095875


Partial Autocorrelation Function
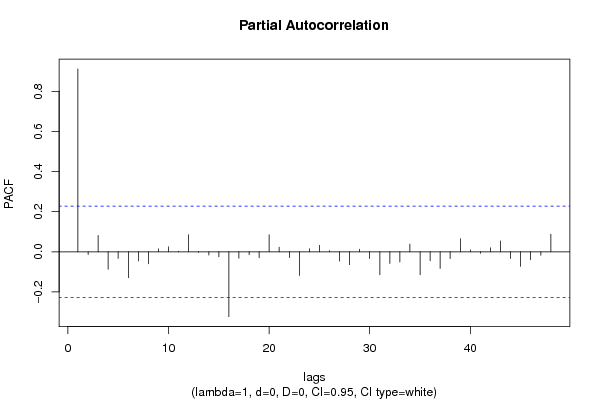
Time lag kPACF(k)T-STATP-value
10.911577.84160
2-0.014166-0.12190.451671
30.0813080.69940.243236
4-0.087586-0.75340.226788
5-0.033041-0.28420.388514
6-0.129505-1.1140.134433
7-0.04548-0.39120.348373
8-0.060033-0.51640.303548
90.0143060.12310.451194
100.024340.20940.417363
110.00280.02410.490424
120.0846530.72820.234391
13-0.003202-0.02750.489049
14-0.016222-0.13950.444699
15-0.025166-0.21650.414602
16-0.323656-2.78420.003404
17-0.031722-0.27290.39285
18-0.015146-0.13030.448344
19-0.029584-0.25450.399913
200.0852280.73320.232889
210.0224270.19290.423773
22-0.02862-0.24620.403104
23-0.118419-1.01870.155838
240.0147540.12690.449674
250.0319650.2750.392051
260.0046560.04010.484078
27-0.046623-0.40110.344765
28-0.064342-0.55350.290799
290.01240.10670.457671
30-0.033421-0.28750.387266
31-0.114463-0.98470.164002
32-0.05822-0.50080.30899
33-0.051356-0.44180.329969
340.0381850.32850.371738
35-0.114633-0.98610.163646
36-0.045102-0.3880.349571
37-0.082998-0.7140.238745
38-0.033882-0.29150.385757
390.0644780.55470.290401
400.0087140.0750.470224
41-0.007368-0.06340.474816
420.0194650.16740.433738
430.0533770.45920.323732
44-0.034032-0.29280.385264
45-0.072879-0.62690.266317
46-0.040321-0.34690.364844
47-0.017109-0.14720.441695
480.087610.75360.226726

\begin{tabular}{lllllllll}
\hline
Partial Autocorrelation Function \tabularnewline
Time lag k & PACF(k) & T-STAT & P-value \tabularnewline
1 & 0.91157 & 7.8416 & 0 \tabularnewline
2 & -0.014166 & -0.1219 & 0.451671 \tabularnewline
3 & 0.081308 & 0.6994 & 0.243236 \tabularnewline
4 & -0.087586 & -0.7534 & 0.226788 \tabularnewline
5 & -0.033041 & -0.2842 & 0.388514 \tabularnewline
6 & -0.129505 & -1.114 & 0.134433 \tabularnewline
7 & -0.04548 & -0.3912 & 0.348373 \tabularnewline
8 & -0.060033 & -0.5164 & 0.303548 \tabularnewline
9 & 0.014306 & 0.1231 & 0.451194 \tabularnewline
10 & 0.02434 & 0.2094 & 0.417363 \tabularnewline
11 & 0.0028 & 0.0241 & 0.490424 \tabularnewline
12 & 0.084653 & 0.7282 & 0.234391 \tabularnewline
13 & -0.003202 & -0.0275 & 0.489049 \tabularnewline
14 & -0.016222 & -0.1395 & 0.444699 \tabularnewline
15 & -0.025166 & -0.2165 & 0.414602 \tabularnewline
16 & -0.323656 & -2.7842 & 0.003404 \tabularnewline
17 & -0.031722 & -0.2729 & 0.39285 \tabularnewline
18 & -0.015146 & -0.1303 & 0.448344 \tabularnewline
19 & -0.029584 & -0.2545 & 0.399913 \tabularnewline
20 & 0.085228 & 0.7332 & 0.232889 \tabularnewline
21 & 0.022427 & 0.1929 & 0.423773 \tabularnewline
22 & -0.02862 & -0.2462 & 0.403104 \tabularnewline
23 & -0.118419 & -1.0187 & 0.155838 \tabularnewline
24 & 0.014754 & 0.1269 & 0.449674 \tabularnewline
25 & 0.031965 & 0.275 & 0.392051 \tabularnewline
26 & 0.004656 & 0.0401 & 0.484078 \tabularnewline
27 & -0.046623 & -0.4011 & 0.344765 \tabularnewline
28 & -0.064342 & -0.5535 & 0.290799 \tabularnewline
29 & 0.0124 & 0.1067 & 0.457671 \tabularnewline
30 & -0.033421 & -0.2875 & 0.387266 \tabularnewline
31 & -0.114463 & -0.9847 & 0.164002 \tabularnewline
32 & -0.05822 & -0.5008 & 0.30899 \tabularnewline
33 & -0.051356 & -0.4418 & 0.329969 \tabularnewline
34 & 0.038185 & 0.3285 & 0.371738 \tabularnewline
35 & -0.114633 & -0.9861 & 0.163646 \tabularnewline
36 & -0.045102 & -0.388 & 0.349571 \tabularnewline
37 & -0.082998 & -0.714 & 0.238745 \tabularnewline
38 & -0.033882 & -0.2915 & 0.385757 \tabularnewline
39 & 0.064478 & 0.5547 & 0.290401 \tabularnewline
40 & 0.008714 & 0.075 & 0.470224 \tabularnewline
41 & -0.007368 & -0.0634 & 0.474816 \tabularnewline
42 & 0.019465 & 0.1674 & 0.433738 \tabularnewline
43 & 0.053377 & 0.4592 & 0.323732 \tabularnewline
44 & -0.034032 & -0.2928 & 0.385264 \tabularnewline
45 & -0.072879 & -0.6269 & 0.266317 \tabularnewline
46 & -0.040321 & -0.3469 & 0.364844 \tabularnewline
47 & -0.017109 & -0.1472 & 0.441695 \tabularnewline
48 & 0.08761 & 0.7536 & 0.226726 \tabularnewline
\hline
\end{tabular}
%Source: https://freestatistics.org/blog/index.php?pk=120979&T=2

[TABLE]
[ROW][C]Partial Autocorrelation Function[/C][/ROW]
[ROW][C]Time lag k[/C][C]PACF(k)[/C][C]T-STAT[/C][C]P-value[/C][/ROW]
[ROW][C]1[/C][C]0.91157[/C][C]7.8416[/C][C]0[/C][/ROW]
[ROW][C]2[/C][C]-0.014166[/C][C]-0.1219[/C][C]0.451671[/C][/ROW]
[ROW][C]3[/C][C]0.081308[/C][C]0.6994[/C][C]0.243236[/C][/ROW]
[ROW][C]4[/C][C]-0.087586[/C][C]-0.7534[/C][C]0.226788[/C][/ROW]
[ROW][C]5[/C][C]-0.033041[/C][C]-0.2842[/C][C]0.388514[/C][/ROW]
[ROW][C]6[/C][C]-0.129505[/C][C]-1.114[/C][C]0.134433[/C][/ROW]
[ROW][C]7[/C][C]-0.04548[/C][C]-0.3912[/C][C]0.348373[/C][/ROW]
[ROW][C]8[/C][C]-0.060033[/C][C]-0.5164[/C][C]0.303548[/C][/ROW]
[ROW][C]9[/C][C]0.014306[/C][C]0.1231[/C][C]0.451194[/C][/ROW]
[ROW][C]10[/C][C]0.02434[/C][C]0.2094[/C][C]0.417363[/C][/ROW]
[ROW][C]11[/C][C]0.0028[/C][C]0.0241[/C][C]0.490424[/C][/ROW]
[ROW][C]12[/C][C]0.084653[/C][C]0.7282[/C][C]0.234391[/C][/ROW]
[ROW][C]13[/C][C]-0.003202[/C][C]-0.0275[/C][C]0.489049[/C][/ROW]
[ROW][C]14[/C][C]-0.016222[/C][C]-0.1395[/C][C]0.444699[/C][/ROW]
[ROW][C]15[/C][C]-0.025166[/C][C]-0.2165[/C][C]0.414602[/C][/ROW]
[ROW][C]16[/C][C]-0.323656[/C][C]-2.7842[/C][C]0.003404[/C][/ROW]
[ROW][C]17[/C][C]-0.031722[/C][C]-0.2729[/C][C]0.39285[/C][/ROW]
[ROW][C]18[/C][C]-0.015146[/C][C]-0.1303[/C][C]0.448344[/C][/ROW]
[ROW][C]19[/C][C]-0.029584[/C][C]-0.2545[/C][C]0.399913[/C][/ROW]
[ROW][C]20[/C][C]0.085228[/C][C]0.7332[/C][C]0.232889[/C][/ROW]
[ROW][C]21[/C][C]0.022427[/C][C]0.1929[/C][C]0.423773[/C][/ROW]
[ROW][C]22[/C][C]-0.02862[/C][C]-0.2462[/C][C]0.403104[/C][/ROW]
[ROW][C]23[/C][C]-0.118419[/C][C]-1.0187[/C][C]0.155838[/C][/ROW]
[ROW][C]24[/C][C]0.014754[/C][C]0.1269[/C][C]0.449674[/C][/ROW]
[ROW][C]25[/C][C]0.031965[/C][C]0.275[/C][C]0.392051[/C][/ROW]
[ROW][C]26[/C][C]0.004656[/C][C]0.0401[/C][C]0.484078[/C][/ROW]
[ROW][C]27[/C][C]-0.046623[/C][C]-0.4011[/C][C]0.344765[/C][/ROW]
[ROW][C]28[/C][C]-0.064342[/C][C]-0.5535[/C][C]0.290799[/C][/ROW]
[ROW][C]29[/C][C]0.0124[/C][C]0.1067[/C][C]0.457671[/C][/ROW]
[ROW][C]30[/C][C]-0.033421[/C][C]-0.2875[/C][C]0.387266[/C][/ROW]
[ROW][C]31[/C][C]-0.114463[/C][C]-0.9847[/C][C]0.164002[/C][/ROW]
[ROW][C]32[/C][C]-0.05822[/C][C]-0.5008[/C][C]0.30899[/C][/ROW]
[ROW][C]33[/C][C]-0.051356[/C][C]-0.4418[/C][C]0.329969[/C][/ROW]
[ROW][C]34[/C][C]0.038185[/C][C]0.3285[/C][C]0.371738[/C][/ROW]
[ROW][C]35[/C][C]-0.114633[/C][C]-0.9861[/C][C]0.163646[/C][/ROW]
[ROW][C]36[/C][C]-0.045102[/C][C]-0.388[/C][C]0.349571[/C][/ROW]
[ROW][C]37[/C][C]-0.082998[/C][C]-0.714[/C][C]0.238745[/C][/ROW]
[ROW][C]38[/C][C]-0.033882[/C][C]-0.2915[/C][C]0.385757[/C][/ROW]
[ROW][C]39[/C][C]0.064478[/C][C]0.5547[/C][C]0.290401[/C][/ROW]
[ROW][C]40[/C][C]0.008714[/C][C]0.075[/C][C]0.470224[/C][/ROW]
[ROW][C]41[/C][C]-0.007368[/C][C]-0.0634[/C][C]0.474816[/C][/ROW]
[ROW][C]42[/C][C]0.019465[/C][C]0.1674[/C][C]0.433738[/C][/ROW]
[ROW][C]43[/C][C]0.053377[/C][C]0.4592[/C][C]0.323732[/C][/ROW]
[ROW][C]44[/C][C]-0.034032[/C][C]-0.2928[/C][C]0.385264[/C][/ROW]
[ROW][C]45[/C][C]-0.072879[/C][C]-0.6269[/C][C]0.266317[/C][/ROW]
[ROW][C]46[/C][C]-0.040321[/C][C]-0.3469[/C][C]0.364844[/C][/ROW]
[ROW][C]47[/C][C]-0.017109[/C][C]-0.1472[/C][C]0.441695[/C][/ROW]
[ROW][C]48[/C][C]0.08761[/C][C]0.7536[/C][C]0.226726[/C][/ROW]
[/TABLE]
Source: https://freestatistics.org/blog/index.php?pk=120979&T=2

Globally Unique Identifier (entire table): ba.freestatistics.org/blog/index.php?pk=120979&T=2

As an alternative you can also use a QR Code:  

The GUIDs for individual cells are displayed in the table below:

Partial Autocorrelation Function
Time lag kPACF(k)T-STATP-value
10.911577.84160
2-0.014166-0.12190.451671
30.0813080.69940.243236
4-0.087586-0.75340.226788
5-0.033041-0.28420.388514
6-0.129505-1.1140.134433
7-0.04548-0.39120.348373
8-0.060033-0.51640.303548
90.0143060.12310.451194
100.024340.20940.417363
110.00280.02410.490424
120.0846530.72820.234391
13-0.003202-0.02750.489049
14-0.016222-0.13950.444699
15-0.025166-0.21650.414602
16-0.323656-2.78420.003404
17-0.031722-0.27290.39285
18-0.015146-0.13030.448344
19-0.029584-0.25450.399913
200.0852280.73320.232889
210.0224270.19290.423773
22-0.02862-0.24620.403104
23-0.118419-1.01870.155838
240.0147540.12690.449674
250.0319650.2750.392051
260.0046560.04010.484078
27-0.046623-0.40110.344765
28-0.064342-0.55350.290799
290.01240.10670.457671
30-0.033421-0.28750.387266
31-0.114463-0.98470.164002
32-0.05822-0.50080.30899
33-0.051356-0.44180.329969
340.0381850.32850.371738
35-0.114633-0.98610.163646
36-0.045102-0.3880.349571
37-0.082998-0.7140.238745
38-0.033882-0.29150.385757
390.0644780.55470.290401
400.0087140.0750.470224
41-0.007368-0.06340.474816
420.0194650.16740.433738
430.0533770.45920.323732
44-0.034032-0.29280.385264
45-0.072879-0.62690.266317
46-0.040321-0.34690.364844
47-0.017109-0.14720.441695
480.087610.75360.226726


Parameters (Session):
par1 = 48 ; par2 = 1 ; par3 = 0 ; par4 = 0 ; par5 = 12 ; par6 = White Noise ; par7 = 0.95 ;
Parameters (R input):
par1 = 48 ; par2 = 1 ; par3 = 0 ; par4 = 0 ; par5 = 12 ; par6 = White Noise ; par7 = 0.95 ; par8 = ;
R code (references can be found in the software module):
if (par1 == 'Default') {
par1 = 10*log10(length(x))
} else {
par1 <- as.numeric(par1)
}
par2 <- as.numeric(par2)
par3 <- as.numeric(par3)
par4 <- as.numeric(par4)
par5 <- as.numeric(par5)
if (par6 == 'White Noise') par6 <- 'white' else par6 <- 'ma'
par7 <- as.numeric(par7)
if (par8 != '') par8 <- as.numeric(par8)
ox <- x
if (par8 == '') {
if (par2 == 0) {
x <- log(x)
} else {
x <- (x ^ par2 - 1) / par2
}
} else {
x <- log(x,base=par8)
}
if (par3 > 0) x <- diff(x,lag=1,difference=par3)
if (par4 > 0) x <- diff(x,lag=par5,difference=par4)
bitmap(file='picts.png')
op <- par(mfrow=c(2,1))
plot(ox,type='l',main='Original Time Series',xlab='time',ylab='value')
if (par8=='') {
mytitle <- paste('Working Time Series (lambda=',par2,', d=',par3,', D=',par4,')',sep='')
mysub <- paste('(lambda=',par2,', d=',par3,', D=',par4,', CI=', par7, ', CI type=',par6,')',sep='')
} else {
mytitle <- paste('Working Time Series (base=',par8,', d=',par3,', D=',par4,')',sep='')
mysub <- paste('(base=',par8,', d=',par3,', D=',par4,', CI=', par7, ', CI type=',par6,')',sep='')
}
plot(x,type='l', main=mytitle,xlab='time',ylab='value')
par(op)
dev.off()
bitmap(file='pic1.png')
racf <- acf(x, par1, main='Autocorrelation', xlab='time lag', ylab='ACF', ci.type=par6, ci=par7, sub=mysub)
dev.off()
bitmap(file='pic2.png')
rpacf <- pacf(x,par1,main='Partial Autocorrelation',xlab='lags',ylab='PACF',sub=mysub)
dev.off()
(myacf <- c(racf$acf))
(mypacf <- c(rpacf$acf))
lengthx <- length(x)
sqrtn <- sqrt(lengthx)
load(file='createtable')
a<-table.start()
a<-table.row.start(a)
a<-table.element(a,'Autocorrelation Function',4,TRUE)
a<-table.row.end(a)
a<-table.row.start(a)
a<-table.element(a,'Time lag k',header=TRUE)
a<-table.element(a,hyperlink('basics.htm','ACF(k)','click here for more information about the Autocorrelation Function'),header=TRUE)
a<-table.element(a,'T-STAT',header=TRUE)
a<-table.element(a,'P-value',header=TRUE)
a<-table.row.end(a)
for (i in 2:(par1+1)) {
a<-table.row.start(a)
a<-table.element(a,i-1,header=TRUE)
a<-table.element(a,round(myacf[i],6))
mytstat <- myacf[i]*sqrtn
a<-table.element(a,round(mytstat,4))
a<-table.element(a,round(1-pt(abs(mytstat),lengthx),6))
a<-table.row.end(a)
}
a<-table.end(a)
table.save(a,file='mytable.tab')
a<-table.start()
a<-table.row.start(a)
a<-table.element(a,'Partial Autocorrelation Function',4,TRUE)
a<-table.row.end(a)
a<-table.row.start(a)
a<-table.element(a,'Time lag k',header=TRUE)
a<-table.element(a,hyperlink('basics.htm','PACF(k)','click here for more information about the Partial Autocorrelation Function'),header=TRUE)
a<-table.element(a,'T-STAT',header=TRUE)
a<-table.element(a,'P-value',header=TRUE)
a<-table.row.end(a)
for (i in 1:par1) {
a<-table.row.start(a)
a<-table.element(a,i,header=TRUE)
a<-table.element(a,round(mypacf[i],6))
mytstat <- mypacf[i]*sqrtn
a<-table.element(a,round(mytstat,4))
a<-table.element(a,round(1-pt(abs(mytstat),lengthx),6))
a<-table.row.end(a)
}
a<-table.end(a)
table.save(a,file='mytable1.tab')