Free Statistics

of Irreproducible Research!

Author's title

Author*Unverified author*
R Software Modulerwasp_autocorrelation.wasp
Title produced by software(Partial) Autocorrelation Function
Date of computationMon, 02 May 2011 08:50:06 +0000
Cite this page as followsStatistical Computations at FreeStatistics.org, Office for Research Development and Education, URL https://freestatistics.org/blog/index.php?v=date/2011/May/02/t13043260348j1da83ldstxqn2.htm/, Retrieved Sun, 12 May 2024 01:07:08 +0000
Statistical Computations at FreeStatistics.org, Office for Research Development and Education, URL https://freestatistics.org/blog/index.php?pk=120747, Retrieved Sun, 12 May 2024 01:07:08 +0000
QR Codes:

Original text written by user:
IsPrivate?No (this computation is public)
User-defined keywordsKDGP2W12
Estimated Impact144
Family? (F = Feedback message, R = changed R code, M = changed R Module, P = changed Parameters, D = changed Data)
-       [(Partial) Autocorrelation Function] [Autocorrelation n...] [2011-05-02 08:50:06] [91b501704ec53ded4f914c1fb409b978] [Current]
Feedback Forum

Post a new message
Dataseries X:
89507
87562
85209
82360
79054
79069
107551
115759
115585
110260
103444
102303
101397
97994
94044
91159
87239
89235
118647
125620
125154
117529
109459
108483
107137
104699
100804
96066
91971
93228
120144
127233
127166
118194
109940
106683
102834
99882
96666
92540
88744
89321
115870
122401
122030
113802
105791
103076
98658
96945
92497
90687
88796
90015
113228
118711
117460
106556
97347
92657
93118
89037
83570
81693
75956
73993
97088
102394
96549
89727
82336
82653
82303
79596
74472
73562
66618
69029
89899
93774
90305
83799
80320
82497


Summary of computational transaction
Raw Inputview raw input (R code)
Raw Outputview raw output of R engine
Computing time3 seconds
R Server'RServer@AstonUniversity' @ vre.aston.ac.uk

\begin{tabular}{lllllllll}
\hline
Summary of computational transaction \tabularnewline
Raw Input & view raw input (R code)  \tabularnewline
Raw Output & view raw output of R engine  \tabularnewline
Computing time & 3 seconds \tabularnewline
R Server & 'RServer@AstonUniversity' @ vre.aston.ac.uk \tabularnewline
\hline
\end{tabular}
%Source: https://freestatistics.org/blog/index.php?pk=120747&T=0

[TABLE]
[ROW][C]Summary of computational transaction[/C][/ROW]
[ROW][C]Raw Input[/C][C]view raw input (R code) [/C][/ROW]
[ROW][C]Raw Output[/C][C]view raw output of R engine [/C][/ROW]
[ROW][C]Computing time[/C][C]3 seconds[/C][/ROW]
[ROW][C]R Server[/C][C]'RServer@AstonUniversity' @ vre.aston.ac.uk[/C][/ROW]
[/TABLE]
Source: https://freestatistics.org/blog/index.php?pk=120747&T=0

Globally Unique Identifier (entire table): ba.freestatistics.org/blog/index.php?pk=120747&T=0

As an alternative you can also use a QR Code:  

The GUIDs for individual cells are displayed in the table below:

Summary of computational transaction
Raw Inputview raw input (R code)
Raw Outputview raw output of R engine
Computing time3 seconds
R Server'RServer@AstonUniversity' @ vre.aston.ac.uk


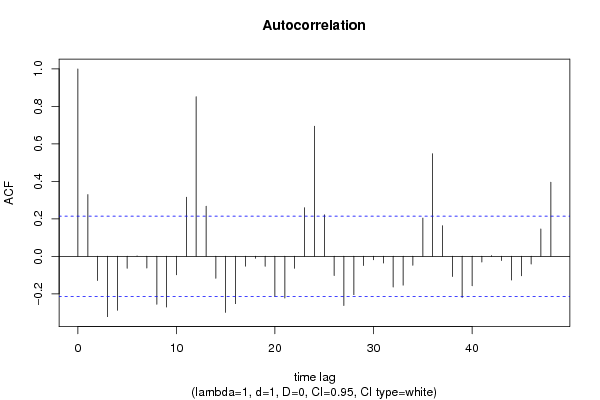
Autocorrelation Function
Time lag kACF(k)T-STATP-value
10.3294293.00120.001775
2-0.129373-1.17860.120954
3-0.322111-2.93460.002159
4-0.288366-2.62710.005127
5-0.063899-0.58210.281024
60.0007690.0070.497215
7-0.062089-0.56570.286577
8-0.256579-2.33750.010909
9-0.270498-2.46440.007895
10-0.098951-0.90150.18497
110.3156152.87540.002563
120.8517587.75990
130.2675362.43740.008465
14-0.116882-1.06480.145016
15-0.299557-2.72910.003876
16-0.252583-2.30110.011946
17-0.052726-0.48040.316118
18-0.010783-0.09820.460989
19-0.053518-0.48760.313568
20-0.215195-1.96050.026645
21-0.222852-2.03030.022765
22-0.063923-0.58240.280948
230.2596282.36530.010173
240.6942486.32490
250.2211582.01480.023579
26-0.102629-0.9350.176251
27-0.26236-2.39020.009551
28-0.204553-1.86360.032959
29-0.048859-0.44510.328695
30-0.018961-0.17270.431638
31-0.036395-0.33160.370522
32-0.164129-1.49530.069316
33-0.154146-1.40430.081975
34-0.048209-0.43920.330828
350.2039121.85770.033377
360.5471994.98522e-06
370.1632341.48710.070384
38-0.107512-0.97950.165094
39-0.219392-1.99880.024454
40-0.157445-1.43440.077609
41-0.030381-0.27680.391317
420.003660.03330.48674
43-0.022088-0.20120.420505
44-0.126565-1.15310.126098
45-0.104298-0.95020.172385
46-0.040778-0.37150.355605
470.1460581.33070.093474
480.3956453.60450.000266

\begin{tabular}{lllllllll}
\hline
Autocorrelation Function \tabularnewline
Time lag k & ACF(k) & T-STAT & P-value \tabularnewline
1 & 0.329429 & 3.0012 & 0.001775 \tabularnewline
2 & -0.129373 & -1.1786 & 0.120954 \tabularnewline
3 & -0.322111 & -2.9346 & 0.002159 \tabularnewline
4 & -0.288366 & -2.6271 & 0.005127 \tabularnewline
5 & -0.063899 & -0.5821 & 0.281024 \tabularnewline
6 & 0.000769 & 0.007 & 0.497215 \tabularnewline
7 & -0.062089 & -0.5657 & 0.286577 \tabularnewline
8 & -0.256579 & -2.3375 & 0.010909 \tabularnewline
9 & -0.270498 & -2.4644 & 0.007895 \tabularnewline
10 & -0.098951 & -0.9015 & 0.18497 \tabularnewline
11 & 0.315615 & 2.8754 & 0.002563 \tabularnewline
12 & 0.851758 & 7.7599 & 0 \tabularnewline
13 & 0.267536 & 2.4374 & 0.008465 \tabularnewline
14 & -0.116882 & -1.0648 & 0.145016 \tabularnewline
15 & -0.299557 & -2.7291 & 0.003876 \tabularnewline
16 & -0.252583 & -2.3011 & 0.011946 \tabularnewline
17 & -0.052726 & -0.4804 & 0.316118 \tabularnewline
18 & -0.010783 & -0.0982 & 0.460989 \tabularnewline
19 & -0.053518 & -0.4876 & 0.313568 \tabularnewline
20 & -0.215195 & -1.9605 & 0.026645 \tabularnewline
21 & -0.222852 & -2.0303 & 0.022765 \tabularnewline
22 & -0.063923 & -0.5824 & 0.280948 \tabularnewline
23 & 0.259628 & 2.3653 & 0.010173 \tabularnewline
24 & 0.694248 & 6.3249 & 0 \tabularnewline
25 & 0.221158 & 2.0148 & 0.023579 \tabularnewline
26 & -0.102629 & -0.935 & 0.176251 \tabularnewline
27 & -0.26236 & -2.3902 & 0.009551 \tabularnewline
28 & -0.204553 & -1.8636 & 0.032959 \tabularnewline
29 & -0.048859 & -0.4451 & 0.328695 \tabularnewline
30 & -0.018961 & -0.1727 & 0.431638 \tabularnewline
31 & -0.036395 & -0.3316 & 0.370522 \tabularnewline
32 & -0.164129 & -1.4953 & 0.069316 \tabularnewline
33 & -0.154146 & -1.4043 & 0.081975 \tabularnewline
34 & -0.048209 & -0.4392 & 0.330828 \tabularnewline
35 & 0.203912 & 1.8577 & 0.033377 \tabularnewline
36 & 0.547199 & 4.9852 & 2e-06 \tabularnewline
37 & 0.163234 & 1.4871 & 0.070384 \tabularnewline
38 & -0.107512 & -0.9795 & 0.165094 \tabularnewline
39 & -0.219392 & -1.9988 & 0.024454 \tabularnewline
40 & -0.157445 & -1.4344 & 0.077609 \tabularnewline
41 & -0.030381 & -0.2768 & 0.391317 \tabularnewline
42 & 0.00366 & 0.0333 & 0.48674 \tabularnewline
43 & -0.022088 & -0.2012 & 0.420505 \tabularnewline
44 & -0.126565 & -1.1531 & 0.126098 \tabularnewline
45 & -0.104298 & -0.9502 & 0.172385 \tabularnewline
46 & -0.040778 & -0.3715 & 0.355605 \tabularnewline
47 & 0.146058 & 1.3307 & 0.093474 \tabularnewline
48 & 0.395645 & 3.6045 & 0.000266 \tabularnewline
\hline
\end{tabular}
%Source: https://freestatistics.org/blog/index.php?pk=120747&T=1

[TABLE]
[ROW][C]Autocorrelation Function[/C][/ROW]
[ROW][C]Time lag k[/C][C]ACF(k)[/C][C]T-STAT[/C][C]P-value[/C][/ROW]
[ROW][C]1[/C][C]0.329429[/C][C]3.0012[/C][C]0.001775[/C][/ROW]
[ROW][C]2[/C][C]-0.129373[/C][C]-1.1786[/C][C]0.120954[/C][/ROW]
[ROW][C]3[/C][C]-0.322111[/C][C]-2.9346[/C][C]0.002159[/C][/ROW]
[ROW][C]4[/C][C]-0.288366[/C][C]-2.6271[/C][C]0.005127[/C][/ROW]
[ROW][C]5[/C][C]-0.063899[/C][C]-0.5821[/C][C]0.281024[/C][/ROW]
[ROW][C]6[/C][C]0.000769[/C][C]0.007[/C][C]0.497215[/C][/ROW]
[ROW][C]7[/C][C]-0.062089[/C][C]-0.5657[/C][C]0.286577[/C][/ROW]
[ROW][C]8[/C][C]-0.256579[/C][C]-2.3375[/C][C]0.010909[/C][/ROW]
[ROW][C]9[/C][C]-0.270498[/C][C]-2.4644[/C][C]0.007895[/C][/ROW]
[ROW][C]10[/C][C]-0.098951[/C][C]-0.9015[/C][C]0.18497[/C][/ROW]
[ROW][C]11[/C][C]0.315615[/C][C]2.8754[/C][C]0.002563[/C][/ROW]
[ROW][C]12[/C][C]0.851758[/C][C]7.7599[/C][C]0[/C][/ROW]
[ROW][C]13[/C][C]0.267536[/C][C]2.4374[/C][C]0.008465[/C][/ROW]
[ROW][C]14[/C][C]-0.116882[/C][C]-1.0648[/C][C]0.145016[/C][/ROW]
[ROW][C]15[/C][C]-0.299557[/C][C]-2.7291[/C][C]0.003876[/C][/ROW]
[ROW][C]16[/C][C]-0.252583[/C][C]-2.3011[/C][C]0.011946[/C][/ROW]
[ROW][C]17[/C][C]-0.052726[/C][C]-0.4804[/C][C]0.316118[/C][/ROW]
[ROW][C]18[/C][C]-0.010783[/C][C]-0.0982[/C][C]0.460989[/C][/ROW]
[ROW][C]19[/C][C]-0.053518[/C][C]-0.4876[/C][C]0.313568[/C][/ROW]
[ROW][C]20[/C][C]-0.215195[/C][C]-1.9605[/C][C]0.026645[/C][/ROW]
[ROW][C]21[/C][C]-0.222852[/C][C]-2.0303[/C][C]0.022765[/C][/ROW]
[ROW][C]22[/C][C]-0.063923[/C][C]-0.5824[/C][C]0.280948[/C][/ROW]
[ROW][C]23[/C][C]0.259628[/C][C]2.3653[/C][C]0.010173[/C][/ROW]
[ROW][C]24[/C][C]0.694248[/C][C]6.3249[/C][C]0[/C][/ROW]
[ROW][C]25[/C][C]0.221158[/C][C]2.0148[/C][C]0.023579[/C][/ROW]
[ROW][C]26[/C][C]-0.102629[/C][C]-0.935[/C][C]0.176251[/C][/ROW]
[ROW][C]27[/C][C]-0.26236[/C][C]-2.3902[/C][C]0.009551[/C][/ROW]
[ROW][C]28[/C][C]-0.204553[/C][C]-1.8636[/C][C]0.032959[/C][/ROW]
[ROW][C]29[/C][C]-0.048859[/C][C]-0.4451[/C][C]0.328695[/C][/ROW]
[ROW][C]30[/C][C]-0.018961[/C][C]-0.1727[/C][C]0.431638[/C][/ROW]
[ROW][C]31[/C][C]-0.036395[/C][C]-0.3316[/C][C]0.370522[/C][/ROW]
[ROW][C]32[/C][C]-0.164129[/C][C]-1.4953[/C][C]0.069316[/C][/ROW]
[ROW][C]33[/C][C]-0.154146[/C][C]-1.4043[/C][C]0.081975[/C][/ROW]
[ROW][C]34[/C][C]-0.048209[/C][C]-0.4392[/C][C]0.330828[/C][/ROW]
[ROW][C]35[/C][C]0.203912[/C][C]1.8577[/C][C]0.033377[/C][/ROW]
[ROW][C]36[/C][C]0.547199[/C][C]4.9852[/C][C]2e-06[/C][/ROW]
[ROW][C]37[/C][C]0.163234[/C][C]1.4871[/C][C]0.070384[/C][/ROW]
[ROW][C]38[/C][C]-0.107512[/C][C]-0.9795[/C][C]0.165094[/C][/ROW]
[ROW][C]39[/C][C]-0.219392[/C][C]-1.9988[/C][C]0.024454[/C][/ROW]
[ROW][C]40[/C][C]-0.157445[/C][C]-1.4344[/C][C]0.077609[/C][/ROW]
[ROW][C]41[/C][C]-0.030381[/C][C]-0.2768[/C][C]0.391317[/C][/ROW]
[ROW][C]42[/C][C]0.00366[/C][C]0.0333[/C][C]0.48674[/C][/ROW]
[ROW][C]43[/C][C]-0.022088[/C][C]-0.2012[/C][C]0.420505[/C][/ROW]
[ROW][C]44[/C][C]-0.126565[/C][C]-1.1531[/C][C]0.126098[/C][/ROW]
[ROW][C]45[/C][C]-0.104298[/C][C]-0.9502[/C][C]0.172385[/C][/ROW]
[ROW][C]46[/C][C]-0.040778[/C][C]-0.3715[/C][C]0.355605[/C][/ROW]
[ROW][C]47[/C][C]0.146058[/C][C]1.3307[/C][C]0.093474[/C][/ROW]
[ROW][C]48[/C][C]0.395645[/C][C]3.6045[/C][C]0.000266[/C][/ROW]
[/TABLE]
Source: https://freestatistics.org/blog/index.php?pk=120747&T=1

Globally Unique Identifier (entire table): ba.freestatistics.org/blog/index.php?pk=120747&T=1

As an alternative you can also use a QR Code:  

The GUIDs for individual cells are displayed in the table below:

Autocorrelation Function
Time lag kACF(k)T-STATP-value
10.3294293.00120.001775
2-0.129373-1.17860.120954
3-0.322111-2.93460.002159
4-0.288366-2.62710.005127
5-0.063899-0.58210.281024
60.0007690.0070.497215
7-0.062089-0.56570.286577
8-0.256579-2.33750.010909
9-0.270498-2.46440.007895
10-0.098951-0.90150.18497
110.3156152.87540.002563
120.8517587.75990
130.2675362.43740.008465
14-0.116882-1.06480.145016
15-0.299557-2.72910.003876
16-0.252583-2.30110.011946
17-0.052726-0.48040.316118
18-0.010783-0.09820.460989
19-0.053518-0.48760.313568
20-0.215195-1.96050.026645
21-0.222852-2.03030.022765
22-0.063923-0.58240.280948
230.2596282.36530.010173
240.6942486.32490
250.2211582.01480.023579
26-0.102629-0.9350.176251
27-0.26236-2.39020.009551
28-0.204553-1.86360.032959
29-0.048859-0.44510.328695
30-0.018961-0.17270.431638
31-0.036395-0.33160.370522
32-0.164129-1.49530.069316
33-0.154146-1.40430.081975
34-0.048209-0.43920.330828
350.2039121.85770.033377
360.5471994.98522e-06
370.1632341.48710.070384
38-0.107512-0.97950.165094
39-0.219392-1.99880.024454
40-0.157445-1.43440.077609
41-0.030381-0.27680.391317
420.003660.03330.48674
43-0.022088-0.20120.420505
44-0.126565-1.15310.126098
45-0.104298-0.95020.172385
46-0.040778-0.37150.355605
470.1460581.33070.093474
480.3956453.60450.000266


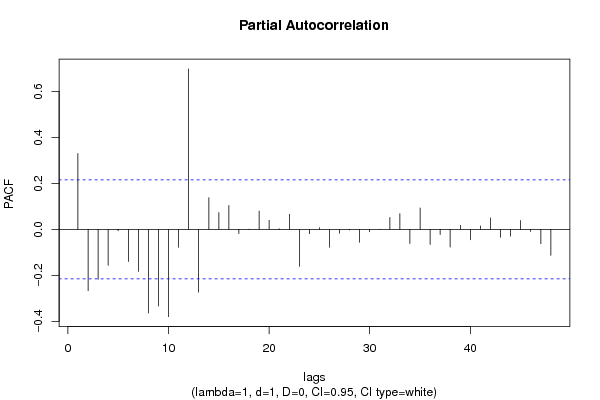
Partial Autocorrelation Function
Time lag kPACF(k)T-STATP-value
10.3294293.00120.001775
2-0.266857-2.43120.008601
3-0.217645-1.98280.025346
4-0.156849-1.4290.078384
5-0.006413-0.05840.476775
6-0.140155-1.27690.102604
7-0.183148-1.66860.049486
8-0.364302-3.31890.000672
9-0.333239-3.0360.001601
10-0.379967-3.46170.000425
11-0.077946-0.71010.239808
120.6978426.35760
13-0.273455-2.49130.00736
140.1374651.25240.106978
150.0728150.66340.254464
160.1034710.94270.174294
17-0.0185-0.16850.433282
180.0006190.00560.497757
190.0792420.72190.236183
200.0390210.35550.361559
210.0025020.02280.490933
220.0660410.60170.274519
23-0.161408-1.47050.072604
24-0.018907-0.17220.43183
250.007220.06580.473856
26-0.078213-0.71260.239059
27-0.017536-0.15980.436728
28-0.002506-0.02280.490919
29-0.056412-0.51390.304332
30-0.010325-0.09410.462641
31-0.000179-0.00160.499351
320.051610.47020.319726
330.0675570.61550.269964
34-0.061762-0.56270.287586
350.0925890.84350.200679
36-0.065525-0.5970.27608
37-0.022413-0.20420.419352
38-0.076615-0.6980.243565
390.0174270.15880.43712
40-0.045397-0.41360.340123
410.0145190.13230.447544
420.0490540.44690.328055
43-0.034325-0.31270.37764
44-0.029601-0.26970.394039
450.0384960.35070.363344
46-0.00926-0.08440.466484
47-0.063263-0.57640.282968
48-0.112859-1.02820.153422

\begin{tabular}{lllllllll}
\hline
Partial Autocorrelation Function \tabularnewline
Time lag k & PACF(k) & T-STAT & P-value \tabularnewline
1 & 0.329429 & 3.0012 & 0.001775 \tabularnewline
2 & -0.266857 & -2.4312 & 0.008601 \tabularnewline
3 & -0.217645 & -1.9828 & 0.025346 \tabularnewline
4 & -0.156849 & -1.429 & 0.078384 \tabularnewline
5 & -0.006413 & -0.0584 & 0.476775 \tabularnewline
6 & -0.140155 & -1.2769 & 0.102604 \tabularnewline
7 & -0.183148 & -1.6686 & 0.049486 \tabularnewline
8 & -0.364302 & -3.3189 & 0.000672 \tabularnewline
9 & -0.333239 & -3.036 & 0.001601 \tabularnewline
10 & -0.379967 & -3.4617 & 0.000425 \tabularnewline
11 & -0.077946 & -0.7101 & 0.239808 \tabularnewline
12 & 0.697842 & 6.3576 & 0 \tabularnewline
13 & -0.273455 & -2.4913 & 0.00736 \tabularnewline
14 & 0.137465 & 1.2524 & 0.106978 \tabularnewline
15 & 0.072815 & 0.6634 & 0.254464 \tabularnewline
16 & 0.103471 & 0.9427 & 0.174294 \tabularnewline
17 & -0.0185 & -0.1685 & 0.433282 \tabularnewline
18 & 0.000619 & 0.0056 & 0.497757 \tabularnewline
19 & 0.079242 & 0.7219 & 0.236183 \tabularnewline
20 & 0.039021 & 0.3555 & 0.361559 \tabularnewline
21 & 0.002502 & 0.0228 & 0.490933 \tabularnewline
22 & 0.066041 & 0.6017 & 0.274519 \tabularnewline
23 & -0.161408 & -1.4705 & 0.072604 \tabularnewline
24 & -0.018907 & -0.1722 & 0.43183 \tabularnewline
25 & 0.00722 & 0.0658 & 0.473856 \tabularnewline
26 & -0.078213 & -0.7126 & 0.239059 \tabularnewline
27 & -0.017536 & -0.1598 & 0.436728 \tabularnewline
28 & -0.002506 & -0.0228 & 0.490919 \tabularnewline
29 & -0.056412 & -0.5139 & 0.304332 \tabularnewline
30 & -0.010325 & -0.0941 & 0.462641 \tabularnewline
31 & -0.000179 & -0.0016 & 0.499351 \tabularnewline
32 & 0.05161 & 0.4702 & 0.319726 \tabularnewline
33 & 0.067557 & 0.6155 & 0.269964 \tabularnewline
34 & -0.061762 & -0.5627 & 0.287586 \tabularnewline
35 & 0.092589 & 0.8435 & 0.200679 \tabularnewline
36 & -0.065525 & -0.597 & 0.27608 \tabularnewline
37 & -0.022413 & -0.2042 & 0.419352 \tabularnewline
38 & -0.076615 & -0.698 & 0.243565 \tabularnewline
39 & 0.017427 & 0.1588 & 0.43712 \tabularnewline
40 & -0.045397 & -0.4136 & 0.340123 \tabularnewline
41 & 0.014519 & 0.1323 & 0.447544 \tabularnewline
42 & 0.049054 & 0.4469 & 0.328055 \tabularnewline
43 & -0.034325 & -0.3127 & 0.37764 \tabularnewline
44 & -0.029601 & -0.2697 & 0.394039 \tabularnewline
45 & 0.038496 & 0.3507 & 0.363344 \tabularnewline
46 & -0.00926 & -0.0844 & 0.466484 \tabularnewline
47 & -0.063263 & -0.5764 & 0.282968 \tabularnewline
48 & -0.112859 & -1.0282 & 0.153422 \tabularnewline
\hline
\end{tabular}
%Source: https://freestatistics.org/blog/index.php?pk=120747&T=2

[TABLE]
[ROW][C]Partial Autocorrelation Function[/C][/ROW]
[ROW][C]Time lag k[/C][C]PACF(k)[/C][C]T-STAT[/C][C]P-value[/C][/ROW]
[ROW][C]1[/C][C]0.329429[/C][C]3.0012[/C][C]0.001775[/C][/ROW]
[ROW][C]2[/C][C]-0.266857[/C][C]-2.4312[/C][C]0.008601[/C][/ROW]
[ROW][C]3[/C][C]-0.217645[/C][C]-1.9828[/C][C]0.025346[/C][/ROW]
[ROW][C]4[/C][C]-0.156849[/C][C]-1.429[/C][C]0.078384[/C][/ROW]
[ROW][C]5[/C][C]-0.006413[/C][C]-0.0584[/C][C]0.476775[/C][/ROW]
[ROW][C]6[/C][C]-0.140155[/C][C]-1.2769[/C][C]0.102604[/C][/ROW]
[ROW][C]7[/C][C]-0.183148[/C][C]-1.6686[/C][C]0.049486[/C][/ROW]
[ROW][C]8[/C][C]-0.364302[/C][C]-3.3189[/C][C]0.000672[/C][/ROW]
[ROW][C]9[/C][C]-0.333239[/C][C]-3.036[/C][C]0.001601[/C][/ROW]
[ROW][C]10[/C][C]-0.379967[/C][C]-3.4617[/C][C]0.000425[/C][/ROW]
[ROW][C]11[/C][C]-0.077946[/C][C]-0.7101[/C][C]0.239808[/C][/ROW]
[ROW][C]12[/C][C]0.697842[/C][C]6.3576[/C][C]0[/C][/ROW]
[ROW][C]13[/C][C]-0.273455[/C][C]-2.4913[/C][C]0.00736[/C][/ROW]
[ROW][C]14[/C][C]0.137465[/C][C]1.2524[/C][C]0.106978[/C][/ROW]
[ROW][C]15[/C][C]0.072815[/C][C]0.6634[/C][C]0.254464[/C][/ROW]
[ROW][C]16[/C][C]0.103471[/C][C]0.9427[/C][C]0.174294[/C][/ROW]
[ROW][C]17[/C][C]-0.0185[/C][C]-0.1685[/C][C]0.433282[/C][/ROW]
[ROW][C]18[/C][C]0.000619[/C][C]0.0056[/C][C]0.497757[/C][/ROW]
[ROW][C]19[/C][C]0.079242[/C][C]0.7219[/C][C]0.236183[/C][/ROW]
[ROW][C]20[/C][C]0.039021[/C][C]0.3555[/C][C]0.361559[/C][/ROW]
[ROW][C]21[/C][C]0.002502[/C][C]0.0228[/C][C]0.490933[/C][/ROW]
[ROW][C]22[/C][C]0.066041[/C][C]0.6017[/C][C]0.274519[/C][/ROW]
[ROW][C]23[/C][C]-0.161408[/C][C]-1.4705[/C][C]0.072604[/C][/ROW]
[ROW][C]24[/C][C]-0.018907[/C][C]-0.1722[/C][C]0.43183[/C][/ROW]
[ROW][C]25[/C][C]0.00722[/C][C]0.0658[/C][C]0.473856[/C][/ROW]
[ROW][C]26[/C][C]-0.078213[/C][C]-0.7126[/C][C]0.239059[/C][/ROW]
[ROW][C]27[/C][C]-0.017536[/C][C]-0.1598[/C][C]0.436728[/C][/ROW]
[ROW][C]28[/C][C]-0.002506[/C][C]-0.0228[/C][C]0.490919[/C][/ROW]
[ROW][C]29[/C][C]-0.056412[/C][C]-0.5139[/C][C]0.304332[/C][/ROW]
[ROW][C]30[/C][C]-0.010325[/C][C]-0.0941[/C][C]0.462641[/C][/ROW]
[ROW][C]31[/C][C]-0.000179[/C][C]-0.0016[/C][C]0.499351[/C][/ROW]
[ROW][C]32[/C][C]0.05161[/C][C]0.4702[/C][C]0.319726[/C][/ROW]
[ROW][C]33[/C][C]0.067557[/C][C]0.6155[/C][C]0.269964[/C][/ROW]
[ROW][C]34[/C][C]-0.061762[/C][C]-0.5627[/C][C]0.287586[/C][/ROW]
[ROW][C]35[/C][C]0.092589[/C][C]0.8435[/C][C]0.200679[/C][/ROW]
[ROW][C]36[/C][C]-0.065525[/C][C]-0.597[/C][C]0.27608[/C][/ROW]
[ROW][C]37[/C][C]-0.022413[/C][C]-0.2042[/C][C]0.419352[/C][/ROW]
[ROW][C]38[/C][C]-0.076615[/C][C]-0.698[/C][C]0.243565[/C][/ROW]
[ROW][C]39[/C][C]0.017427[/C][C]0.1588[/C][C]0.43712[/C][/ROW]
[ROW][C]40[/C][C]-0.045397[/C][C]-0.4136[/C][C]0.340123[/C][/ROW]
[ROW][C]41[/C][C]0.014519[/C][C]0.1323[/C][C]0.447544[/C][/ROW]
[ROW][C]42[/C][C]0.049054[/C][C]0.4469[/C][C]0.328055[/C][/ROW]
[ROW][C]43[/C][C]-0.034325[/C][C]-0.3127[/C][C]0.37764[/C][/ROW]
[ROW][C]44[/C][C]-0.029601[/C][C]-0.2697[/C][C]0.394039[/C][/ROW]
[ROW][C]45[/C][C]0.038496[/C][C]0.3507[/C][C]0.363344[/C][/ROW]
[ROW][C]46[/C][C]-0.00926[/C][C]-0.0844[/C][C]0.466484[/C][/ROW]
[ROW][C]47[/C][C]-0.063263[/C][C]-0.5764[/C][C]0.282968[/C][/ROW]
[ROW][C]48[/C][C]-0.112859[/C][C]-1.0282[/C][C]0.153422[/C][/ROW]
[/TABLE]
Source: https://freestatistics.org/blog/index.php?pk=120747&T=2

Globally Unique Identifier (entire table): ba.freestatistics.org/blog/index.php?pk=120747&T=2

As an alternative you can also use a QR Code:  

The GUIDs for individual cells are displayed in the table below:

Partial Autocorrelation Function
Time lag kPACF(k)T-STATP-value
10.3294293.00120.001775
2-0.266857-2.43120.008601
3-0.217645-1.98280.025346
4-0.156849-1.4290.078384
5-0.006413-0.05840.476775
6-0.140155-1.27690.102604
7-0.183148-1.66860.049486
8-0.364302-3.31890.000672
9-0.333239-3.0360.001601
10-0.379967-3.46170.000425
11-0.077946-0.71010.239808
120.6978426.35760
13-0.273455-2.49130.00736
140.1374651.25240.106978
150.0728150.66340.254464
160.1034710.94270.174294
17-0.0185-0.16850.433282
180.0006190.00560.497757
190.0792420.72190.236183
200.0390210.35550.361559
210.0025020.02280.490933
220.0660410.60170.274519
23-0.161408-1.47050.072604
24-0.018907-0.17220.43183
250.007220.06580.473856
26-0.078213-0.71260.239059
27-0.017536-0.15980.436728
28-0.002506-0.02280.490919
29-0.056412-0.51390.304332
30-0.010325-0.09410.462641
31-0.000179-0.00160.499351
320.051610.47020.319726
330.0675570.61550.269964
34-0.061762-0.56270.287586
350.0925890.84350.200679
36-0.065525-0.5970.27608
37-0.022413-0.20420.419352
38-0.076615-0.6980.243565
390.0174270.15880.43712
40-0.045397-0.41360.340123
410.0145190.13230.447544
420.0490540.44690.328055
43-0.034325-0.31270.37764
44-0.029601-0.26970.394039
450.0384960.35070.363344
46-0.00926-0.08440.466484
47-0.063263-0.57640.282968
48-0.112859-1.02820.153422


Parameters (Session):
par1 = 48 ; par2 = 1 ; par3 = 1 ; par4 = 0 ; par5 = 12 ; par6 = White Noise ; par7 = 0.95 ;
Parameters (R input):
par1 = 48 ; par2 = 1 ; par3 = 1 ; par4 = 0 ; par5 = 12 ; par6 = White Noise ; par7 = 0.95 ; par8 = ;
R code (references can be found in the software module):
if (par1 == 'Default') {
par1 = 10*log10(length(x))
} else {
par1 <- as.numeric(par1)
}
par2 <- as.numeric(par2)
par3 <- as.numeric(par3)
par4 <- as.numeric(par4)
par5 <- as.numeric(par5)
if (par6 == 'White Noise') par6 <- 'white' else par6 <- 'ma'
par7 <- as.numeric(par7)
if (par8 != '') par8 <- as.numeric(par8)
ox <- x
if (par8 == '') {
if (par2 == 0) {
x <- log(x)
} else {
x <- (x ^ par2 - 1) / par2
}
} else {
x <- log(x,base=par8)
}
if (par3 > 0) x <- diff(x,lag=1,difference=par3)
if (par4 > 0) x <- diff(x,lag=par5,difference=par4)
bitmap(file='picts.png')
op <- par(mfrow=c(2,1))
plot(ox,type='l',main='Original Time Series',xlab='time',ylab='value')
if (par8=='') {
mytitle <- paste('Working Time Series (lambda=',par2,', d=',par3,', D=',par4,')',sep='')
mysub <- paste('(lambda=',par2,', d=',par3,', D=',par4,', CI=', par7, ', CI type=',par6,')',sep='')
} else {
mytitle <- paste('Working Time Series (base=',par8,', d=',par3,', D=',par4,')',sep='')
mysub <- paste('(base=',par8,', d=',par3,', D=',par4,', CI=', par7, ', CI type=',par6,')',sep='')
}
plot(x,type='l', main=mytitle,xlab='time',ylab='value')
par(op)
dev.off()
bitmap(file='pic1.png')
racf <- acf(x, par1, main='Autocorrelation', xlab='time lag', ylab='ACF', ci.type=par6, ci=par7, sub=mysub)
dev.off()
bitmap(file='pic2.png')
rpacf <- pacf(x,par1,main='Partial Autocorrelation',xlab='lags',ylab='PACF',sub=mysub)
dev.off()
(myacf <- c(racf$acf))
(mypacf <- c(rpacf$acf))
lengthx <- length(x)
sqrtn <- sqrt(lengthx)
load(file='createtable')
a<-table.start()
a<-table.row.start(a)
a<-table.element(a,'Autocorrelation Function',4,TRUE)
a<-table.row.end(a)
a<-table.row.start(a)
a<-table.element(a,'Time lag k',header=TRUE)
a<-table.element(a,hyperlink('basics.htm','ACF(k)','click here for more information about the Autocorrelation Function'),header=TRUE)
a<-table.element(a,'T-STAT',header=TRUE)
a<-table.element(a,'P-value',header=TRUE)
a<-table.row.end(a)
for (i in 2:(par1+1)) {
a<-table.row.start(a)
a<-table.element(a,i-1,header=TRUE)
a<-table.element(a,round(myacf[i],6))
mytstat <- myacf[i]*sqrtn
a<-table.element(a,round(mytstat,4))
a<-table.element(a,round(1-pt(abs(mytstat),lengthx),6))
a<-table.row.end(a)
}
a<-table.end(a)
table.save(a,file='mytable.tab')
a<-table.start()
a<-table.row.start(a)
a<-table.element(a,'Partial Autocorrelation Function',4,TRUE)
a<-table.row.end(a)
a<-table.row.start(a)
a<-table.element(a,'Time lag k',header=TRUE)
a<-table.element(a,hyperlink('basics.htm','PACF(k)','click here for more information about the Partial Autocorrelation Function'),header=TRUE)
a<-table.element(a,'T-STAT',header=TRUE)
a<-table.element(a,'P-value',header=TRUE)
a<-table.row.end(a)
for (i in 1:par1) {
a<-table.row.start(a)
a<-table.element(a,i,header=TRUE)
a<-table.element(a,round(mypacf[i],6))
mytstat <- mypacf[i]*sqrtn
a<-table.element(a,round(mytstat,4))
a<-table.element(a,round(1-pt(abs(mytstat),lengthx),6))
a<-table.row.end(a)
}
a<-table.end(a)
table.save(a,file='mytable1.tab')