Free Statistics

of Irreproducible Research!

Author's title

Author*Unverified author*
R Software Modulerwasp_arimaforecasting.wasp
Title produced by softwareARIMA Forecasting
Date of computationThu, 31 Mar 2011 11:03:45 +0000
Cite this page as followsStatistical Computations at FreeStatistics.org, Office for Research Development and Education, URL https://freestatistics.org/blog/index.php?v=date/2011/Mar/31/t1301569295fmff9q481xiof3q.htm/, Retrieved Tue, 14 May 2024 23:43:53 +0000
Statistical Computations at FreeStatistics.org, Office for Research Development and Education, URL https://freestatistics.org/blog/index.php?pk=119852, Retrieved Tue, 14 May 2024 23:43:53 +0000
QR Codes:

Original text written by user:
IsPrivate?No (this computation is public)
User-defined keywords
Estimated Impact166
Family? (F = Feedback message, R = changed R code, M = changed R Module, P = changed Parameters, D = changed Data)
-     [ARIMA Backward Selection] [badge4u] [2011-03-30 14:07:22] [74be16979710d4c4e7c6647856088456]
- RMPD    [ARIMA Forecasting] [Badge4u] [2011-03-31 11:03:45] [d41d8cd98f00b204e9800998ecf8427e] [Current]
Feedback Forum

Post a new message
Dataseries X:
25525
26197
26555
57364
62022
34392
37258
76262
50423
32959
38601
31705
40754
41827
43983
91590
99026
54911
59487
121762
80508
52623
61632
50621
70206
68382
73039
157780
170589
94594
102477
209757
138689
90652
106172
87204
110160
112200
113832
245616
265608
147288
159528
326400
215832
141168
165240
135864


Summary of computational transaction
Raw Inputview raw input (R code)
Raw Outputview raw output of R engine
Computing time2 seconds
R Server'RServer@AstonUniversity' @ vre.aston.ac.uk

\begin{tabular}{lllllllll}
\hline
Summary of computational transaction \tabularnewline
Raw Input & view raw input (R code)  \tabularnewline
Raw Output & view raw output of R engine  \tabularnewline
Computing time & 2 seconds \tabularnewline
R Server & 'RServer@AstonUniversity' @ vre.aston.ac.uk \tabularnewline
\hline
\end{tabular}
%Source: https://freestatistics.org/blog/index.php?pk=119852&T=0

[TABLE]
[ROW][C]Summary of computational transaction[/C][/ROW]
[ROW][C]Raw Input[/C][C]view raw input (R code) [/C][/ROW]
[ROW][C]Raw Output[/C][C]view raw output of R engine [/C][/ROW]
[ROW][C]Computing time[/C][C]2 seconds[/C][/ROW]
[ROW][C]R Server[/C][C]'RServer@AstonUniversity' @ vre.aston.ac.uk[/C][/ROW]
[/TABLE]
Source: https://freestatistics.org/blog/index.php?pk=119852&T=0

Globally Unique Identifier (entire table): ba.freestatistics.org/blog/index.php?pk=119852&T=0

As an alternative you can also use a QR Code:  

The GUIDs for individual cells are displayed in the table below:

Summary of computational transaction
Raw Inputview raw input (R code)
Raw Outputview raw output of R engine
Computing time2 seconds
R Server'RServer@AstonUniversity' @ vre.aston.ac.uk


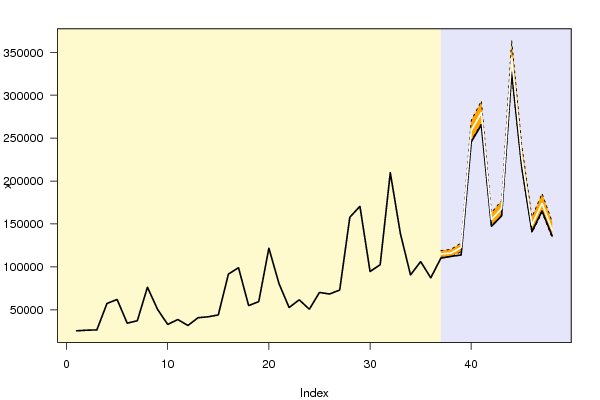
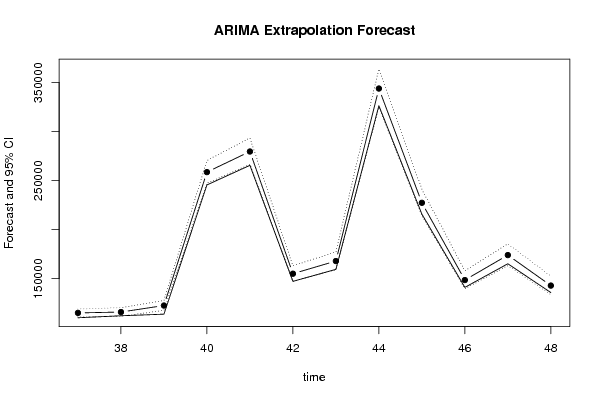
Univariate ARIMA Extrapolation Forecast
timeY[t]F[t]95% LB95% UBp-value(H0: Y[t] = F[t])P(F[t]>Y[t-1])P(F[t]>Y[t-s])P(F[t]>Y[36])
2450621-------
2570206-------
2668382-------
2773039-------
28157780-------
29170589-------
3094594-------
31102477-------
32209757-------
33138689-------
3490652-------
35106172-------
3687204-------
37110160115108.9326111305.1315119042.72680.0068111
38112200116003.5478111709.3412120462.82770.04730.994911
39113832122640.3615117663.157127828.10414e-04111
40245616258694.266247352.0954270556.52450.0154111
41265608279696.6446266589.0696293448.6890.0223111
42147288155095.1547147388.8735163204.36170.0296011
43159528168019.9991159224.4791177301.38130.0365111
44326400343914.752325044.238363880.79780.0428111
45215832227393.1926214370.076241207.47180.0505011
46141168148632.4466139778.7336158046.9620.0601011
47165240174078.4265163325.3834185539.43010.0653111
48135864142978.2907133843.1859152736.88740.0765011

\begin{tabular}{lllllllll}
\hline
Univariate ARIMA Extrapolation Forecast \tabularnewline
time & Y[t] & F[t] & 95% LB & 95% UB & p-value(H0: Y[t] = F[t]) & P(F[t]>Y[t-1]) & P(F[t]>Y[t-s]) & P(F[t]>Y[36]) \tabularnewline
24 & 50621 & - & - & - & - & - & - & - \tabularnewline
25 & 70206 & - & - & - & - & - & - & - \tabularnewline
26 & 68382 & - & - & - & - & - & - & - \tabularnewline
27 & 73039 & - & - & - & - & - & - & - \tabularnewline
28 & 157780 & - & - & - & - & - & - & - \tabularnewline
29 & 170589 & - & - & - & - & - & - & - \tabularnewline
30 & 94594 & - & - & - & - & - & - & - \tabularnewline
31 & 102477 & - & - & - & - & - & - & - \tabularnewline
32 & 209757 & - & - & - & - & - & - & - \tabularnewline
33 & 138689 & - & - & - & - & - & - & - \tabularnewline
34 & 90652 & - & - & - & - & - & - & - \tabularnewline
35 & 106172 & - & - & - & - & - & - & - \tabularnewline
36 & 87204 & - & - & - & - & - & - & - \tabularnewline
37 & 110160 & 115108.9326 & 111305.1315 & 119042.7268 & 0.0068 & 1 & 1 & 1 \tabularnewline
38 & 112200 & 116003.5478 & 111709.3412 & 120462.8277 & 0.0473 & 0.9949 & 1 & 1 \tabularnewline
39 & 113832 & 122640.3615 & 117663.157 & 127828.1041 & 4e-04 & 1 & 1 & 1 \tabularnewline
40 & 245616 & 258694.266 & 247352.0954 & 270556.5245 & 0.0154 & 1 & 1 & 1 \tabularnewline
41 & 265608 & 279696.6446 & 266589.0696 & 293448.689 & 0.0223 & 1 & 1 & 1 \tabularnewline
42 & 147288 & 155095.1547 & 147388.8735 & 163204.3617 & 0.0296 & 0 & 1 & 1 \tabularnewline
43 & 159528 & 168019.9991 & 159224.4791 & 177301.3813 & 0.0365 & 1 & 1 & 1 \tabularnewline
44 & 326400 & 343914.752 & 325044.238 & 363880.7978 & 0.0428 & 1 & 1 & 1 \tabularnewline
45 & 215832 & 227393.1926 & 214370.076 & 241207.4718 & 0.0505 & 0 & 1 & 1 \tabularnewline
46 & 141168 & 148632.4466 & 139778.7336 & 158046.962 & 0.0601 & 0 & 1 & 1 \tabularnewline
47 & 165240 & 174078.4265 & 163325.3834 & 185539.4301 & 0.0653 & 1 & 1 & 1 \tabularnewline
48 & 135864 & 142978.2907 & 133843.1859 & 152736.8874 & 0.0765 & 0 & 1 & 1 \tabularnewline
\hline
\end{tabular}
%Source: https://freestatistics.org/blog/index.php?pk=119852&T=1

[TABLE]
[ROW][C]Univariate ARIMA Extrapolation Forecast[/C][/ROW]
[ROW][C]time[/C][C]Y[t][/C][C]F[t][/C][C]95% LB[/C][C]95% UB[/C][C]p-value(H0: Y[t] = F[t])[/C][C]P(F[t]>Y[t-1])[/C][C]P(F[t]>Y[t-s])[/C][C]P(F[t]>Y[36])[/C][/ROW]
[ROW][C]24[/C][C]50621[/C][C]-[/C][C]-[/C][C]-[/C][C]-[/C][C]-[/C][C]-[/C][C]-[/C][/ROW]
[ROW][C]25[/C][C]70206[/C][C]-[/C][C]-[/C][C]-[/C][C]-[/C][C]-[/C][C]-[/C][C]-[/C][/ROW]
[ROW][C]26[/C][C]68382[/C][C]-[/C][C]-[/C][C]-[/C][C]-[/C][C]-[/C][C]-[/C][C]-[/C][/ROW]
[ROW][C]27[/C][C]73039[/C][C]-[/C][C]-[/C][C]-[/C][C]-[/C][C]-[/C][C]-[/C][C]-[/C][/ROW]
[ROW][C]28[/C][C]157780[/C][C]-[/C][C]-[/C][C]-[/C][C]-[/C][C]-[/C][C]-[/C][C]-[/C][/ROW]
[ROW][C]29[/C][C]170589[/C][C]-[/C][C]-[/C][C]-[/C][C]-[/C][C]-[/C][C]-[/C][C]-[/C][/ROW]
[ROW][C]30[/C][C]94594[/C][C]-[/C][C]-[/C][C]-[/C][C]-[/C][C]-[/C][C]-[/C][C]-[/C][/ROW]
[ROW][C]31[/C][C]102477[/C][C]-[/C][C]-[/C][C]-[/C][C]-[/C][C]-[/C][C]-[/C][C]-[/C][/ROW]
[ROW][C]32[/C][C]209757[/C][C]-[/C][C]-[/C][C]-[/C][C]-[/C][C]-[/C][C]-[/C][C]-[/C][/ROW]
[ROW][C]33[/C][C]138689[/C][C]-[/C][C]-[/C][C]-[/C][C]-[/C][C]-[/C][C]-[/C][C]-[/C][/ROW]
[ROW][C]34[/C][C]90652[/C][C]-[/C][C]-[/C][C]-[/C][C]-[/C][C]-[/C][C]-[/C][C]-[/C][/ROW]
[ROW][C]35[/C][C]106172[/C][C]-[/C][C]-[/C][C]-[/C][C]-[/C][C]-[/C][C]-[/C][C]-[/C][/ROW]
[ROW][C]36[/C][C]87204[/C][C]-[/C][C]-[/C][C]-[/C][C]-[/C][C]-[/C][C]-[/C][C]-[/C][/ROW]
[ROW][C]37[/C][C]110160[/C][C]115108.9326[/C][C]111305.1315[/C][C]119042.7268[/C][C]0.0068[/C][C]1[/C][C]1[/C][C]1[/C][/ROW]
[ROW][C]38[/C][C]112200[/C][C]116003.5478[/C][C]111709.3412[/C][C]120462.8277[/C][C]0.0473[/C][C]0.9949[/C][C]1[/C][C]1[/C][/ROW]
[ROW][C]39[/C][C]113832[/C][C]122640.3615[/C][C]117663.157[/C][C]127828.1041[/C][C]4e-04[/C][C]1[/C][C]1[/C][C]1[/C][/ROW]
[ROW][C]40[/C][C]245616[/C][C]258694.266[/C][C]247352.0954[/C][C]270556.5245[/C][C]0.0154[/C][C]1[/C][C]1[/C][C]1[/C][/ROW]
[ROW][C]41[/C][C]265608[/C][C]279696.6446[/C][C]266589.0696[/C][C]293448.689[/C][C]0.0223[/C][C]1[/C][C]1[/C][C]1[/C][/ROW]
[ROW][C]42[/C][C]147288[/C][C]155095.1547[/C][C]147388.8735[/C][C]163204.3617[/C][C]0.0296[/C][C]0[/C][C]1[/C][C]1[/C][/ROW]
[ROW][C]43[/C][C]159528[/C][C]168019.9991[/C][C]159224.4791[/C][C]177301.3813[/C][C]0.0365[/C][C]1[/C][C]1[/C][C]1[/C][/ROW]
[ROW][C]44[/C][C]326400[/C][C]343914.752[/C][C]325044.238[/C][C]363880.7978[/C][C]0.0428[/C][C]1[/C][C]1[/C][C]1[/C][/ROW]
[ROW][C]45[/C][C]215832[/C][C]227393.1926[/C][C]214370.076[/C][C]241207.4718[/C][C]0.0505[/C][C]0[/C][C]1[/C][C]1[/C][/ROW]
[ROW][C]46[/C][C]141168[/C][C]148632.4466[/C][C]139778.7336[/C][C]158046.962[/C][C]0.0601[/C][C]0[/C][C]1[/C][C]1[/C][/ROW]
[ROW][C]47[/C][C]165240[/C][C]174078.4265[/C][C]163325.3834[/C][C]185539.4301[/C][C]0.0653[/C][C]1[/C][C]1[/C][C]1[/C][/ROW]
[ROW][C]48[/C][C]135864[/C][C]142978.2907[/C][C]133843.1859[/C][C]152736.8874[/C][C]0.0765[/C][C]0[/C][C]1[/C][C]1[/C][/ROW]
[/TABLE]
Source: https://freestatistics.org/blog/index.php?pk=119852&T=1

Globally Unique Identifier (entire table): ba.freestatistics.org/blog/index.php?pk=119852&T=1

As an alternative you can also use a QR Code:  

The GUIDs for individual cells are displayed in the table below:

Univariate ARIMA Extrapolation Forecast
timeY[t]F[t]95% LB95% UBp-value(H0: Y[t] = F[t])P(F[t]>Y[t-1])P(F[t]>Y[t-s])P(F[t]>Y[36])
2450621-------
2570206-------
2668382-------
2773039-------
28157780-------
29170589-------
3094594-------
31102477-------
32209757-------
33138689-------
3490652-------
35106172-------
3687204-------
37110160115108.9326111305.1315119042.72680.0068111
38112200116003.5478111709.3412120462.82770.04730.994911
39113832122640.3615117663.157127828.10414e-04111
40245616258694.266247352.0954270556.52450.0154111
41265608279696.6446266589.0696293448.6890.0223111
42147288155095.1547147388.8735163204.36170.0296011
43159528168019.9991159224.4791177301.38130.0365111
44326400343914.752325044.238363880.79780.0428111
45215832227393.1926214370.076241207.47180.0505011
46141168148632.4466139778.7336158046.9620.0601011
47165240174078.4265163325.3834185539.43010.0653111
48135864142978.2907133843.1859152736.88740.0765011


Univariate ARIMA Extrapolation Forecast Performance
time% S.E.PEMAPESq.EMSERMSE
370.0174-0.043024491933.543100
380.0196-0.03280.037914466976.213419479454.87834413.5535
390.0216-0.07180.049277587232.580138848714.11226232.8737
400.0234-0.05060.0495171041041.523771896795.96518479.1978
410.0251-0.05040.0497198489905.364397215417.84499859.7879
420.0267-0.05030.049860951665.144291171459.06159548.3747
430.0282-0.05050.049972114048.348588448971.81689404.7314
440.0296-0.05090.05306766536.9797115738667.462110758.1907
450.031-0.05080.0501133661174.7447117730057.160210850.3483
460.0323-0.05020.050155717963.5166111528847.795810560.7219
470.0336-0.05080.050278117782.6367108491478.235910415.9243
480.0348-0.04980.050250613132.6718103668282.772210181.7623

\begin{tabular}{lllllllll}
\hline
Univariate ARIMA Extrapolation Forecast Performance \tabularnewline
time & % S.E. & PE & MAPE & Sq.E & MSE & RMSE \tabularnewline
37 & 0.0174 & -0.043 & 0 & 24491933.5431 & 0 & 0 \tabularnewline
38 & 0.0196 & -0.0328 & 0.0379 & 14466976.2134 & 19479454.8783 & 4413.5535 \tabularnewline
39 & 0.0216 & -0.0718 & 0.0492 & 77587232.5801 & 38848714.1122 & 6232.8737 \tabularnewline
40 & 0.0234 & -0.0506 & 0.0495 & 171041041.5237 & 71896795.9651 & 8479.1978 \tabularnewline
41 & 0.0251 & -0.0504 & 0.0497 & 198489905.3643 & 97215417.8449 & 9859.7879 \tabularnewline
42 & 0.0267 & -0.0503 & 0.0498 & 60951665.1442 & 91171459.0615 & 9548.3747 \tabularnewline
43 & 0.0282 & -0.0505 & 0.0499 & 72114048.3485 & 88448971.8168 & 9404.7314 \tabularnewline
44 & 0.0296 & -0.0509 & 0.05 & 306766536.9797 & 115738667.4621 & 10758.1907 \tabularnewline
45 & 0.031 & -0.0508 & 0.0501 & 133661174.7447 & 117730057.1602 & 10850.3483 \tabularnewline
46 & 0.0323 & -0.0502 & 0.0501 & 55717963.5166 & 111528847.7958 & 10560.7219 \tabularnewline
47 & 0.0336 & -0.0508 & 0.0502 & 78117782.6367 & 108491478.2359 & 10415.9243 \tabularnewline
48 & 0.0348 & -0.0498 & 0.0502 & 50613132.6718 & 103668282.7722 & 10181.7623 \tabularnewline
\hline
\end{tabular}
%Source: https://freestatistics.org/blog/index.php?pk=119852&T=2

[TABLE]
[ROW][C]Univariate ARIMA Extrapolation Forecast Performance[/C][/ROW]
[ROW][C]time[/C][C]% S.E.[/C][C]PE[/C][C]MAPE[/C][C]Sq.E[/C][C]MSE[/C][C]RMSE[/C][/ROW]
[ROW][C]37[/C][C]0.0174[/C][C]-0.043[/C][C]0[/C][C]24491933.5431[/C][C]0[/C][C]0[/C][/ROW]
[ROW][C]38[/C][C]0.0196[/C][C]-0.0328[/C][C]0.0379[/C][C]14466976.2134[/C][C]19479454.8783[/C][C]4413.5535[/C][/ROW]
[ROW][C]39[/C][C]0.0216[/C][C]-0.0718[/C][C]0.0492[/C][C]77587232.5801[/C][C]38848714.1122[/C][C]6232.8737[/C][/ROW]
[ROW][C]40[/C][C]0.0234[/C][C]-0.0506[/C][C]0.0495[/C][C]171041041.5237[/C][C]71896795.9651[/C][C]8479.1978[/C][/ROW]
[ROW][C]41[/C][C]0.0251[/C][C]-0.0504[/C][C]0.0497[/C][C]198489905.3643[/C][C]97215417.8449[/C][C]9859.7879[/C][/ROW]
[ROW][C]42[/C][C]0.0267[/C][C]-0.0503[/C][C]0.0498[/C][C]60951665.1442[/C][C]91171459.0615[/C][C]9548.3747[/C][/ROW]
[ROW][C]43[/C][C]0.0282[/C][C]-0.0505[/C][C]0.0499[/C][C]72114048.3485[/C][C]88448971.8168[/C][C]9404.7314[/C][/ROW]
[ROW][C]44[/C][C]0.0296[/C][C]-0.0509[/C][C]0.05[/C][C]306766536.9797[/C][C]115738667.4621[/C][C]10758.1907[/C][/ROW]
[ROW][C]45[/C][C]0.031[/C][C]-0.0508[/C][C]0.0501[/C][C]133661174.7447[/C][C]117730057.1602[/C][C]10850.3483[/C][/ROW]
[ROW][C]46[/C][C]0.0323[/C][C]-0.0502[/C][C]0.0501[/C][C]55717963.5166[/C][C]111528847.7958[/C][C]10560.7219[/C][/ROW]
[ROW][C]47[/C][C]0.0336[/C][C]-0.0508[/C][C]0.0502[/C][C]78117782.6367[/C][C]108491478.2359[/C][C]10415.9243[/C][/ROW]
[ROW][C]48[/C][C]0.0348[/C][C]-0.0498[/C][C]0.0502[/C][C]50613132.6718[/C][C]103668282.7722[/C][C]10181.7623[/C][/ROW]
[/TABLE]
Source: https://freestatistics.org/blog/index.php?pk=119852&T=2

Globally Unique Identifier (entire table): ba.freestatistics.org/blog/index.php?pk=119852&T=2

As an alternative you can also use a QR Code:  

The GUIDs for individual cells are displayed in the table below:

Univariate ARIMA Extrapolation Forecast Performance
time% S.E.PEMAPESq.EMSERMSE
370.0174-0.043024491933.543100
380.0196-0.03280.037914466976.213419479454.87834413.5535
390.0216-0.07180.049277587232.580138848714.11226232.8737
400.0234-0.05060.0495171041041.523771896795.96518479.1978
410.0251-0.05040.0497198489905.364397215417.84499859.7879
420.0267-0.05030.049860951665.144291171459.06159548.3747
430.0282-0.05050.049972114048.348588448971.81689404.7314
440.0296-0.05090.05306766536.9797115738667.462110758.1907
450.031-0.05080.0501133661174.7447117730057.160210850.3483
460.0323-0.05020.050155717963.5166111528847.795810560.7219
470.0336-0.05080.050278117782.6367108491478.235910415.9243
480.0348-0.04980.050250613132.6718103668282.772210181.7623


Parameters (Session):
par1 = 12 ; par2 = 0.0 ; par3 = 1 ; par4 = 1 ; par5 = 12 ; par6 = 0 ; par7 = 1 ; par8 = 1 ; par9 = 0 ; par10 = FALSE ;
Parameters (R input):
par1 = 12 ; par2 = 0.0 ; par3 = 1 ; par4 = 1 ; par5 = 12 ; par6 = 0 ; par7 = 1 ; par8 = 2 ; par9 = 0 ; par10 = FALSE ;
R code (references can be found in the software module):
par1 <- as.numeric(par1) #cut off periods
par2 <- as.numeric(par2) #lambda
par3 <- as.numeric(par3) #degree of non-seasonal differencing
par4 <- as.numeric(par4) #degree of seasonal differencing
par5 <- as.numeric(par5) #seasonal period
par6 <- as.numeric(par6) #p
par7 <- as.numeric(par7) #q
par8 <- as.numeric(par8) #P
par9 <- as.numeric(par9) #Q
if (par10 == 'TRUE') par10 <- TRUE
if (par10 == 'FALSE') par10 <- FALSE
if (par2 == 0) x <- log(x)
if (par2 != 0) x <- x^par2
lx <- length(x)
first <- lx - 2*par1
nx <- lx - par1
nx1 <- nx + 1
fx <- lx - nx
if (fx < 1) {
fx <- par5
nx1 <- lx + fx - 1
first <- lx - 2*fx
}
first <- 1
if (fx < 3) fx <- round(lx/10,0)
(arima.out <- arima(x[1:nx], order=c(par6,par3,par7), seasonal=list(order=c(par8,par4,par9), period=par5), include.mean=par10, method='ML'))
(forecast <- predict(arima.out,par1))
(lb <- forecast$pred - 1.96 * forecast$se)
(ub <- forecast$pred + 1.96 * forecast$se)
if (par2 == 0) {
x <- exp(x)
forecast$pred <- exp(forecast$pred)
lb <- exp(lb)
ub <- exp(ub)
}
if (par2 != 0) {
x <- x^(1/par2)
forecast$pred <- forecast$pred^(1/par2)
lb <- lb^(1/par2)
ub <- ub^(1/par2)
}
if (par2 < 0) {
olb <- lb
lb <- ub
ub <- olb
}
(actandfor <- c(x[1:nx], forecast$pred))
(perc.se <- (ub-forecast$pred)/1.96/forecast$pred)
bitmap(file='test1.png')
opar <- par(mar=c(4,4,2,2),las=1)
ylim <- c( min(x[first:nx],lb), max(x[first:nx],ub))
plot(x,ylim=ylim,type='n',xlim=c(first,lx))
usr <- par('usr')
rect(usr[1],usr[3],nx+1,usr[4],border=NA,col='lemonchiffon')
rect(nx1,usr[3],usr[2],usr[4],border=NA,col='lavender')
abline(h= (-3:3)*2 , col ='gray', lty =3)
polygon( c(nx1:lx,lx:nx1), c(lb,rev(ub)), col = 'orange', lty=2,border=NA)
lines(nx1:lx, lb , lty=2)
lines(nx1:lx, ub , lty=2)
lines(x, lwd=2)
lines(nx1:lx, forecast$pred , lwd=2 , col ='white')
box()
par(opar)
dev.off()
prob.dec <- array(NA, dim=fx)
prob.sdec <- array(NA, dim=fx)
prob.ldec <- array(NA, dim=fx)
prob.pval <- array(NA, dim=fx)
perf.pe <- array(0, dim=fx)
perf.mape <- array(0, dim=fx)
perf.mape1 <- array(0, dim=fx)
perf.se <- array(0, dim=fx)
perf.mse <- array(0, dim=fx)
perf.mse1 <- array(0, dim=fx)
perf.rmse <- array(0, dim=fx)
for (i in 1:fx) {
locSD <- (ub[i] - forecast$pred[i]) / 1.96
perf.pe[i] = (x[nx+i] - forecast$pred[i]) / forecast$pred[i]
perf.se[i] = (x[nx+i] - forecast$pred[i])^2
prob.dec[i] = pnorm((x[nx+i-1] - forecast$pred[i]) / locSD)
prob.sdec[i] = pnorm((x[nx+i-par5] - forecast$pred[i]) / locSD)
prob.ldec[i] = pnorm((x[nx] - forecast$pred[i]) / locSD)
prob.pval[i] = pnorm(abs(x[nx+i] - forecast$pred[i]) / locSD)
}
perf.mape[1] = abs(perf.pe[1])
perf.mse[1] = abs(perf.se[1])
for (i in 2:fx) {
perf.mape[i] = perf.mape[i-1] + abs(perf.pe[i])
perf.mape1[i] = perf.mape[i] / i
perf.mse[i] = perf.mse[i-1] + perf.se[i]
perf.mse1[i] = perf.mse[i] / i
}
perf.rmse = sqrt(perf.mse1)
bitmap(file='test2.png')
plot(forecast$pred, pch=19, type='b',main='ARIMA Extrapolation Forecast', ylab='Forecast and 95% CI', xlab='time',ylim=c(min(lb),max(ub)))
dum <- forecast$pred
dum[1:par1] <- x[(nx+1):lx]
lines(dum, lty=1)
lines(ub,lty=3)
lines(lb,lty=3)
dev.off()
load(file='createtable')
a<-table.start()
a<-table.row.start(a)
a<-table.element(a,'Univariate ARIMA Extrapolation Forecast',9,TRUE)
a<-table.row.end(a)
a<-table.row.start(a)
a<-table.element(a,'time',1,header=TRUE)
a<-table.element(a,'Y[t]',1,header=TRUE)
a<-table.element(a,'F[t]',1,header=TRUE)
a<-table.element(a,'95% LB',1,header=TRUE)
a<-table.element(a,'95% UB',1,header=TRUE)
a<-table.element(a,'p-value
(H0: Y[t] = F[t])',1,header=TRUE)
a<-table.element(a,'P(F[t]>Y[t-1])',1,header=TRUE)
a<-table.element(a,'P(F[t]>Y[t-s])',1,header=TRUE)
mylab <- paste('P(F[t]>Y[',nx,sep='')
mylab <- paste(mylab,'])',sep='')
a<-table.element(a,mylab,1,header=TRUE)
a<-table.row.end(a)
for (i in (nx-par5):nx) {
a<-table.row.start(a)
a<-table.element(a,i,header=TRUE)
a<-table.element(a,x[i])
a<-table.element(a,'-')
a<-table.row.end(a)
}
for (i in 1:fx) {
a<-table.row.start(a)
a<-table.element(a,nx+i,header=TRUE)
a<-table.element(a,round(x[nx+i],4))
a<-table.element(a,round(forecast$pred[i],4))
a<-table.element(a,round(lb[i],4))
a<-table.element(a,round(ub[i],4))
a<-table.element(a,round((1-prob.pval[i]),4))
a<-table.element(a,round((1-prob.dec[i]),4))
a<-table.element(a,round((1-prob.sdec[i]),4))
a<-table.element(a,round((1-prob.ldec[i]),4))
a<-table.row.end(a)
}
a<-table.end(a)
table.save(a,file='mytable.tab')
a<-table.start()
a<-table.row.start(a)
a<-table.element(a,'Univariate ARIMA Extrapolation Forecast Performance',7,TRUE)
a<-table.row.end(a)
a<-table.row.start(a)
a<-table.element(a,'time',1,header=TRUE)
a<-table.element(a,'% S.E.',1,header=TRUE)
a<-table.element(a,'PE',1,header=TRUE)
a<-table.element(a,'MAPE',1,header=TRUE)
a<-table.element(a,'Sq.E',1,header=TRUE)
a<-table.element(a,'MSE',1,header=TRUE)
a<-table.element(a,'RMSE',1,header=TRUE)
a<-table.row.end(a)
for (i in 1:fx) {
a<-table.row.start(a)
a<-table.element(a,nx+i,header=TRUE)
a<-table.element(a,round(perc.se[i],4))
a<-table.element(a,round(perf.pe[i],4))
a<-table.element(a,round(perf.mape1[i],4))
a<-table.element(a,round(perf.se[i],4))
a<-table.element(a,round(perf.mse1[i],4))
a<-table.element(a,round(perf.rmse[i],4))
a<-table.row.end(a)
}
a<-table.end(a)
table.save(a,file='mytable1.tab')